Chart of the day: Over 700,000 Aussie jobs lost
Economists have been asking for an equivalent of the US monthly payrolls series in Australia for decades. Sure, the Australian Bureau of Statistics’ (ABS) monthly jobs report is one of its largest, surveying over 26,000 households. Unfortunately, that only covers 0.32% of the population over 15 years old. Wouldn’t it be better to use the tax data? Don’t large Australian companies who employ thousands of people know how many staff are on their payroll every week and every month (when they pay them)? Seems like a simple idea.
So yesterday, the ABS amid the COVID-19 crisis released some valuable new data, namely Weekly payrolls. Credit to ABS (and the Government who probably finally funded it to look at this data). As UBS noted yesterday, “this is by far the most accurate labour force data given it uses the ATO's Single Touch Payroll system covering 99% of substantial employers (those with 20+ employees) and 71% of small employers (less than 20 employees).” What a great idea!
This new data is shown as a three-week moving average in today’s chart. One interesting thing we can see is that through February and March, the jobs market was showing no significant negative impact from COVID-19. But in the first week of April, 714,000 jobs were lost, taking the total to 785,000 jobs over the three weeks to the first week of April. Now, maybe this data won’t align exactly to ‘unemployment’ as someone working two jobs might have only lost one. Further, the Government’s subsequent ‘job keeper’ program may see some re-hiring later in April, while some folk who have lost their job may drop out of the labour force. Nonetheless, a 785,000 loss of jobs, according to UBS, pretty easily equates to a 9-10% unemployment rate. It may take some months to get there but, based on this data, a rise to 10% unemployment (particularly as more jobs have been lost through April) seems highly likely.
Assuming we see these data again in another month, it will be a key source of information for monitoring the impact of the shutdown on the economy, including as that shutdown is progressively lifted, most likely through May and June. As Reserve Bank of Australia (RBA) Governor Lowe said yesterday, due to "the restrictions and the uncertainty …over the first half of 2020 we are likely to experience the biggest contraction…since the 1930s", with real GDP "likely to fall by around 10%" in the first half of 2020, “mostly in Q2”. Still, the RBA is looking for the economy to start recovering in Q3 and, after a fall this year, that might be as much as 6%. The RBA expects the economy “to strengthen from there...to grow very strongly next year, with GDP growth of perhaps 6–7%”. While this timing closely aligns with our U-shaped scenario, that pace of growth in 2021 would no doubt feel much more like a V-shaped pick up.
Weekly change in employment (thousands)
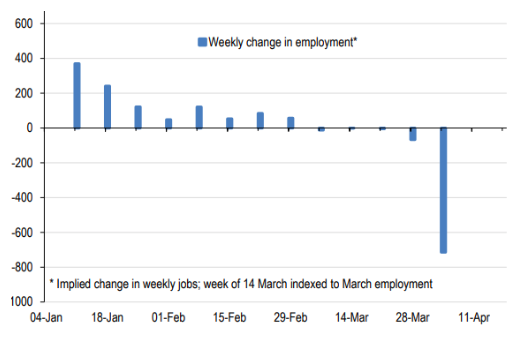
Source: ABS, UBS.
Be the first to know
I’ll be sharing Crestone Wealth Management's views as new developments unfold. Click the ‘FOLLOW’ button below to be the first to hear from us
Never miss an update
Enjoy this wire? Hit the ‘like’ button to let us know.
Stay up to date with my current content by
following me below and you’ll be notified every time I post a wire
Scott has more than 20 years’ experience in global financial markets and investment banking, providing extensive economics research and investment strategy across equity and fixed income markets.
........
General advice notice: Unless otherwise indicated, any financial product advice in this email is general advice and does not take into account your objectives, financial situation or needs. You should consider the appropriateness of the advice in light of these matters, and read the Product Disclosure Statement for each financial product to which the advice relates, before taking any action. © Crestone Wealth Management Limited ABN 50 005 311 937 AFS Licence No. 231127. This email (including attachments) is for the named person’s use only and may contain information which is confidential, proprietary or subject to legal or other professional privilege. If you have received this email in error, confidentiality and privilege are not waived and you must not use, disclose, distribute, print or copy any of the information in it. Please immediately delete this email (including attachments) and all copies from your system and notify the sender. We may intercept and monitor all email communications through our networks, where legally permitted

2 topics
1 contributor mentioned

Scott has more than 20 years’ experience in global financial markets and investment banking, providing extensive economics research and investment strategy across equity and fixed income markets.
Expertise
Scott has more than 20 years’ experience in global financial markets and investment banking, providing extensive economics research and investment strategy across equity and fixed income markets.
Expertise
Comments
Comments
Sign In or Join Free to comment