Chart of the day: price targets for S&P500 in 2020
Much global human activity is grinding to a halt as Q2 2020 gets underway. Rolling lockdowns of economies around the world have driven sharp falls in leading indicators across most of Europe and the UK (and initially China in Q1 where activity has now begun to pick up again). And now also in the US, as the Government belatedly responds to the COVID-19 outbreak, ensconced in the rights of the individual over the collective as it watches new cases skyrocket to almost 250,000 (and the world passes 1 million). The US has raced to first, second and third place in the (not delayed) COVID-19 Olympics of 2020. Over the past couple of days UBS economists have revised Q2 US growth to -6.3% quarter-on-quarter (was -2.3%) and in Australia to -10% quarter-on-quarter (was -7%). These are big numbers!
The sharp curtailment of activity in the US has delivered another stunning record rise in US jobless claims, which spiked to 6.65 million from 3.31 million (and, as a reminder, the prior record was 695,000 in October 1982). As mentioned this time last week, attention should be focused not on tonight’s US payrolls report (cons -100,000), but on April’s losses in a month’s time, which some now suggest might be -10 million (with a 10% unemployment rate). US equity markets, however, managed to take the unemployment data in its stride, focused instead on Trump speculation that Russia and OPEC are close to a deal (or maybe they are close to sitting down and having a chat again?). Oil prices have risen 20-25% overnight—a positive, if sustained, for markets.
Indeed, both the early signs of the market’s resilience in the face of weak US data and speculation Russia and OPEC may be meeting are two of the three items remaining on our checklist of six signals for finding an equity market trough. They can’t be ticked quite yet, but progress overnight is material. The outstanding item remains ‘peak disease’. And there lies much of the uncertainty over the outlook…and brings us to our chart today. From UBS Equity Strategy, the range of analysts’ forecasts for the S&P 500 index end-2020 (as at end-March). As the chart shows, from today’s 2,527 close, the range of analysts’ estimates is from 2,650 to 3,500. In terms of growth, that’s a range of +4.9% to +38.5%. These are indeed uncertain times.
Range of strategist price targets for S&P 500 in 2020
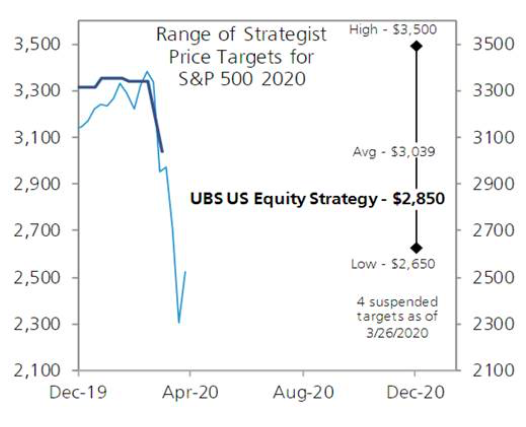
Source: UBS Equity Strategy.
Be the first to know
I’ll be sharing Crestone Wealth Management's views as new developments unfold. Click the ‘FOLLOW’ button below to be the first to hear from us.
Never miss an update
Enjoy this wire? Hit the ‘like’ button to let us know.
Stay up to date with my current content by
following me below and you’ll be notified every time I post a wire
Scott has more than 20 years’ experience in global financial markets and investment banking, providing extensive economics research and investment strategy across equity and fixed income markets.
........
General advice notice: Unless otherwise indicated, any financial product advice in this email is general advice and does not take into account your objectives, financial situation or needs. You should consider the appropriateness of the advice in light of these matters, and read the Product Disclosure Statement for each financial product to which the advice relates, before taking any action. © Crestone Wealth Management Limited ABN 50 005 311 937 AFS Licence No. 231127. This email (including attachments) is for the named person’s use only and may contain information which is confidential, proprietary or subject to legal or other professional privilege. If you have received this email in error, confidentiality and privilege are not waived and you must not use, disclose, distribute, print or copy any of the information in it. Please immediately delete this email (including attachments) and all copies from your system and notify the sender. We may intercept and monitor all email communications through our networks, where legally permitted

2 topics
1 contributor mentioned

Scott has more than 20 years’ experience in global financial markets and investment banking, providing extensive economics research and investment strategy across equity and fixed income markets.
Expertise
Scott has more than 20 years’ experience in global financial markets and investment banking, providing extensive economics research and investment strategy across equity and fixed income markets.
Expertise
Comments
Comments
Sign In or Join Free to comment