Chart Of The Week: Commodity Valuations
This week it's Commodities, specifically an aggregate view of commodities and a look at valuations. Commodities as an asset class rose from relative obscurity to become a popular addition to portfolios by the more innovative asset allocators in the last 10-15 years. Although the "commodities supercycle" perhaps overstated some of the historical return statistics, it's clear that commodities go through cycles and there is fairly clear economic logic behind the argument that they can offer diversification benefits.
But given the nature of the chart below, rather than dwell on portfolio construction aspects, I will focus on the cycle dynamics, and where commodities sit at this point of the market cycle. The chart shows the GSCI, which is a relatively popular diversified commodities index, and our composite valuation indicator. The bottom line is that after what has already been a solid rebound, commodities still look good value at this point.
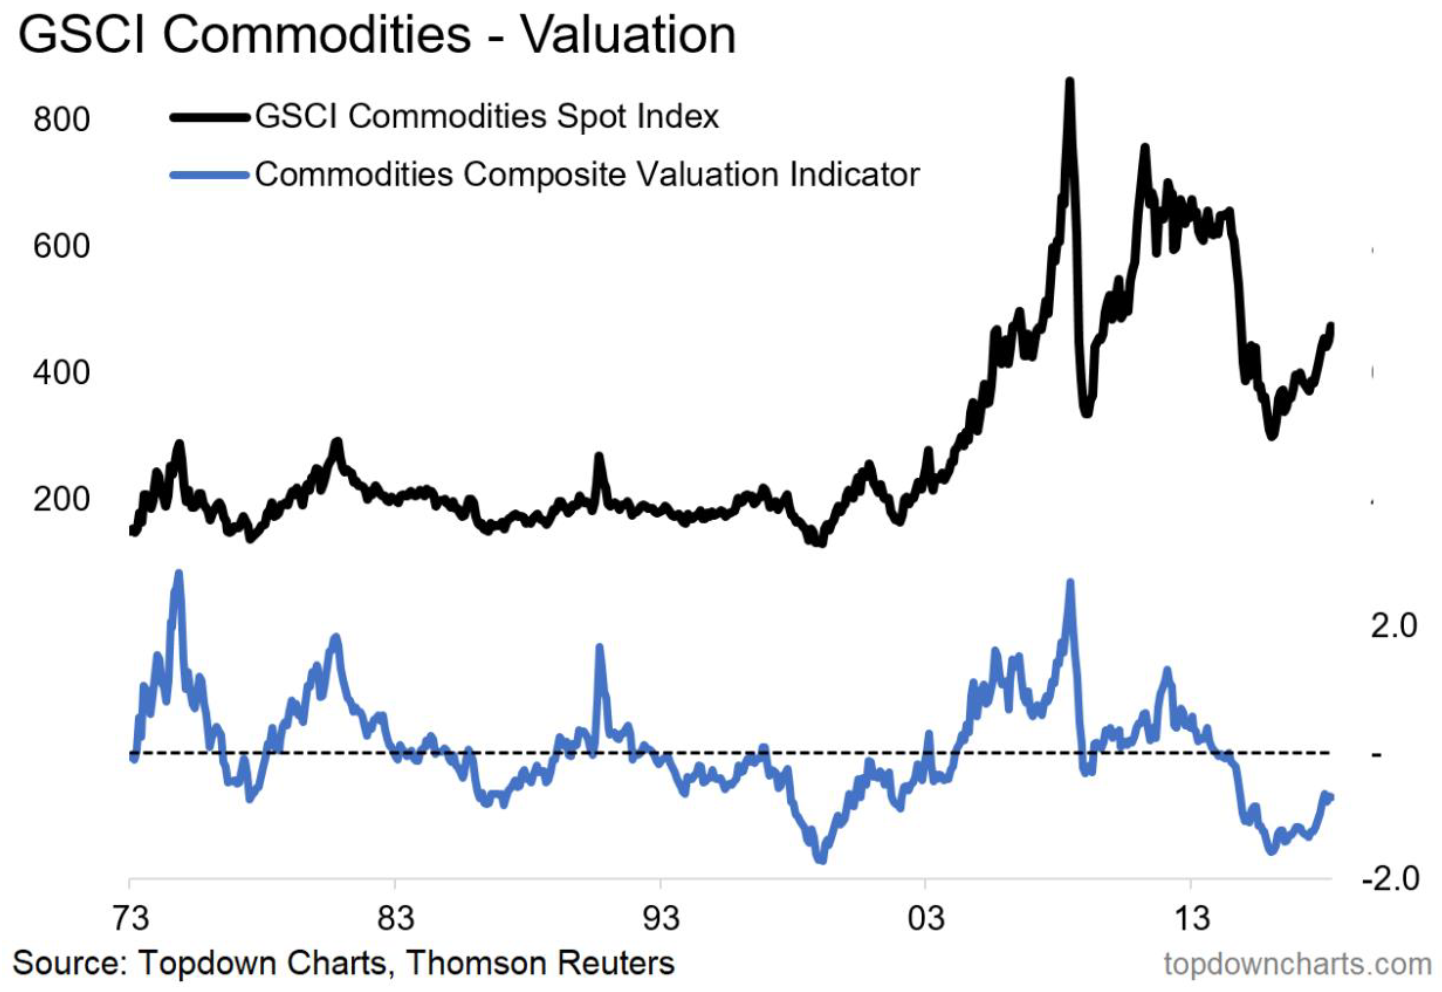
The composite valuation indicator incorporates signals from long term mean reversion, trend reversion, real prices, and relative performance against equities. But even looking beyond valuation, the point where we are at in the economic/market cycle is typically the part where commodities tend to do well. The traditional conceptual market model is that equities tend to do well during the early stages of an economic recovery, commodities tend to do well when the economy is overheating and inflationary pressures are rising (and then in the later stages of the cycle cash helps preserve capital, and bonds do well in the recessionary phase).
The various cycle indicators we monitor add support to the notion that commodities in aggregate terms have room to run, although I would note that the view across individual commodities is a little more nuanced as certain commodities face short-medium term headwinds. The key risks to the view that commodities go up, would be another round of strength in the US dollar, and slower than expected growth in China. Both of these risks are certainly on our radar, so the final point is that valuation signals tend to work best over the medium-longer term... in other words, commodity prices probably wont go up in a straight line!
Never miss an update
Enjoy this wire? Hit the ‘like’ button to let us know.
Stay up to date with my current content by
following me below and you’ll be notified every time I post a wire
Callum is Head of Research at Topdown Charts.
Topdown Charts is a chart-driven macro research house covering global Asset Allocation and Economics.

1 topic

Callum is Head of Research at Topdown Charts. Topdown Charts is a chart-driven macro research house covering global Asset Allocation and Economics.
Expertise
Callum is Head of Research at Topdown Charts. Topdown Charts is a chart-driven macro research house covering global Asset Allocation and Economics.
Expertise
Comments
Comments
Sign In or Join Free to comment