COVID economic indicators - side effects or sectoral balances?

We are in the midst of a one-in-100-year pandemic, and unemployment has reached levels not seen since the Great Depression. And while market observers continue to marvel / scratch heads regarding the surge in global equity prices, some truly unexpected real estate metrics continue to emerge.
First, it was widely expected by many economists and observers that the local residential market was poised to crash by up to 30%. However, to date, the data is not playing out as expected.
A pandemic and one million people unemployed, so house prices are … going up?
While it’s early days, some of the best real-time data we have (in this instance, preliminary auction clearance rates) suggest house prices are not (yet) falling in a meaningful way. In fact, a case can be made that by the time we reach the fourth quarter this year, residential prices in some of our main cities will be rising.
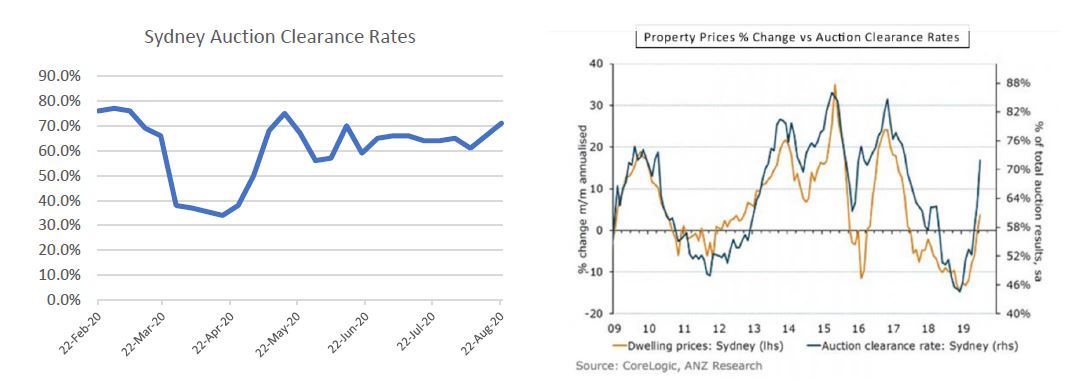
Source: Domain, CoreLogic, ANZ Research, Quay Global Investors
Of course, auction clearance rates are not perfect – but over the long term there is a steady relationship between clearance rates and residential price movements. Since the end of the lockdown in Sydney, clearance rates have generally oscillated around 60%, suggesting a flat to rising market.
Don’t take our word for it – it appears to be happening elsewhere too
The incredible resilience of our domestic residential market is consistent with observations in other parts of the world.
In the UK, house prices are accelerating at their fastest pace since BREXIT.
.jpg)
Source: Bloomberg, Quay Global Investors
And in the US, despite the sharp rise in mortgage delinquency rates, prospective home buyer activity (foot traffic) is at its highest level since 1994, matching the recent surge in existing home sales.
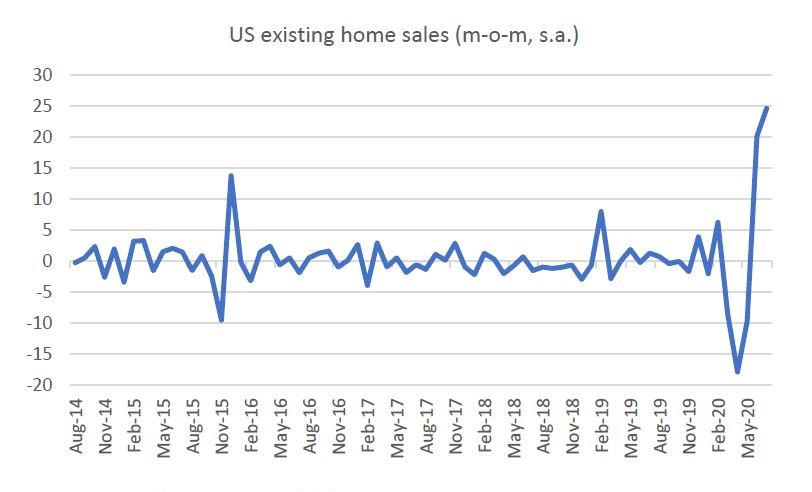
Source: US Bureau of Economics, Quay Global Investors
And it’s not just residential – check out retail
Another economic indicator that appears to defy the current economic narrative has been retail sales.
Preliminary ABS retail sales for July showed retail sales are up 3.3% on a sequential basis, and up 12.2% year on year. This bounce is more than just a catch-up from the April slump. On a rolling 12-month basis, we estimate Australian retail sales are now up 3.7% compared to the previous corresponding period.
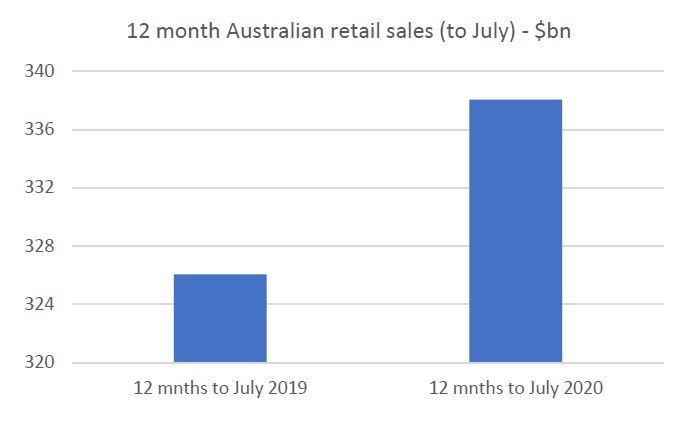
Source: ABS, Quay Global Investors
Australians have spent an additional $12 billion in the 12 months to July 2020 compared to the 12 months to July 2019. And it’s not all online either. During the recent Scentre group earnings call, it was noted that portfolio in-store retail sales during July were above those of July 2019, including Victoria (which went into lockdown on 9 July).
We can observe similar data in the US, and while not quite as strong as Australia, total retail sales are higher on a rolling 12-month basis.
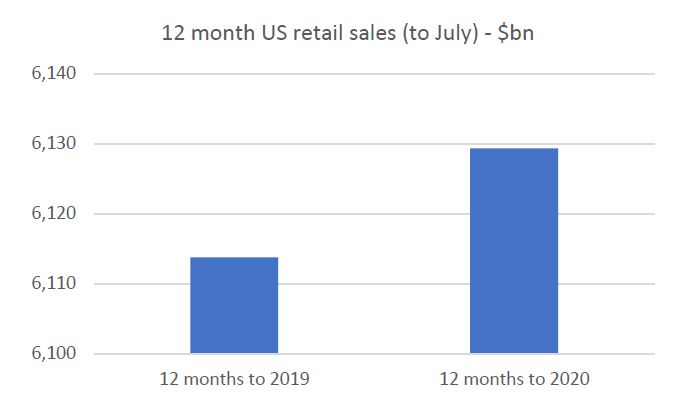
Source: US Census Bureau, Quay Global Investors
And in Germany, retail sales for the six months to June are 0.8% higher than the previous six months.
So, what’s happening?
Explaining the data via sectoral balances
It would be easy to suggest the observed data in residential and retail is a result of a ‘sugar high’ from fiscal stimulus – and indeed, that could be part of the story. Also, many consumers have been denied certain spending ‘avenues’ in 2020 – most obviously air travel and eating out. The additional dollars are simply being spent elsewhere.
But we think there is more to it.
For the best part of 10 years the common narrative is the Aussie consumer is ‘dead’. Weak wage growth coupled with very high levels of household debt has constrained the consumer. And the data supported this argument.
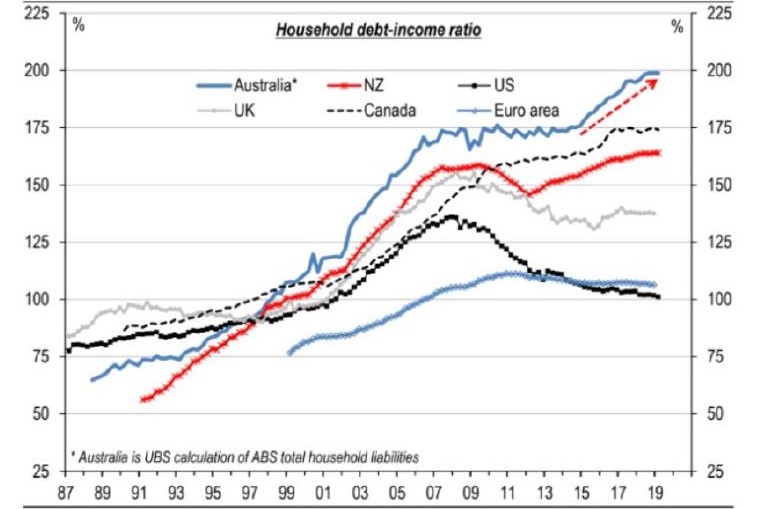
Source: ABS, Bloomberg, UBS
But the massive fiscal response to the lockdown from most governments will go a long way to repairing household balance sheets.
Regular readers of our articles will know from the sectoral balances’ framework, government financial deficits equal non-government financial surpluses. The non-government sector includes businesses, households and the foreign account (current account deficit).
Below is a chart of the sectoral balances in the US in response to the financial crisis in 2008/2009, clearly showing the significant increase in net financial assets (cash and bonds) accruing to the domestic private sector as a result of the Obama-driven American Recovery Act. This was a major reason why the US avoided repeating a second Depression.
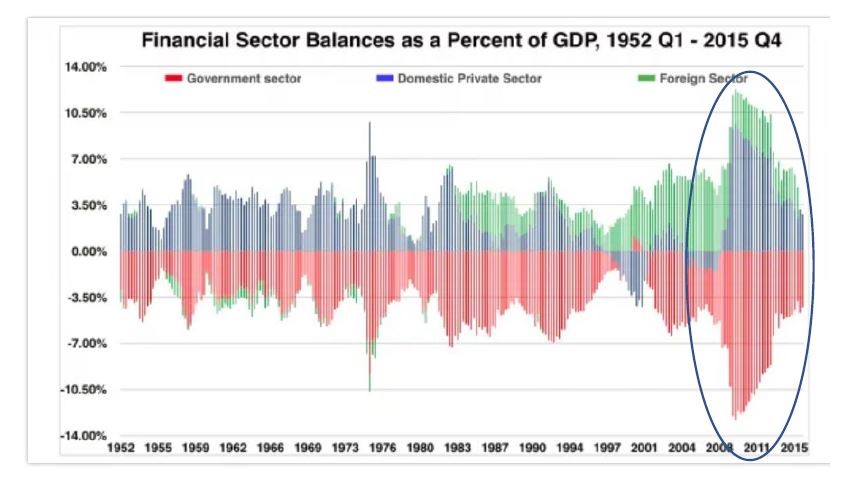
Source: Tipping Point North South
What is interesting about this chart (and Australia is similar) is the American Recovery Act deficit measured $831 billion. The current CARES act is closer to four times the size, at $3.5 trillion.
Similarly, in 2009 the Australian government stimulus to the financial crisis was $45 billion, or 4.5% of GDP. Today’s response is closer to $150bn.
Even after allowing for 10 years of inflation, the scale of spending is nowhere near comparable.
The bottom line is that household balance sheets (and corporate profits) are receiving a significant boost from net government spending, well beyond what we experienced during the financial crisis. And until governments reverse course and start generating surpluses (which we do not envisage any time soon), these net financial assets will continue to reside in the private sector, permanently repairing balance sheets and setting up households for the next cycle – as the most recent household savings ratio from the national accounts confirms.
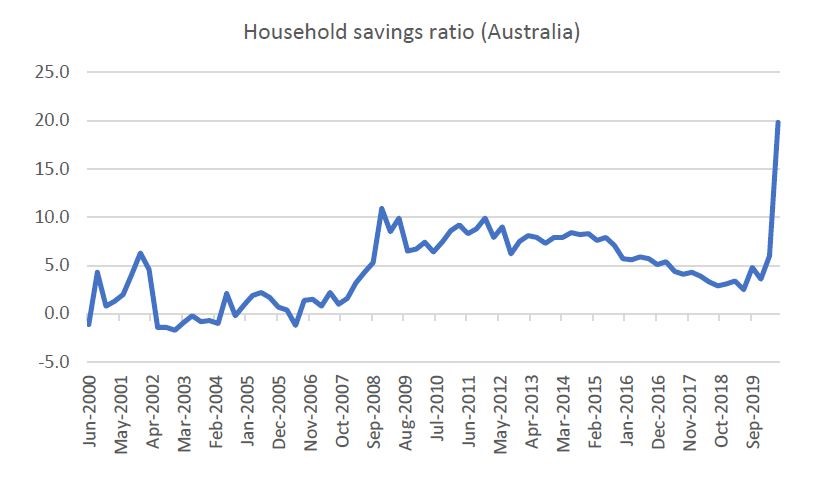
Source: ABS, Quay Global Investors
Conclusion
This has been a very unpredictable economic cycle. Despite a one-in-100-year pandemic and near depression levels of unemployment, residential property prices and retail sales are not following the doomsday script. While the recent data could be temporary, we think it is also helpful to view the recent recovery and other leading indicators from a sectoral balances’ framework.
Much in the same way that many financial commentators overestimated the power of central banks during the last decade (see last month’s article for more on this), we believe there is an equal risk they will underestimate the power of the public purse – that is, spending by the Treasury.
Interesting times ahead.
Not already a Livewire member?
Sign up today to get free access to investment ideas and strategies from Australia’s leading investors.
Australian Financial Review, 7 April 2020
Destatis Statistiches Bundesamt, press release 317, 20 August 2020
Wikipedia, accessed 1 September 2020
Article 4, The B.E. Journal of Macroeconomics, Volume 12, Issue 1 (2012)
The Guardian, 31 March 2020
Never miss an update
Enjoy this wire? Hit the ‘like’ button to let us know.
Stay up to date with my current content by
following me below and you’ll be notified every time I post a wire
Chris has nearly 30 years of experience working as a real estate specialist, with a background in investment banking and equities research. Prior to co-founding Quay, he worked in real estate investment banking at Credit Suisse and Deutsche Bank.

2 topics

Chris has nearly 30 years of experience working as a real estate specialist, with a background in investment banking and equities research. Prior to co-founding Quay, he worked in real estate investment banking at Credit Suisse and Deutsche Bank.
Chris has nearly 30 years of experience working as a real estate specialist, with a background in investment banking and equities research. Prior to co-founding Quay, he worked in real estate investment banking at Credit Suisse and Deutsche Bank.
Comments
Comments
Sign In or Join Free to comment
most popular
Funds
The 5 best-performing super funds of the year
Livewire Markets
Equities
Buy Hold Sell: 5 ASX stayers built to go the distance
Livewire Markets