TOL - 23rd May, 2025
Darkest before dawn? It’s crunch time for lithium and ASX lithium stocks
ASX lithium stocks have bounced even as the lithium price has sunk to new cycle-lows. What’s in store for both? Technicals and fundamentals.
Yesterday, I provided a detailed technical and fundamental update on the uranium price and the uranium market – discussing price action as well as current demand-side and supply-side factors. Today it’s lithium’s turn.
Coincidentally, both commodities have been touted over the last few years as the next big thing, yet both, at times, have struggled to live up to that claim due to the realities of the commodity price cycle. But just as the uranium price appears to be turning up after a short, sharp bear market, lithium’s fortunes appear to be taking another turn for the worse – its bear market appears to know no end!
Let’s kick off with the latest technical analysis for lithium, as per yours truly, and then follow with the latest on the key demand-and-supply-side drivers driving the lithium price courtesy of a new research report from major broking firm Morgan Stanley.
Lithium technical analysis factors
For those who read yesterday’s uranium analysis, this will be a handy revision tool. Let’s repeat the process of identifying the start and end of lithium’s last bull market, and afterwards, assess the current situation. To start, cast your minds back to late 2020.

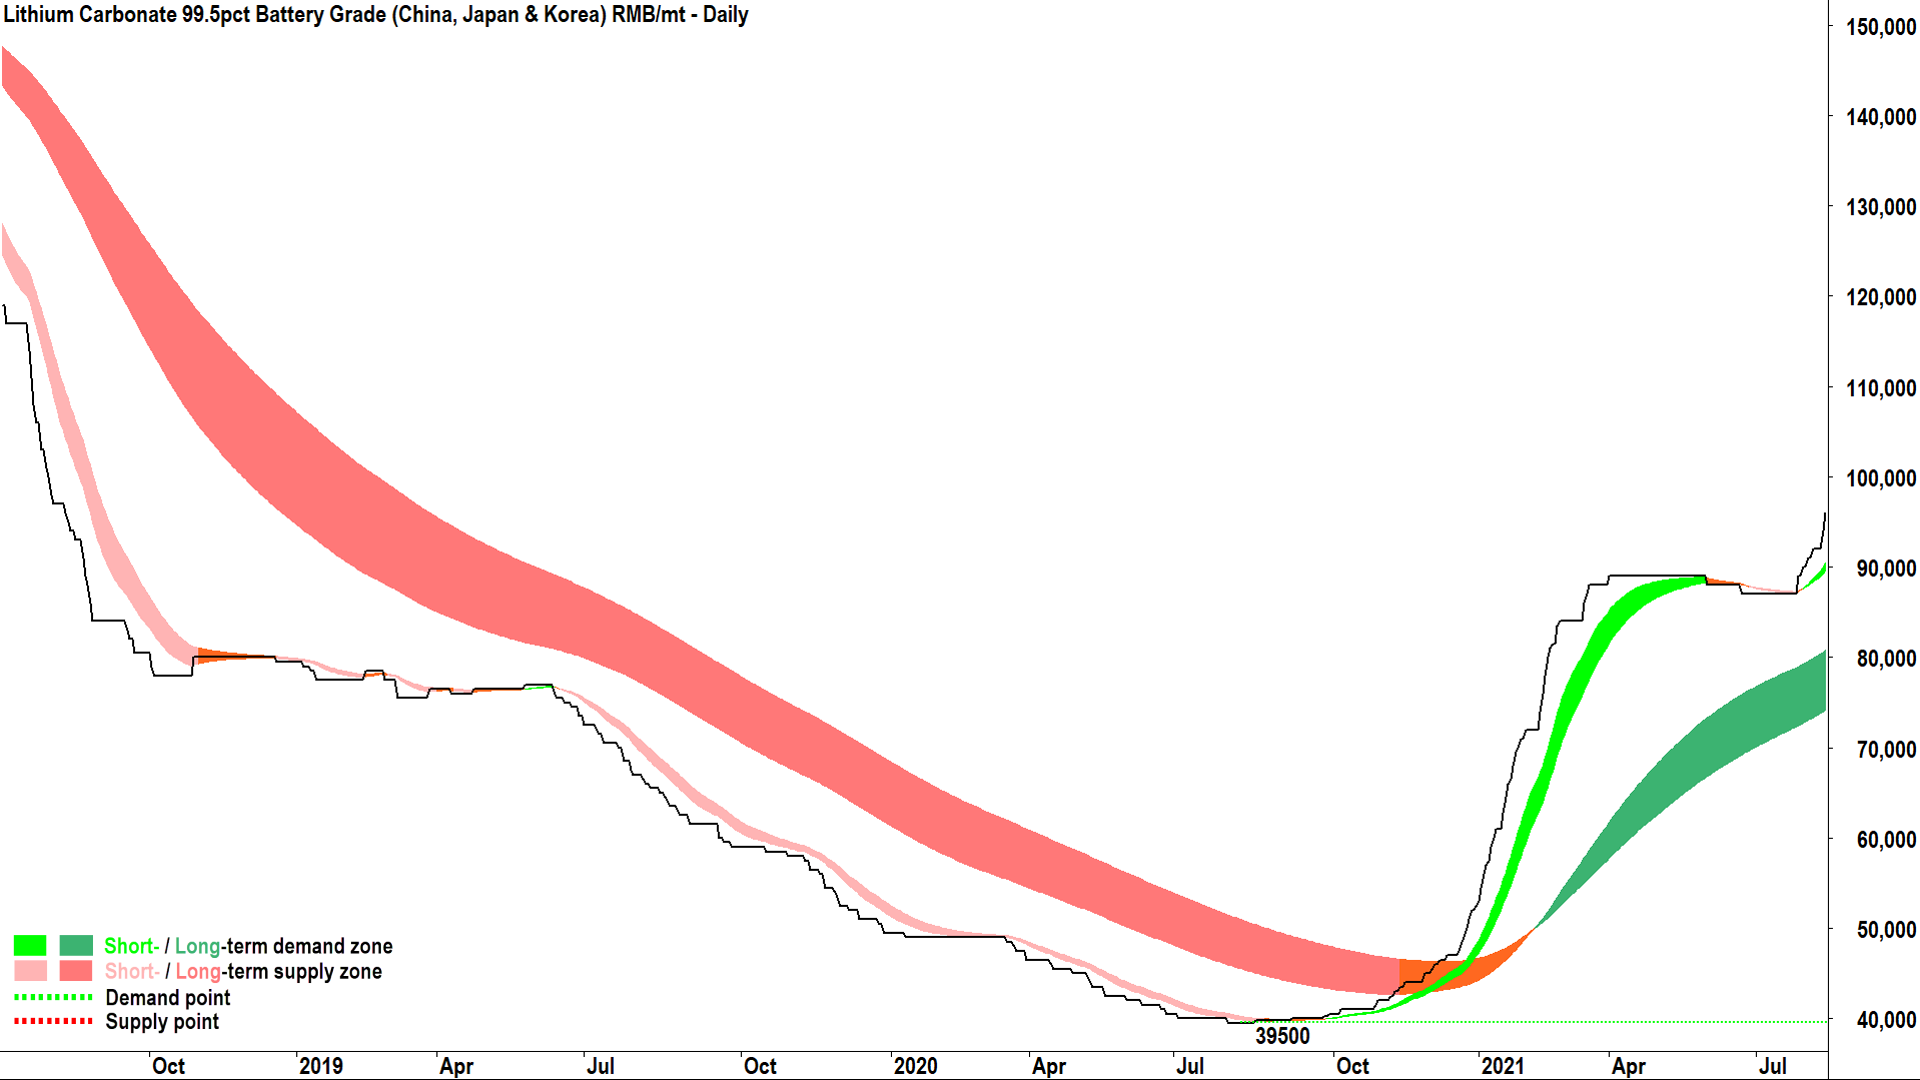
The lithium market, as measured by the industry’s lowest common denominator, lithium carbonate, is in a protracted bear market. In August, my trend ribbons are double pink, indicating short term and long term supply-side control. In September, the price crosses above the short term trend ribbon, neutralising it, and by October, the price has improved sufficiently to swing the short term trend to up.
In November, the long term trend neutralises, and the price begins to trade inside the long term trend ribbon. By December, it’s trading above it, the short term trend is now powering ahead – and all we need to call a new bull market is the tell-tale trough above the long term trend ribbon, therefore indicating it had transitioned to a zone of dynamic excess demand.
Here’s the catch. It doesn’t come until 26 July 2021. This is because at the time, lithium carbonate was not like other commodities that traded in an open and liquid market with futures contracts traded on organised exchanges that we can easily chart. Lithium carbonate futures only began trading in July 2023, and prior to this, large datasets of spot lithium pricing like that showing in the chart above sat behind expensive paywalls.
I have this price data because I’ve been manually collecting it (from end of day closes) for many years. Long story short, the lithium price did not make the peaks and troughs on its chart like uranium and other commodities more prone to daily fluctuations – instead it moved more in a step-like pattern. My point is, the first trough above the long term trend ribbon didn’t occur until the lithium carbonate price had more than doubled.

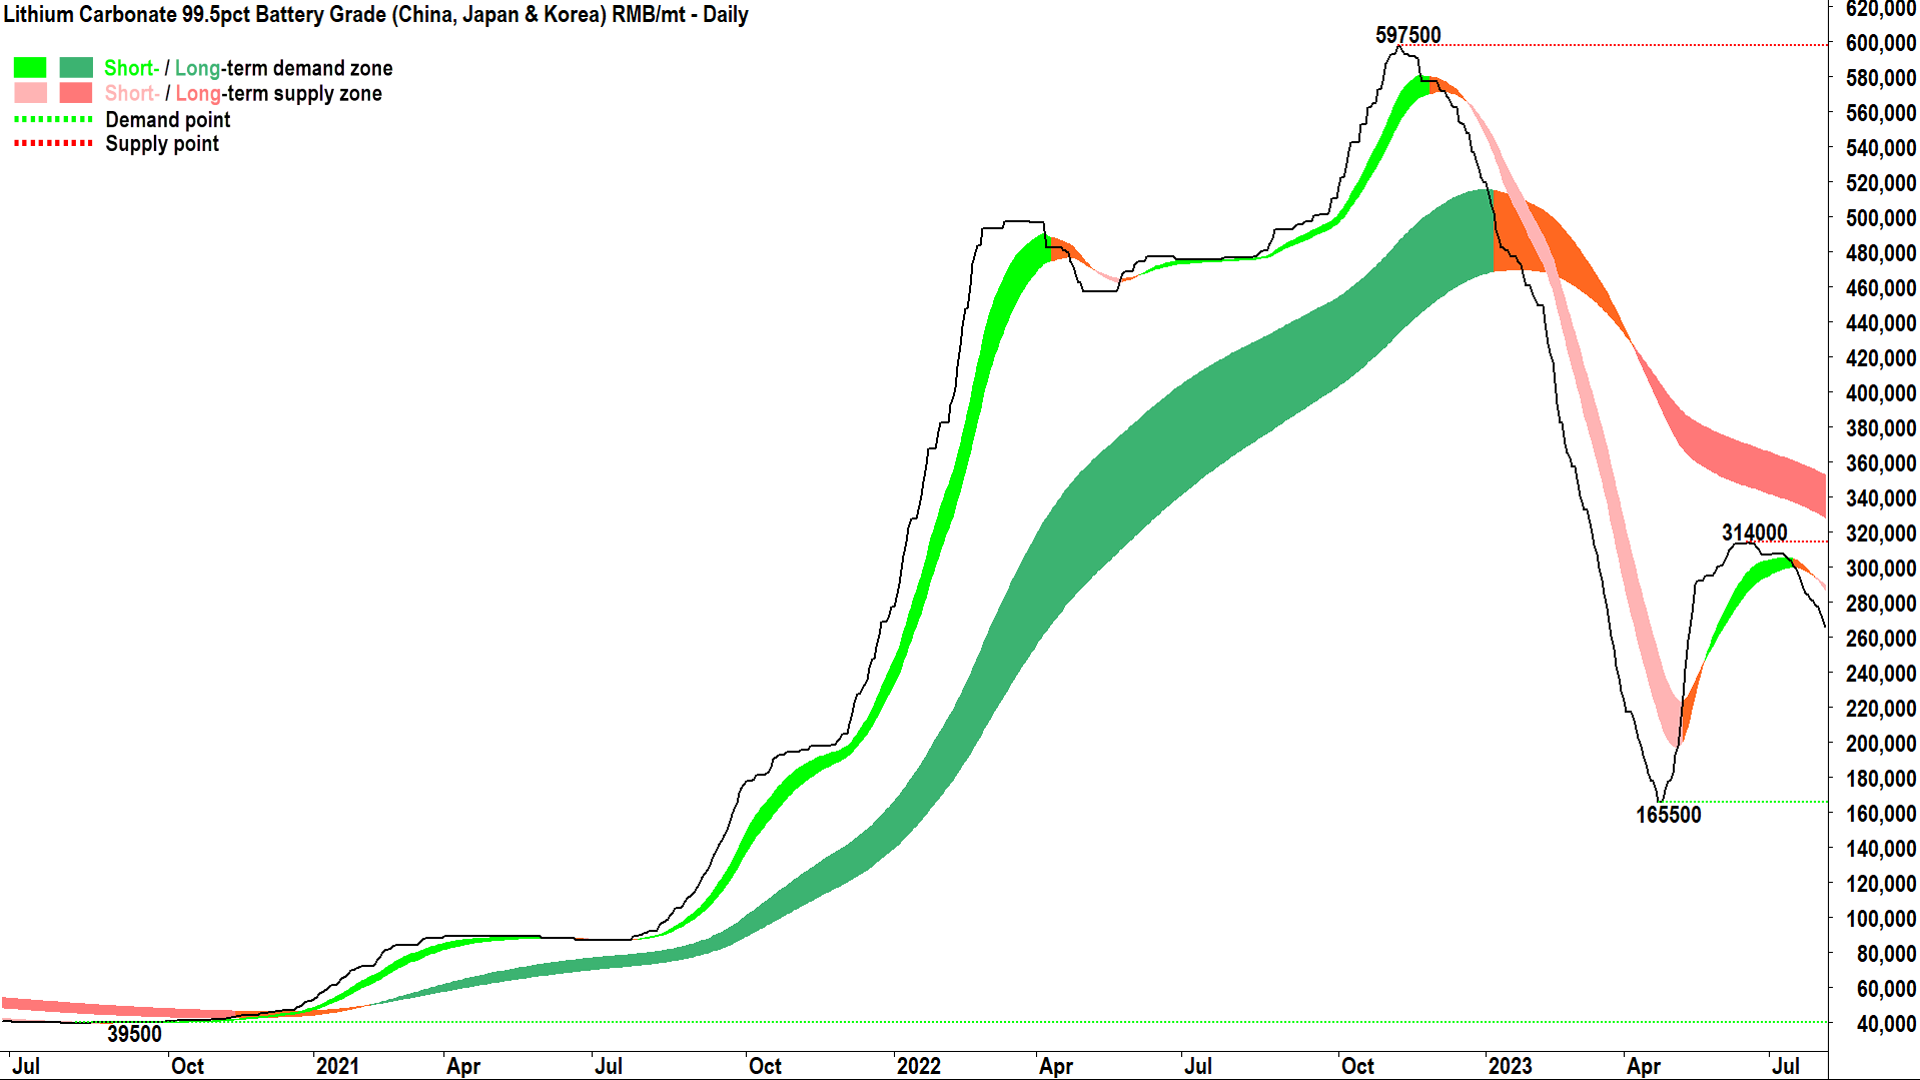
Not that the delay mattered all that much, as per the above chart, which shows what happened next. July 2023 was just the start of lithium’s amazing run. Still, I suggest it was pretty clear a new bull market in lithium carbonate had begun as early as February 2021, when my trend ribbons went double green.
1,413%. That’s how much lithium carbonate rallied from the 2020 bear market low to the bull market high of 597,500 set on 14 November 2022. I’m guessing your lithium stocks were doing pretty well at the time.
But, as they say in the classics, nothing lasts forever. First, the short term trend transitioned from up to down, then the price moved swiftly into the long term trend ribbon, which soon neutralised. That price action made this pullback different – and far more concerning from a technical standpoint – than the pullback in April 2022.
The price of lithium carbonate kept falling, closing below the long term trend ribbon (as did the short term trend ribbon, now accelerating). Again, the official bear market signal did not come until June 2023 with the setting of the first peak below the long term trend ribbon – a signal the ribbon had transitioned to a zone of dynamic excess supply.
Again, though, arguably the double pink trend ribbons by April 2023 were a sufficient giveaway a new bear market had begun. By then, I had been warning investors that the lithium bull market had ended for many months via weekly webinars I was conducting for my then-employer, but also via several media outlets.
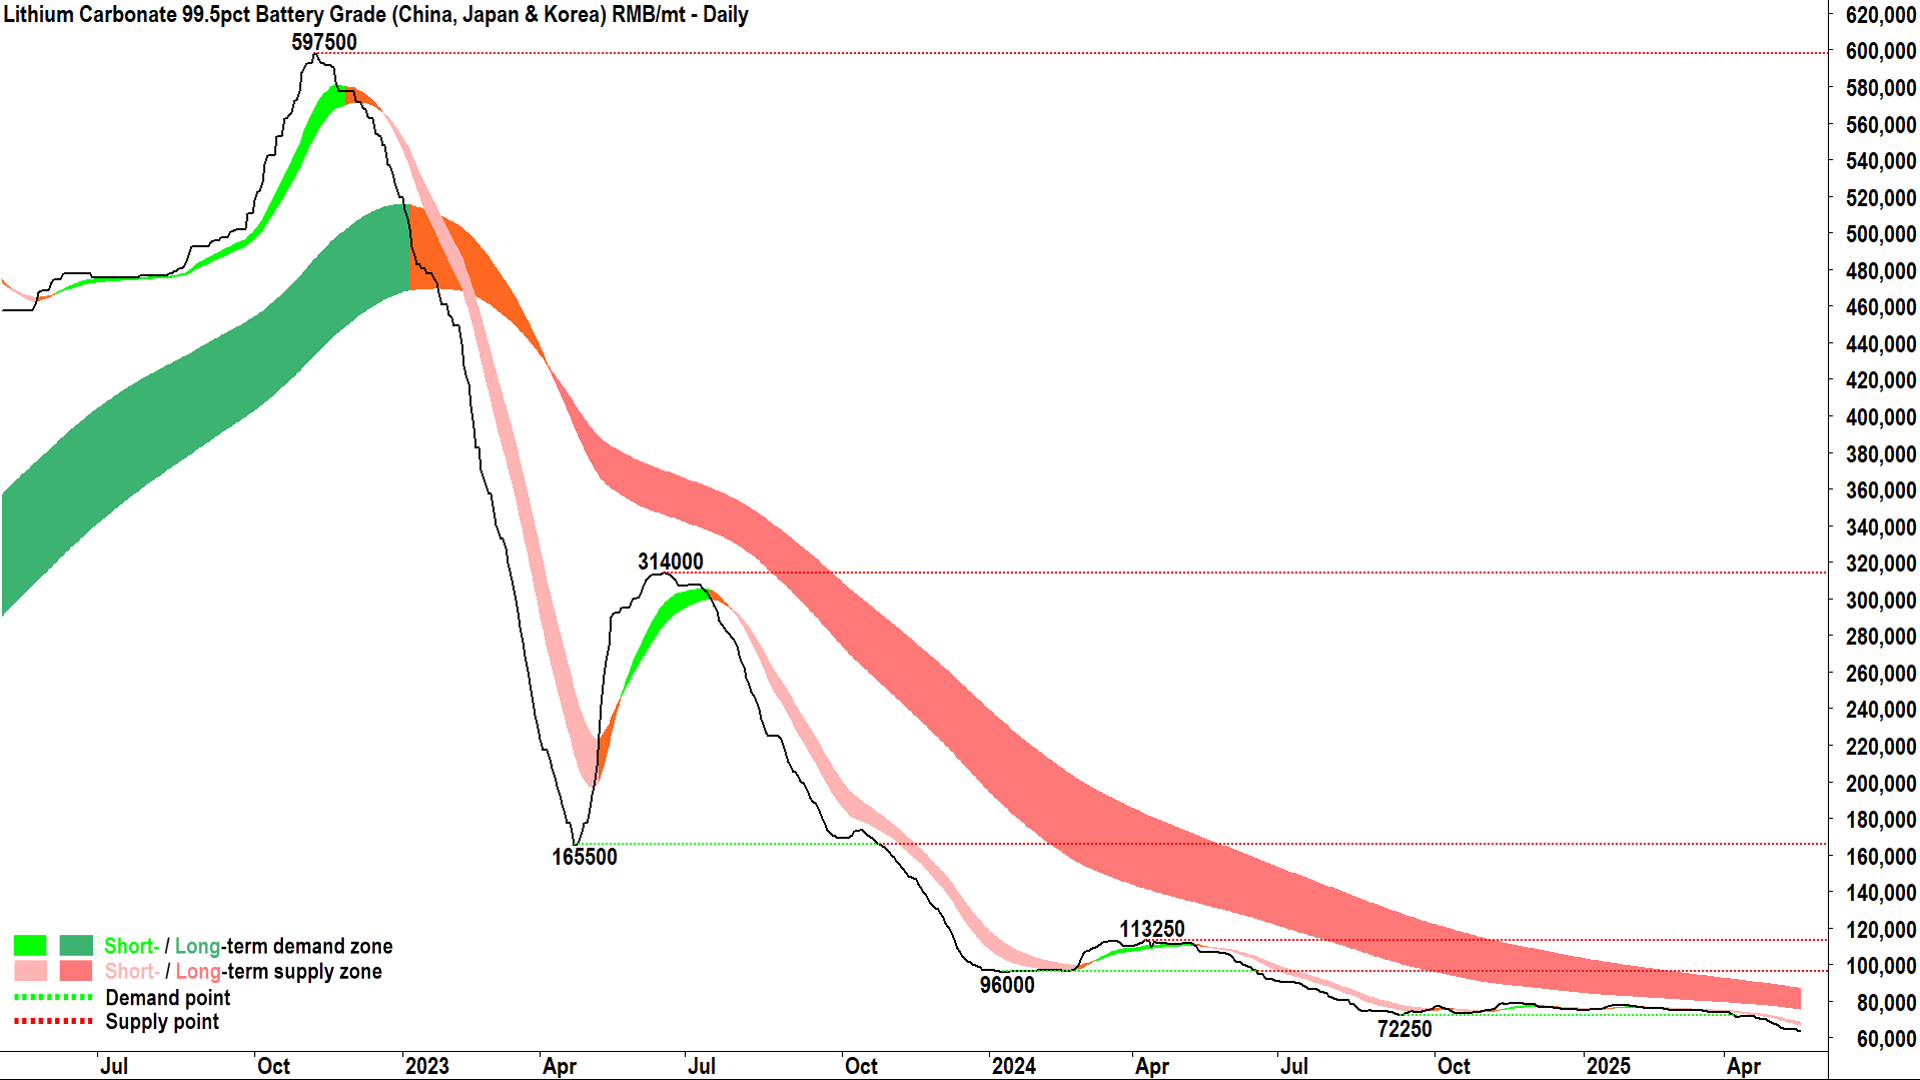
Ok, let’s fast forward to today. 1,413% up, and about 90% back down again. The chart below shows the devastating extent of the current lithium bear market. Importantly, the long term trend ribbon has done its job beautifully, like Gandalf said…”You shall not pass!” 🧙♂️.

There have been a few short term uptrends along the way, but the long term trend has never faltered – nor does it look like faltering any time soon. I say this because we’re still double pink, the short term trend looks like it’s gaining short term downward momentum – and the prospect of setting a trough above the long term trend ribbon (after it has at least neutralised) appears many months away.
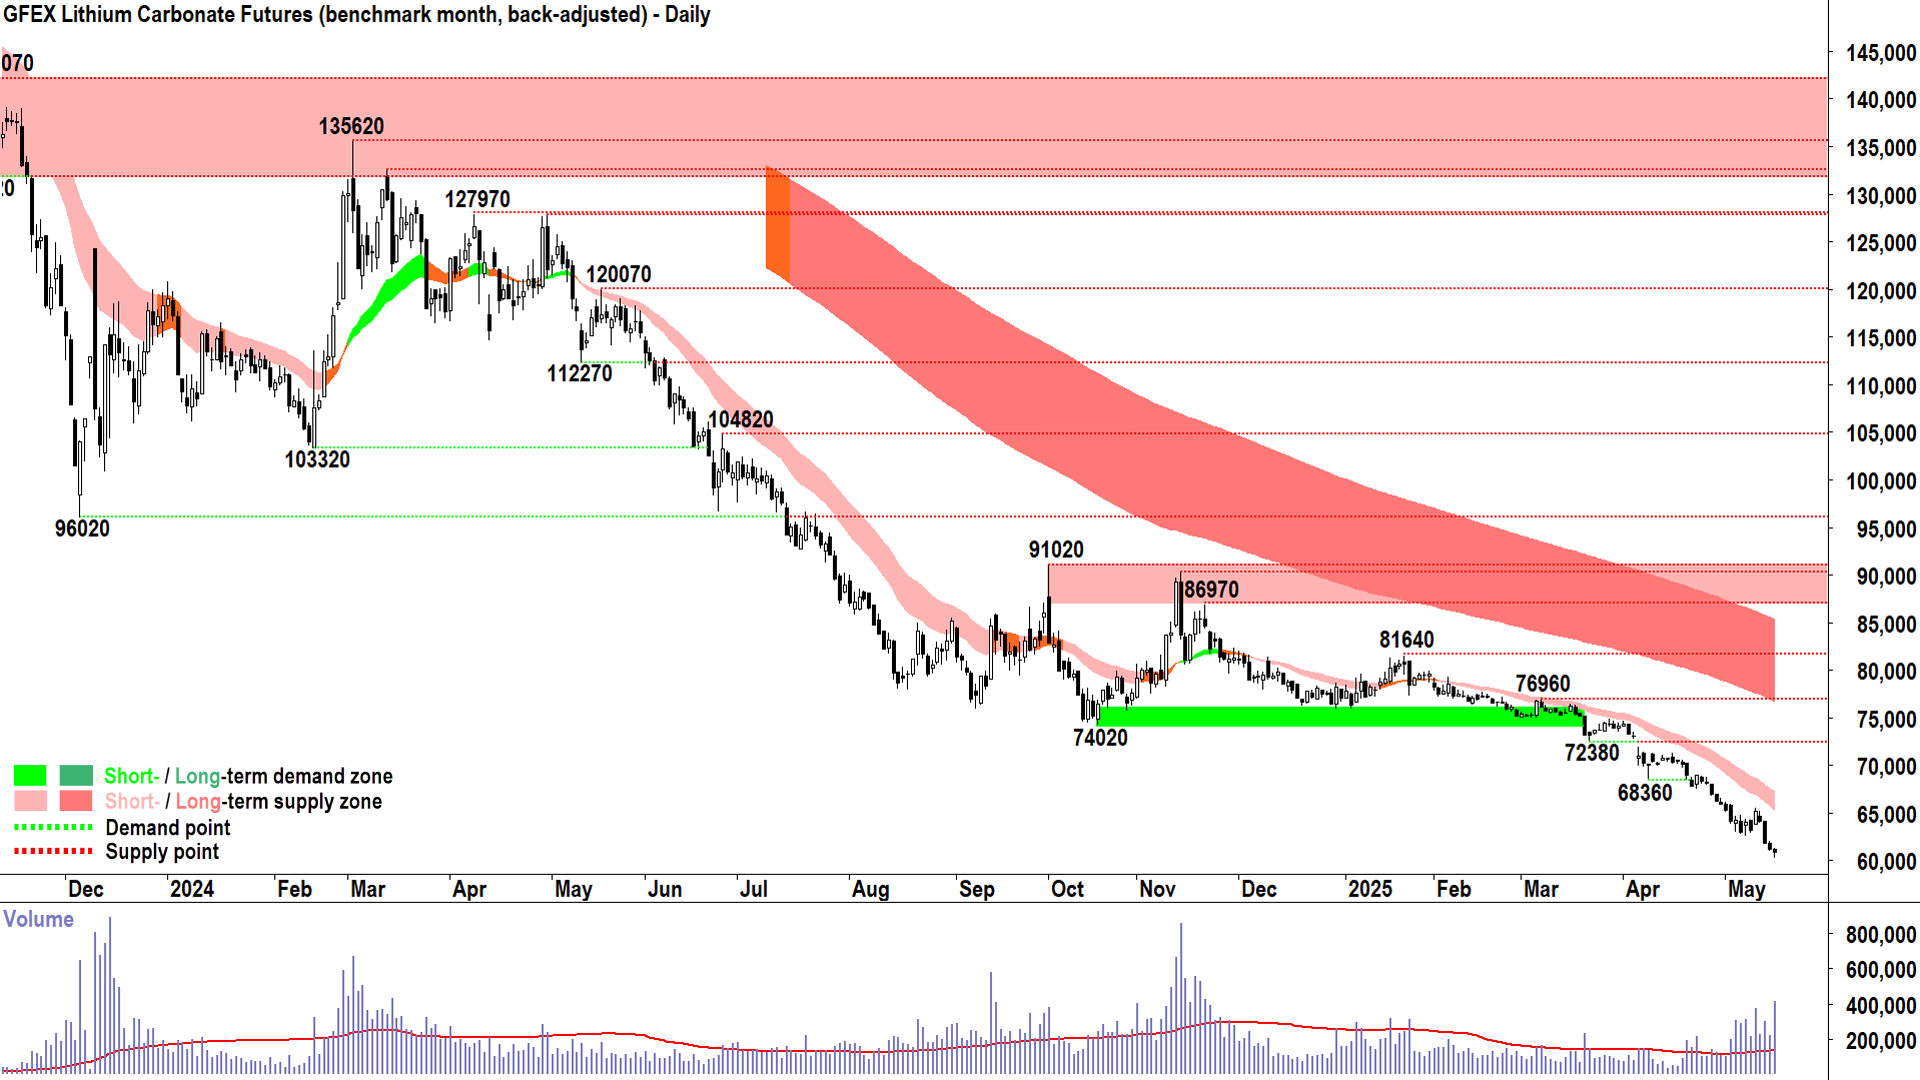
I would be remiss not to also show you a chart of lithium carbonate futures. This is the chart I have tracked since the Chinese-based futures exchange, GFEX, commenced trading them in July 2023. It doesn’t look much better in terms of trends, but you can see that we now have candles (alleluia!) and plenty of peaks and troughs to analyse. (FYI, I publish both lithium carbonate charts, as well as charts for lithium hydroxide and spodumene concentrate 6% on X each evening)

Lithium fundamental analysis factors
The technicals for lithium look bleak, but hey – it’s always darkest before the dawn, right? Perhaps the fundamentals are pointing to a turnaround that isn’t yet being picked up in the price?
Firstly, this is at odds with my brand of technical analysis which assumes the price reflects all fundamental information. Secondly, the analysts at Morgan Stanley don’t think so either! In a research report released by the firm on Friday titled "Lithium Falling, Cobalt Holding”, they provide a detailed analysis of the current critical demand-and-supply-side factors presently shaping the lithium market. Here is a summary of Morgan Stanley’s key findings:
Lithium demand factors
- Demand appears robust, with strong growth from storage (approximately 13% of lithium demand according to Morgan Stanley) and battery powered electric vehicles (BEVs).
- Morgan Stanley notes BEV sales are accelerating versus hybrids across all major regions, with BEV sales share up to a record high of 32% in China in April, and sales growth of 14% year on year in the US. Europe has shown a “similar trend”, and the broker forecasts affordability will improve in the second half of this year.
- US-China tariff rollback could “pave the way for a pick-up in energy storage battery demand in particular,” notes the broker, citing data from Platts that battery storage was the second-largest type of resource added to the US power grid in 2024.
Lithium supply factors
- Supply remains the key driving factor for lithium prices “strong supply growth, a falling cost curve and elevated inventories have weighed…Lithium's woes have come from too much supply rather than a shortage of demand,” says the broker.
- China remains the key marginal supply swing player with lithium output up 65% year to date, Morgan Stanley notes. This is a combination of hard rock (from record lepidolite production) and brine output (which should pick up over the next few months due to seasonal factors).
- Morgan Stanley also notes strong production coming from ex-China, particularly from Australia, Brazil, and Chile.
- The deluge of supply is also swelling inventories, too, with lithium concentrate stocks rising to 700kt, with “record downstream inventories of carbonate and hydroxide”, notes the broker.
Lithium price forecasts
The solution to the dissolving lithium price is quite simple, suggests Morgan Stanley, “For prices to rebound meaningfully, we would need to see more supply cuts, which are limited so far with more focus on cost-cutting,” it says.
That focus on cost cutting among major producers is an equal part of the problem, however, as the broker notes, “~350kt of supply is loss-making, but with companies actively looking to reduce their operating costs and the entry of low-cost supply, the market remains well supplied”.
Longer term, Morgan Stanley points out that a key aspect of the commodity price cycle will likely play out. “If prices remain subdued, some of the future supply developments we model that currently push our balance into a surplus could be delayed, forcing some recovery in prices,” it noted, but also balancing this theme was the ongoing view of governments that the sector should be protected and funded on a “critical mineral” basis.
The broker’s latest price forecasts for lithium carbonate are US$9,175 for 2025, US$10,250 for 2026, and US$12,375 for 2027. Compare this to the current price of US$8,745, and it suggests Morgan Stanley sees a modest recovery in the very short term, building to a more robust recovery in the medium term.
What’s in store for the lithium price and ASX lithium stocks?
The rise and fall of lithium is another excellent example of how a narrative can remain intact throughout the most amazing bull market as well as the most devastating bear market. The demand for lithium has increased steadily through both market phases – yet demand is only one-half of the price equation.
Supply, not demand, is the major problem for lithium price, and therefore, ironically also for the companies that continue to produce it and investors who have resigned themselves to being “stuck” in lithium until the next cycle.
Trend followers are never “stuck”. Their view is not beholden to any narrative, simply the price.
Uptrend, true believer – downtrend, major sceptic. And this poses a question to you the reader: Which approach do you think is more effective? 🤔
As I promised with ASX uranium stocks, I’ll produce a sector technicals vs brokers overview for ASX lithium stocks. I have to do the uranium one first – so probably next week!
Want to know more about the price cycle in uranium and other commodities? This article is compulsory reading for all investors in commodities and commodities stocks: Riding the Commodity Price Cycle: The definitive investor guide.
This article first appeared on Market Index on Wednesday 21 May, 2025.
Never miss an update
Enjoy this wire? Hit the ‘like’ button to let us know.
Stay up to date with my current content by
following me below and you’ll be notified every time I post a wire
Carl has over 30-years investing experience and has helped investors navigate several bull and bear markets over this time. He is a well respected markets commentator who specialises in how the global macro impacts Australian and US equities. Carl has a passion for technical analysis and has taught his unique brand of price-action trend following to thousands of Aussie investors.
........
Investing is risky. Inevitably you will endure losses. If you can't cope with losing, don't invest.

5 topics
14 stocks mentioned

Carl has over 30-years investing experience and has helped investors navigate several bull and bear markets over this time. He is a well respected markets commentator who specialises in how the global macro impacts Australian and US equities. Carl...
Carl has over 30-years investing experience and has helped investors navigate several bull and bear markets over this time. He is a well respected markets commentator who specialises in how the global macro impacts Australian and US equities. Carl...
Comments
Comments
Sign In or Join Free to comment