TOL - 22nd May, 2025
Is now the time to buy ASX uranium stocks? Analysis of the latest uranium technical and fundamental factors
ASX uranium stocks like Boss Energy, Paladin Energy, and Deep Yellow have rallied as the uranium price has turned higher. Can it continue?
If you've been following my analysis on the uranium chart in the ChartWatch in the Evening Wrap you’ll know that since around mid-April, the uranium price is once again on the rise. On 28 April, it had improved to the point where I was able to declare the short term downtrend over, and then on 7 May, I noted that a new short term uptrend had begun. As recently as Friday, I noted that uranium’s long term downtrend had neutralised.
Clearly then, there appears to be a changing of the guard in terms of the demand-supply dynamics for this controversial mineral – the logical choice for zero carbon emissions base-load power for generations to come – or the expensive and unnecessary white elephant of the energy transition for others.
That debate is beyond my technical analysis (thankfully), but I will in this article investigate one major research firm’s views on why the uranium price is set to resume the bull market it started just after the COVID-19 pandemic. The goal is to try to determine if the technicals and the fundamentals are again aligning to justify investing in ASX-listed and global uranium stocks.
Uranium technical analysis factors
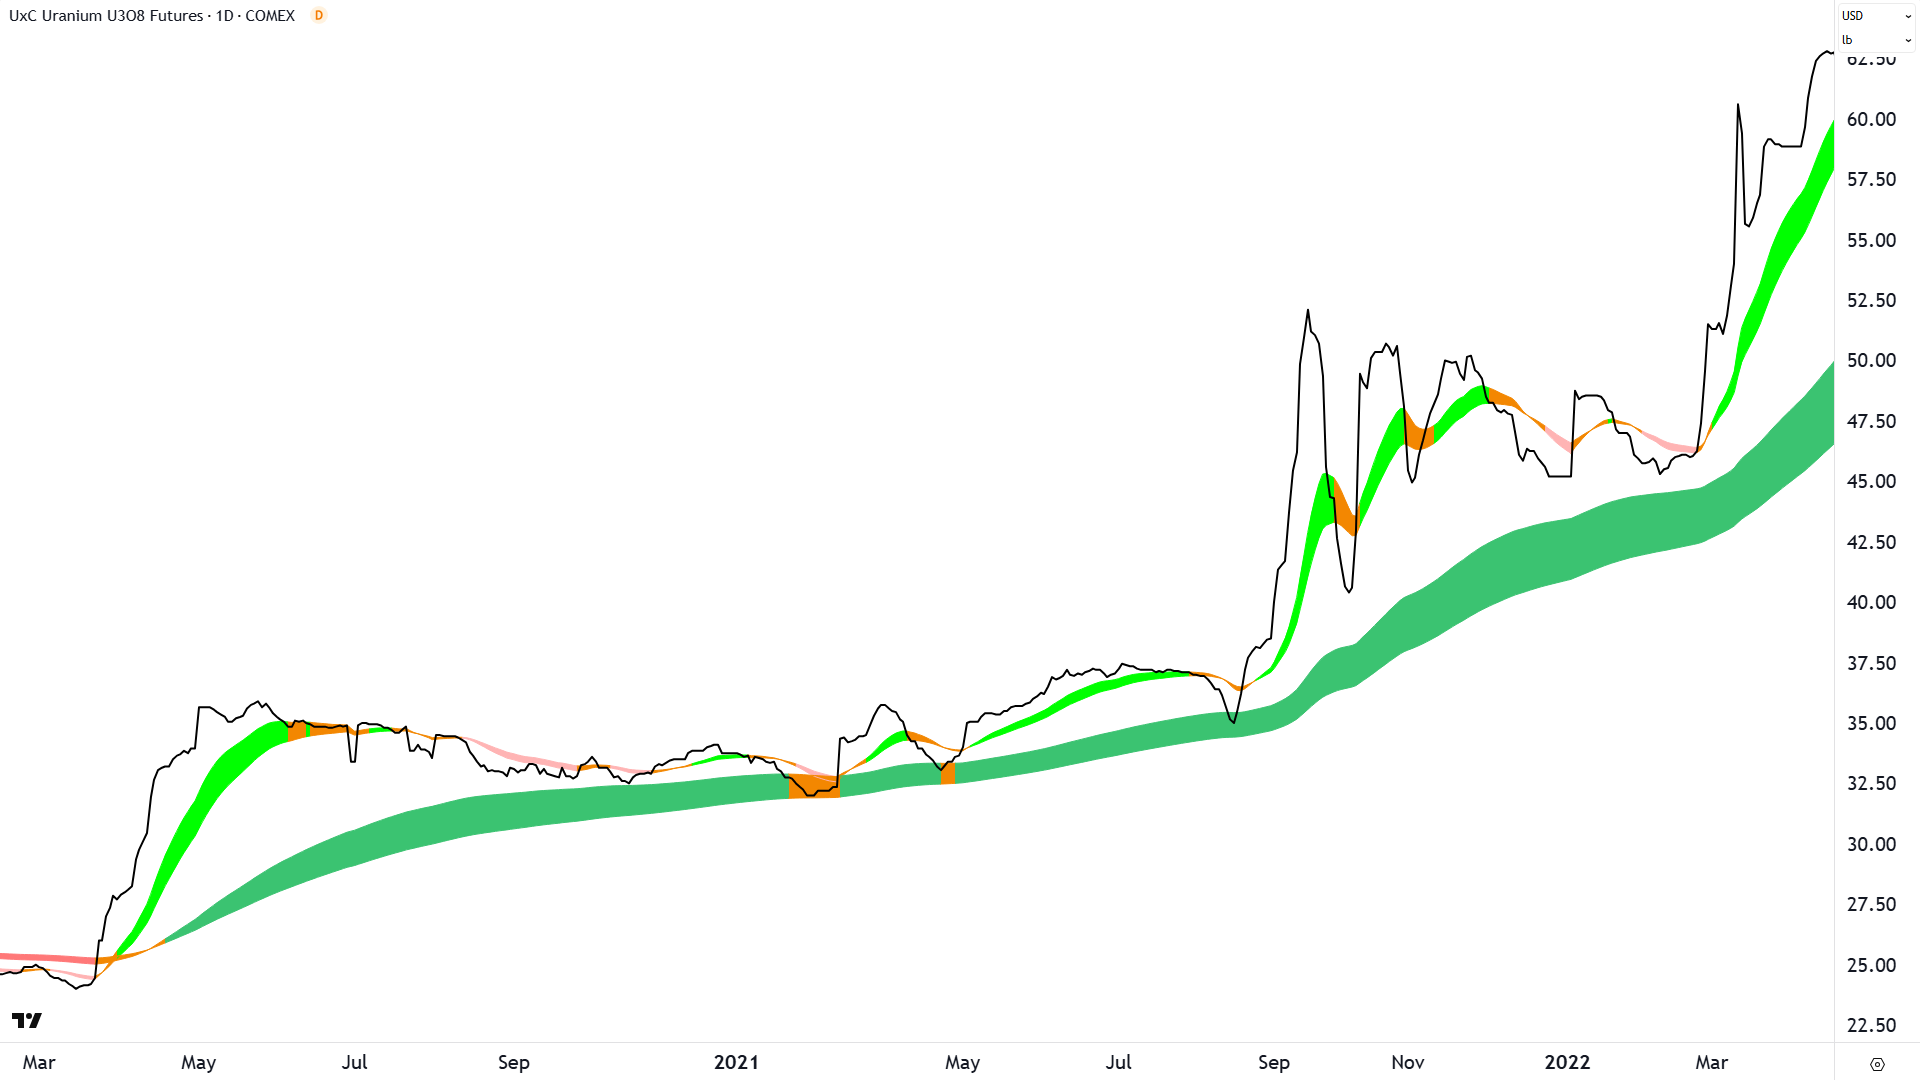
Let’s start with a longer term view of the uranium chart so I can explain my trend following model. Firstly note, a “long term uptrend” is a proxy for the more commonly used term for a rising market, a bull market, and conversely so for a “long term downtrend” and bear market.
A long term uptrend is said to have commenced when the long term trend ribbon is no longer in a downtrend (i.e., not dark pink – so, it can be either neutral/amber or up/dark green), the price has closed above the long term trend ribbon, has subsequently pulled back, and it has formed a trough above the long term trend ribbon.
The theory here is that a new uptrend has begun when the long term trend ribbon is at least neutral and the price action has confirmed it at least once as “dynamic excess demand zone”.
An “excess demand zone” is simply an area of price where the market will revert to a state of excess demand (excess demand is associated with a rising price). The “dynamic” aspect simply refers to the fact that my trend ribbons move with the price – hence the term dynamic excess demand zone.

By this definition, my model indicated a new bull market in uranium in early 2020 as the long term trend ribbon had transitioned to up (dark green), and the uranium price logged several troughs above the long term trend ribbon. A lengthy period of consolidation followed, where the long term trend ribbon acted perfectly as a dynamic excess demand zone. You can see three test-and-holds in March, April, and August 2021.
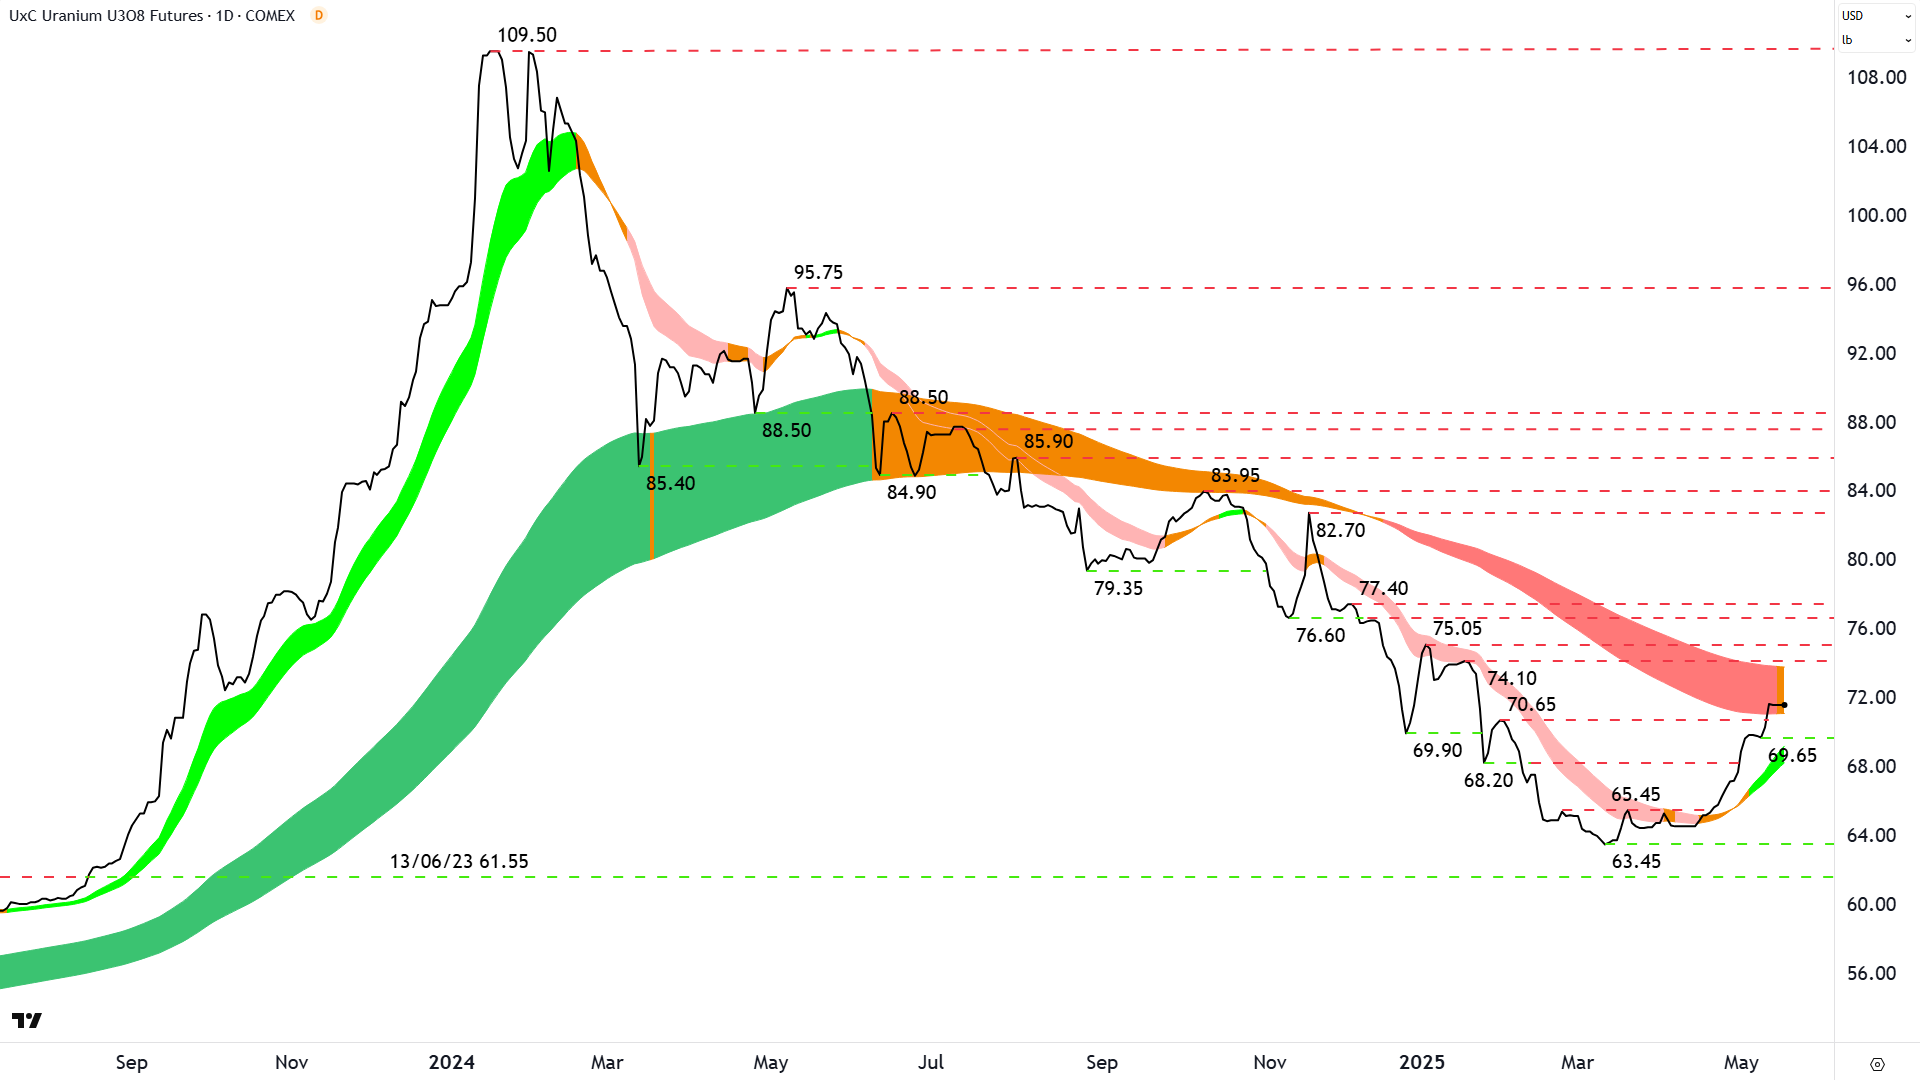
Let’s fast forward now to the present. Before we determine the current state of the uranium market, I’d like you to first focus on the period between the January 2024 peak at US$109.50/lb and the end of July 2024 at around US$85/lb.

The conditions for a long term downtrend (bear market) are simply the opposite of those for a long term uptrend. A long term downtrend is said to have commenced when the long term trend ribbon is no longer in an uptrend (so, it can be either neutral/amber or down/dark pink), the price has closed below the long term trend ribbon, has subsequently rallied, and has formed a peak below the long term trend ribbon.
Hopefully your eye is being drawn to the price action around July 2024 when the long term trend ribbon had neutralised and the price action of lower peak in the ribbon was signalling its transition from a dynamic excess demand zone to (increasingly) a dynamic excess supply zone.
An “excess supply zone” is simply an area of price where the market will revert to a state of excess supply (excess supply is associated with a falling price).
The nail in the coffin for that last uranium bull market was the peak at US$85.90/lb – set after the price had fallen below the long term trend ribbon. That peak represented the taking of control by the supply-side because it confirmed the long term trend ribbon had officially transitioned to a dynamic excess supply zone.
I actually used a little bit of discretion (and plenty of experience) to declare the then-bull market in uranium over, and that a new bear market had begun – before that US$85.90/lb peak in ChartWatch on 23-July 2024. Coincidentally, I also ran Paladin Energy (ASX: PDN) as a Feature Downtrend in my ChartWatch ASX Scans on that day – the first of over 20 Feature Downtrends the stock would endure between then and April 20 2025.
All the major ASX-listed uranium stocks were subsequently run as a Feature Downtrends – my highest conviction downtrend candidates – including Boss Energy (ASX: BOE), Deep Yellow (ASX: DYL), Bannerman Energy (ASX: BMN), and Silex Systems (ASX: SLX), among others. Falls were in the order of magnitude of 50% or more.
I had absolutely no fundamental reasons to make those calls, just trends, price action and candlesticks. It’s worth noting that the bull-case uranium narrative was just as strong when I began to call shorts in uranium and ASX uranium stocks – as it was in the run up to the January 2024 peak – and even as strong as it appears now. The narrative never changed, just demand and supply did.
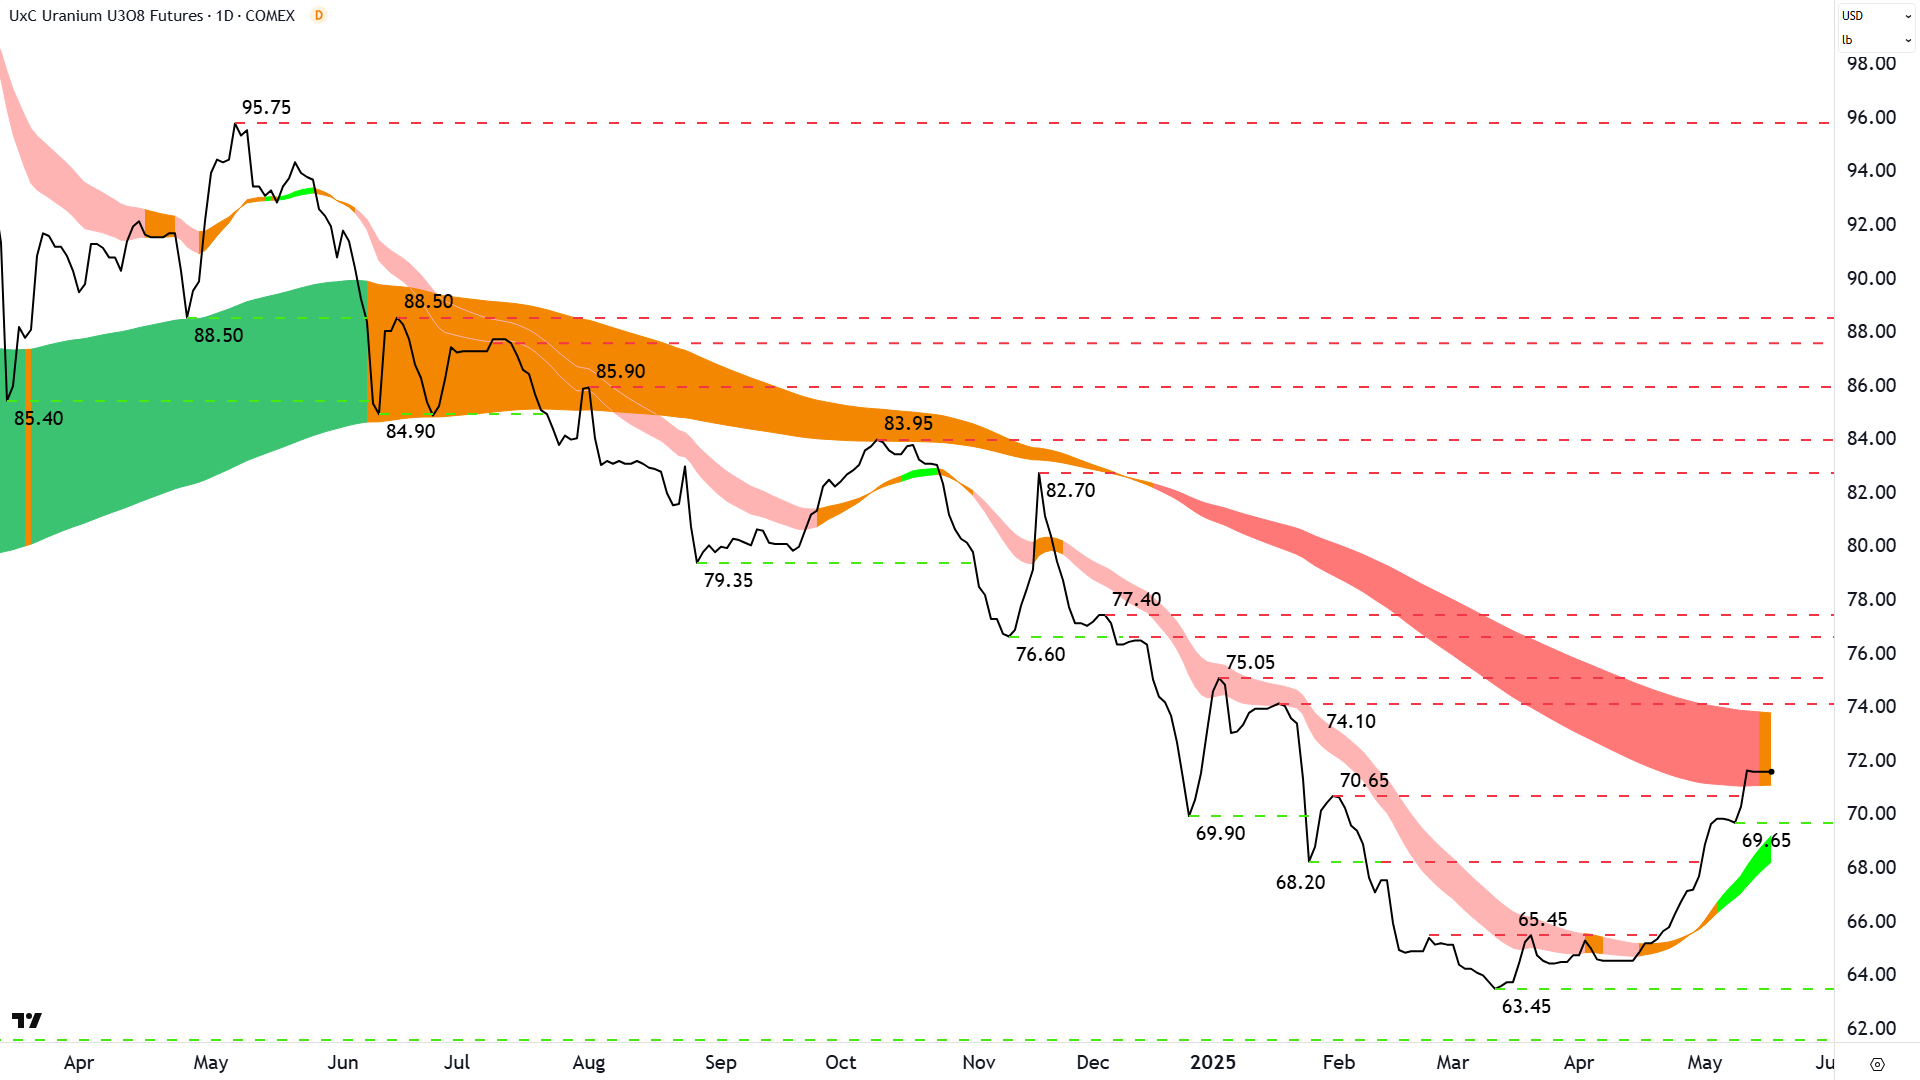
But there’s some good news for uranium bulls. My trend model is suggesting the balance between demand and supply is shifting again, this time back towards an environment of excess demand. As mentioned in the introduction, as early as mid-April, I had published ChartWatch updates noting the end of uranium’s short term downtrend, then the beginning of a new short term uptrend, and on Friday, the neutralisation of its long term trend. I also note that BOE and DYL have reappeared in my ChartWatch ASX Scans Feature Uptrends lists over the last two weeks.
%20COMEX%20%E2%80%93%20What's%20happening%20now.png)
You should now be an expert on determining when my trend model will declare the start of the next uranium bull market. The short term uptrend is a check, the neutralisation of the long term trend is a check, the recent price action of rising peaks and rising troughs is a check – all excellent indications of increasing demand versus supply.
Now, we must see the uranium price set a trough above the long term trend ribbon, therefore signalling it’s starting to act as a dynamic excess demand zone. If/when we see this signal, my model confirms the start of a new long term uptrend, and therefore the start of a new bull market in uranium.
How long will this take? The answer is: As long as it takes…I can’t tell the future! But based on experience, on order of magnitude at least a few days, but more likely a few weeks. Hey uranium bulls – you’ve waited this long – what’s a few more weeks!?
Uranium fundamental analysis factors
In a research report released on the weekend called "Uranium – keep calm and carry (trade) on", Canadian based broking firm Canaccord Genuity ("CG") has provided an assessment of the present uranium price environment and its outlook for global uranium stocks.
CG is a long time, and judging by their new report, continuing long term uranium bull. Here is a summary of their findings.
Uranium demand factors
-
New demand is still coming online (broker cites):
“Reactor life extensions, up rates, restarts, and new builds – particularly in China – are accelerating demand growth.”
Google has committed to funding three advanced reactor project sites, each capable of producing 600MW.
Reports indicating White House energy policy may soon tilt towards accelerating nuclear energy deployment.
Term contracting is insufficient to cover future needs: “Term contracting remains well below replacement rates and last cycle averages, a trend that cannot be sustained as demand grows.”
Trump’s trade war has had a negative impact on utilities demand: “Whilst demand for uranium is fundamentally inelastic, this volatility has caused utilities – which typically hold 2-3 years of inventory – to delay procurement decisions.”
Uranium supply factors
The supply side is struggling to grow: “Production has largely underdelivered, with ongoing operational, regulatory, and geopolitical challenges constraining near-term supply.”
Secondary sources of supply (i.e., from utilities stockpiles, recycling spent nuclear fuel, and decommissioning nuclear warheads) are “dwindling”, with inventories also at the “lower end” of utility targets.
Supply discipline from major producers like Canada’s Cameco (TSE: CCO) and deferred project pipelines (from BMN and DYL) reflect increasingly higher incentive prices for new production. The market will need to reflect the realities of marginal supply or face a greater deficit down the track, “Cost curves are pushing to the right and utilities will need to underwrite these costs.”
Uranium price forecasts
CG concedes recent price weakness was caused by “weak demand from buyers, forced sales (e.g., uncontracted producers), and tariff uncertainty”. Much of that weak demand was due to utilities consumers baulking at the 2023-24 price spike, and then playing a game of chicken with the falling spot price – seeing “how low it would go”.
The recent rebound, as noted in my technical analysis, can be attributed to increased liquidity resulting from both utilities companies and traders re-entering the spot market. CG believes both groups are trading the discrepancy between the lower spot price and the higher term price to some extent. This is known as the “carry trade”. (The term price is the price that long term demand-supply contracts between utilities companies and producers are written at).
CG estimates that as little as a US$9/lb discount between the term and spot prices makes the carry trade worthwhile for traders that hold long term contracts. These traders buy at spot and hold (i.e., “carry”) those pounds until scheduled delivery – enduring holding costs along the way but also earning a guaranteed arbitrage profit in the process.
Utilities companies, as always, remain the critical swing factor. CG suggests they too have underpinned the recent rally, “Utilities, in 2025, as a group have purchased over 75% of the overall spot volume that they procured during all of 2024,” the broker notes.
The improved demand-supply dynamics of the spot uranium market over the last few weeks, plus the fact the term price is largely unbudged from 15-year highs of around US$80/lb during the spot price pullback, leads CG to postulate that the next leg up in uranium prices is “on the horizon”.
“We believe the sector’s historical pattern of sharp price moves following periods of stability suggests that a breakout could be imminent. We await the catalyst that will spur utilities, yet we note that pressure is building,” the broker notes.
What’s in store for the uranium price and ASX uranium stocks?
Bottom left-top right demand growth and a stagnant supply side that cannot keep up. Add in tantalising uranium price forecasts and the promises of exploding in earnings among producers. You’ve got to love a bullish narrative! Uranium appears to have everything investors desire in the next big thing stakes.
But! The technicals demonstrate very clearly that whilst a commodity’s narrative may remain bullish for years – its price can swing wildly between bull and bear. Narratives are a fairy tale, a warm blanket to wrap true believers in each night before they go to bed – justifying them not taking profits during the bull market as well as their holding on to devastating losses during bears.
Price action, i.e., the interaction between demand and supply, however, is the undeniable truth. Both the demand and supply sides know way more about the commodity than any punter buying and holding based on a fairy tale narrative. For now, regardless of your poison – technicals or fundamentals – there does appear to be at least some justification for a more bullish view on the uranium price.
Canaccord Genuity have made it very clear their views on how this fledgling improvement will play out – they’re unequivocally bullish – and I’ll do a follow up to this article later in the week to check up on how CG and other brokers are presently viewing ASX-listed uranium stocks.
As for the technicals, I would love nothing more than to call the start of the next uranium bull market – just as I called the start and end of the last one. If you wish to read that call when it happens, then be sure to tune into ChartWatch in the Evening Wrap for my regular uranium technical analysis updates.
Want to know more about the price cycle in uranium and other commodities? This article is compulsory reading for all investors in commodities and commodities stocks: Riding the Commodity Price Cycle: The definitive investor guide.
This article first appeared on Market Index on 20 May, 2025.
Never miss an update
Enjoy this wire? Hit the ‘like’ button to let us know.
Stay up to date with my current content by
following me below and you’ll be notified every time I post a wire
Carl has over 30-years investing experience and has helped investors navigate several bull and bear markets over this time. He is a well respected markets commentator who specialises in how the global macro impacts Australian and US equities. Carl has a passion for technical analysis and has taught his unique brand of price-action trend following to thousands of Aussie investors.
........
Investing is risky. Inevitably you will endure losses. If you can't cope with losing, don't invest.

%20COMEX%20%E2%80%93%20What's%20happening%20now.png)
5 topics
15 stocks mentioned

Carl has over 30-years investing experience and has helped investors navigate several bull and bear markets over this time. He is a well respected markets commentator who specialises in how the global macro impacts Australian and US equities. Carl...
Carl has over 30-years investing experience and has helped investors navigate several bull and bear markets over this time. He is a well respected markets commentator who specialises in how the global macro impacts Australian and US equities. Carl...
Comments
Comments
Sign In or Join Free to comment
most popular
Equities
The Magnificent Seven can’t carry the market forever
Pzena Investment Management