TOL - 14th May, 2025
Riding the commodity price cycle: The definitive investor guide
The commodity price cycle is a relentless beast, inflating bubbles & bursting dreams. Learn how to grow and protect your capital throughout.
If you’ve felt the sting of a plunging lithium or uranium stock, you’re not alone. You’ve just been for a ride on the “commodity price cycle”. This is a term used to describe the rollercoaster of soaring highs and crushing lows that has left many novice investors nursing losses over the years, and wondering where they went wrong.
The cycle is driven by the tug-of-war between supply and demand, and it regularly shapes the markets for raw materials like metals, grains, and energy. Unlike the supply of shares and bonds which can be created with the click of a mouse button, commodities are usually scarce and require substantial natural resources and capital to produce. Similarly, demand for these commodities can surge and ebb as consumption trends change, and new, life-changing technologies emerge.
This makes commodity markets more prone to massive and sudden price spikes when demand surges, only to crash when supply floods in. There are other permutations, of course, for example when supply is suddenly restricted by a weather event, or a geopolitical issue such as the Russia-Ukraine war. Still, the theme of: Rise, fall, and then probably do it all over again possibly many years later, remains. That’s the cycle.
In this article, we’ll investigate the causes of the commodity price cycle and how investors can safely navigate it. As we’ll see, there are many tips and tricks investors need to know to avoid becoming its next victim!
What does a commodity price cycle look like?

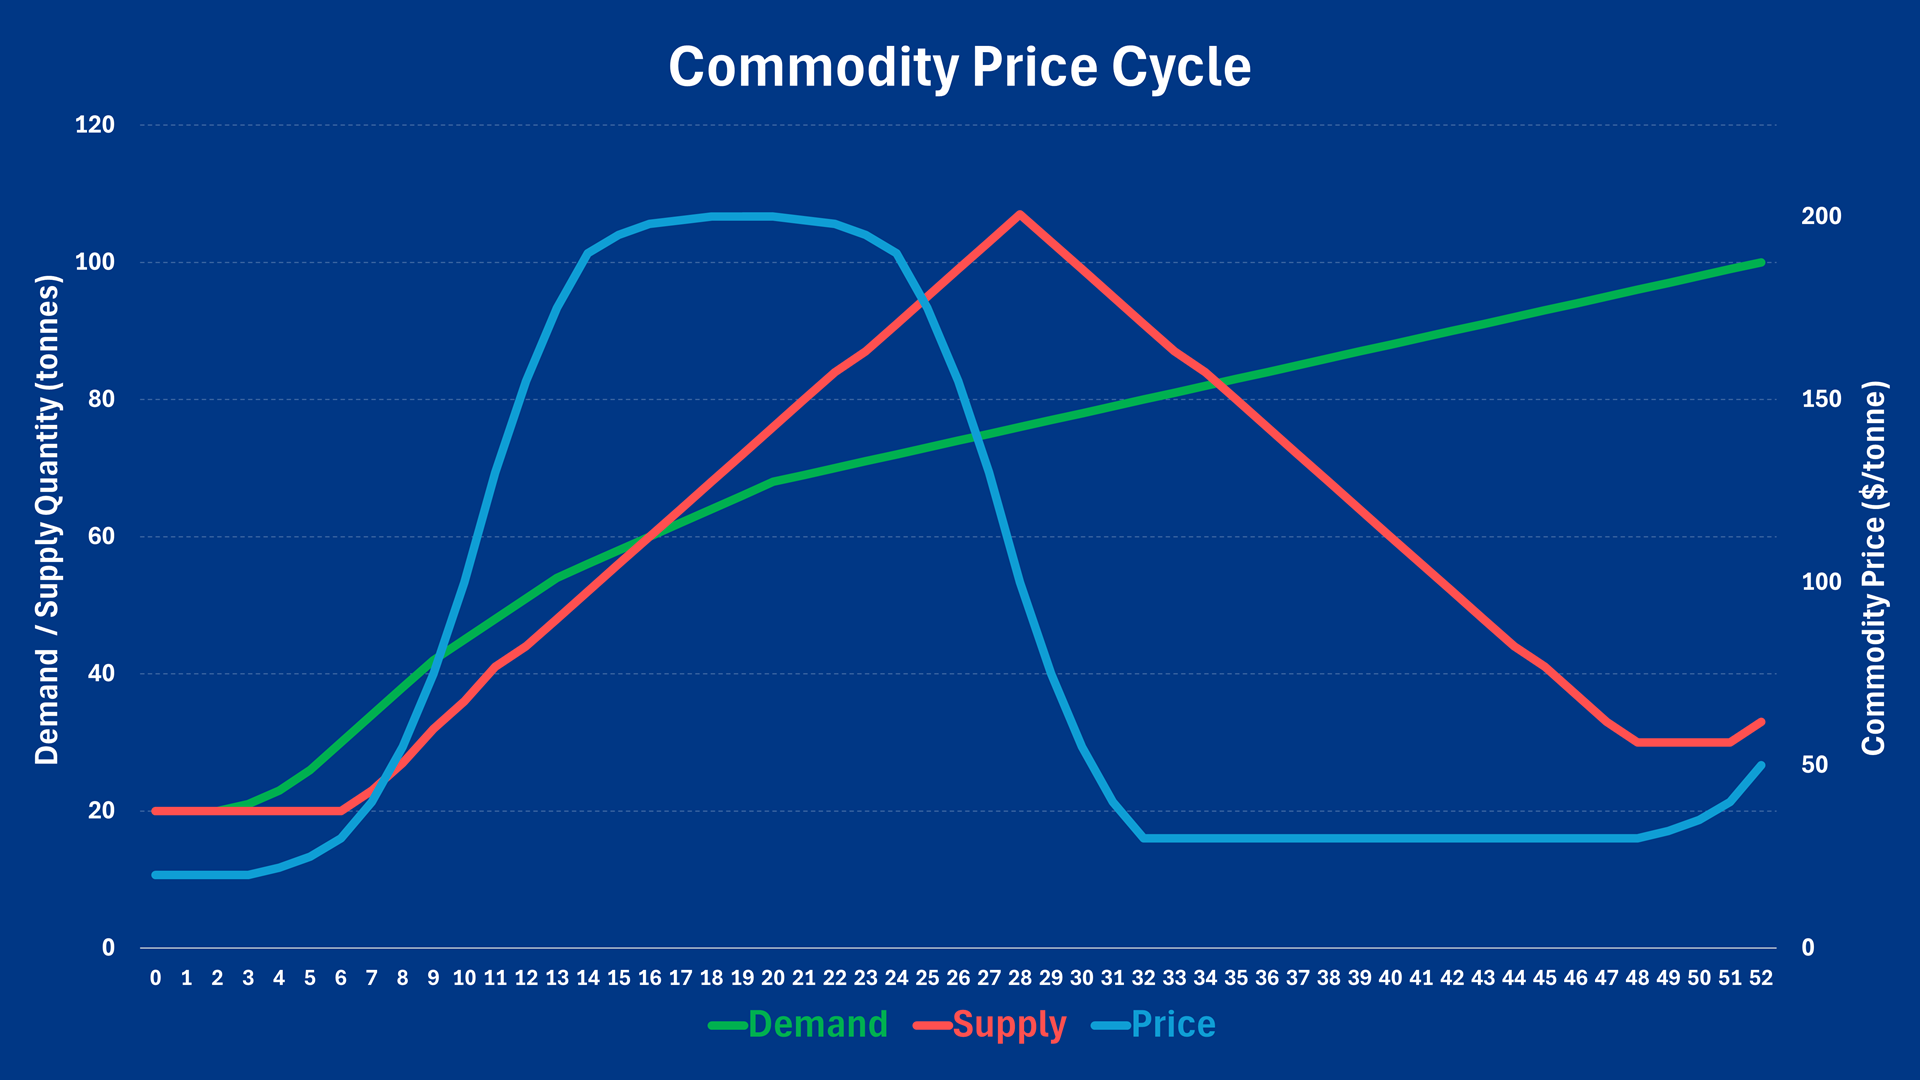
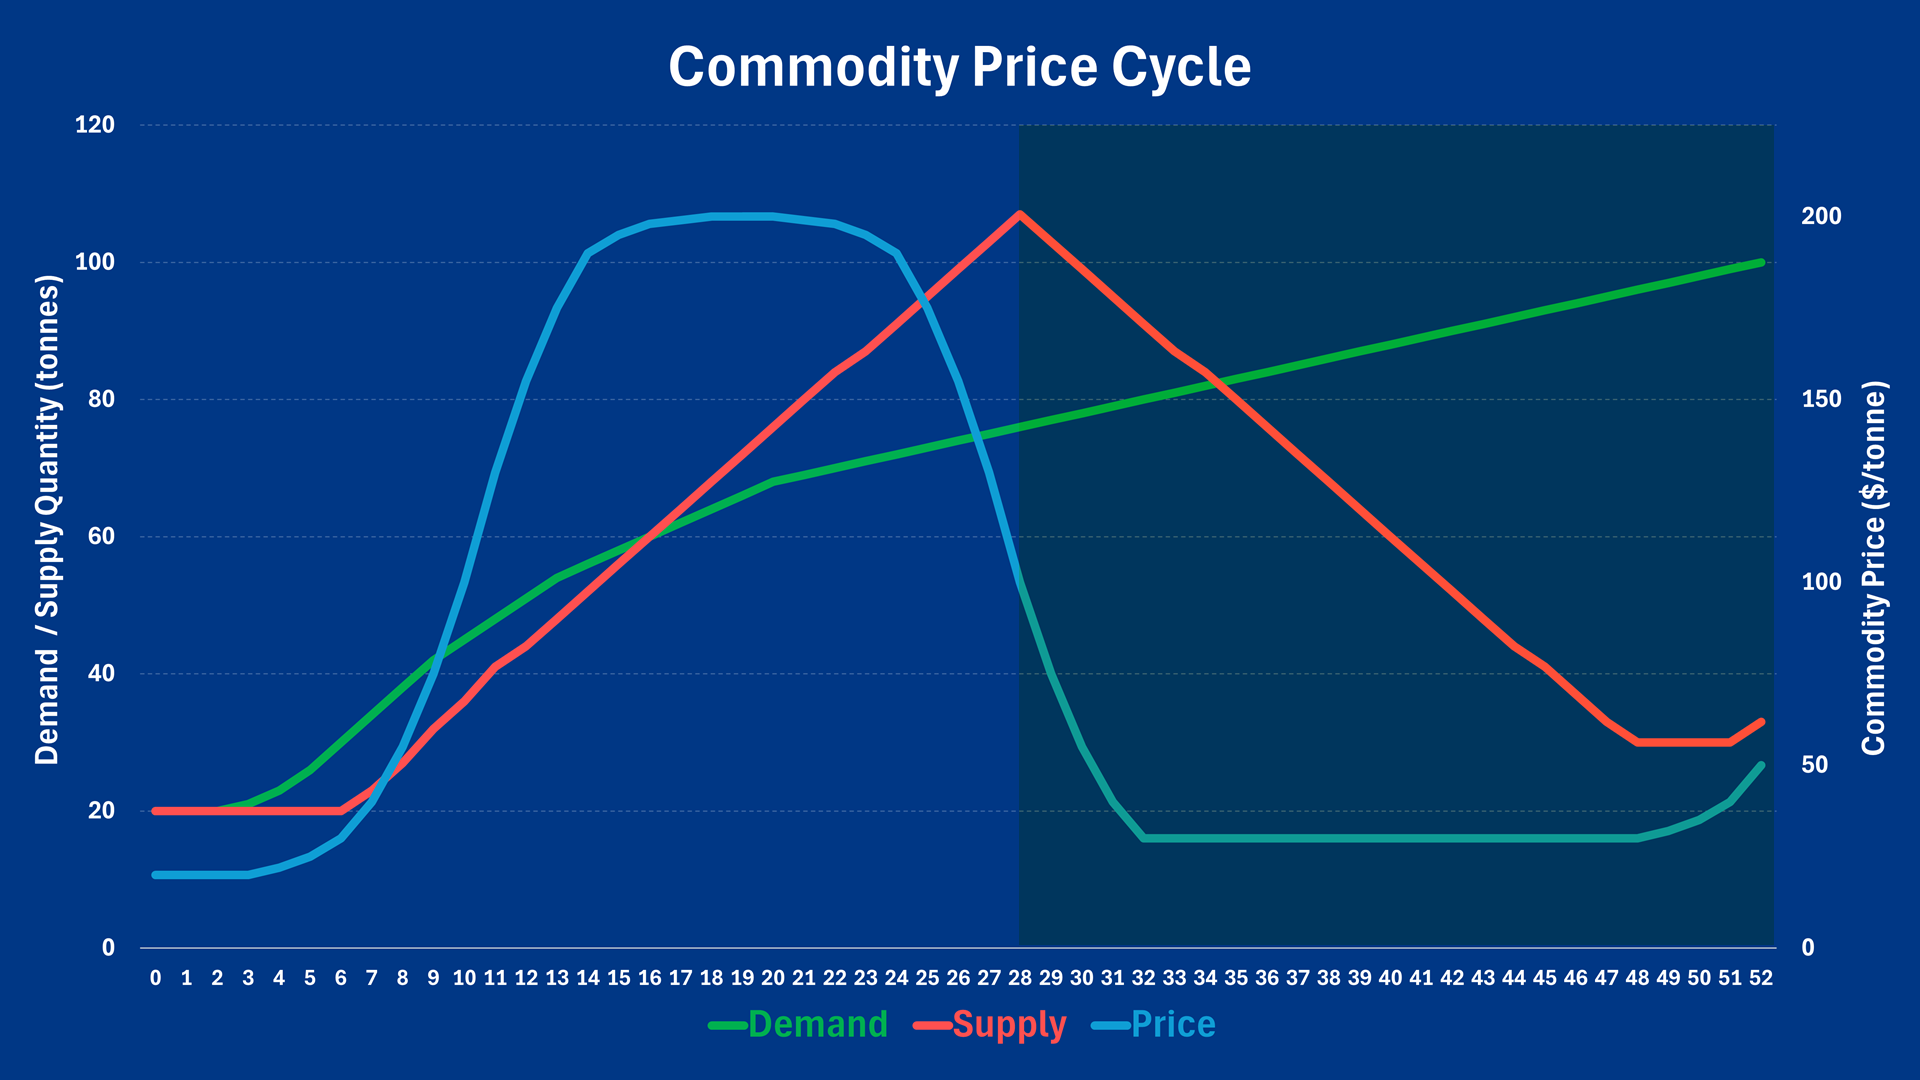
Above is a stylised chart of the commodity price cycle for a commodity we’ll refer to here as “Commodity X”. The left axis shows the amount of demand and supply of Commodity X in tonnes, with the green line representing its demand and the red line representing its supply. The blue line represents the price of Commodity X, which is measured on the right axis in dollars per tonne. The horizontal axis is time, let’s assume each segment represents one month.
Note that the commodity price cycle may take longer or short to play out, this is just a case study, but invariably, it can be divided into four distinct phases. Let’s investigate each phase separately.
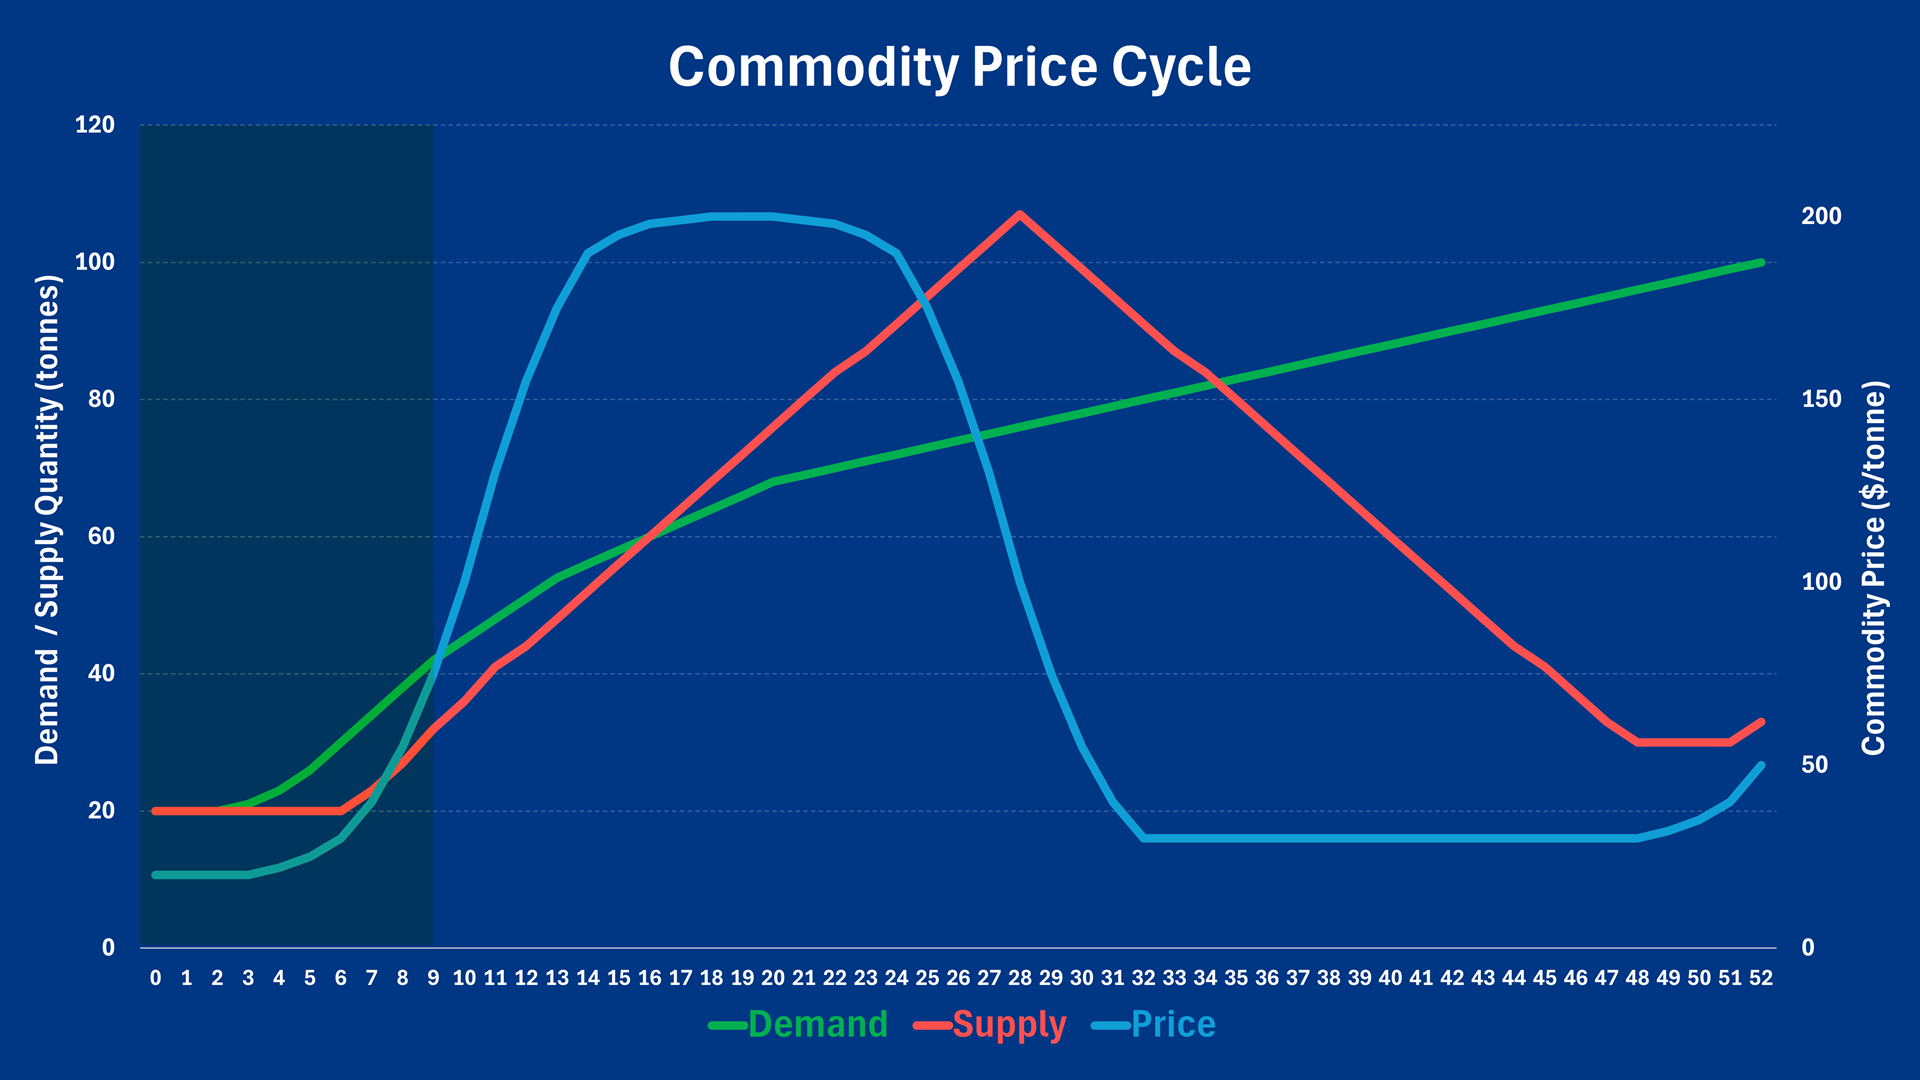
Phase 1: Equilibrium is disturbed by a spark of demand

Every commodity cycle starts mundanely, with supply and demand roughly balanced and the price steady. New investors often overlook these stable periods, but they’re a chance to research commodities with emerging potential.
The spark comes unexpectedly, often from a technological breakthrough or shifting consumer tastes. In our chart, that spark causes demand for Commodity X to break away from its supply, disturbing the prior equilibrium and sending the price of Commodity X higher in Month 3.
The moderate price rise may be missed by the supply side at first, but as demand steadily increases to now exceed supply, the growing shortage in the market for Commodity X forces its price higher at a suddenly increasing rate. It’s not long until the supply side wakes up to the newly improved profitability of producing Commodity X, and therefore begins to ramp up supply using all immediately available resources and capital.
Speculators have also noticed Commodity X's price increase, and are now enjoying trading its new upside volatility. Many other investors are awakening to a new narrative that “Consumer trend A” or “Technological breakthrough B” could exponentially increase the demand for Commodity X and send its price rocketing even further. Perhaps this is where you jump on board your favourite ASX-listed Commodity X stock!
As for real-life themes that have started a commodity price cycle, the most obvious in recent memory is the surge in EV battery demand over the last decade and the subsequent impact it had on the lithium price. Even more recently, many have also flagged a looming supply shortage in uranium as the world transitions to a zero carbon future. Certainly, this narrative looked sound when the uranium price more than doubled in 2023. (It has since pared back – but we’re not up to that phase yet!)
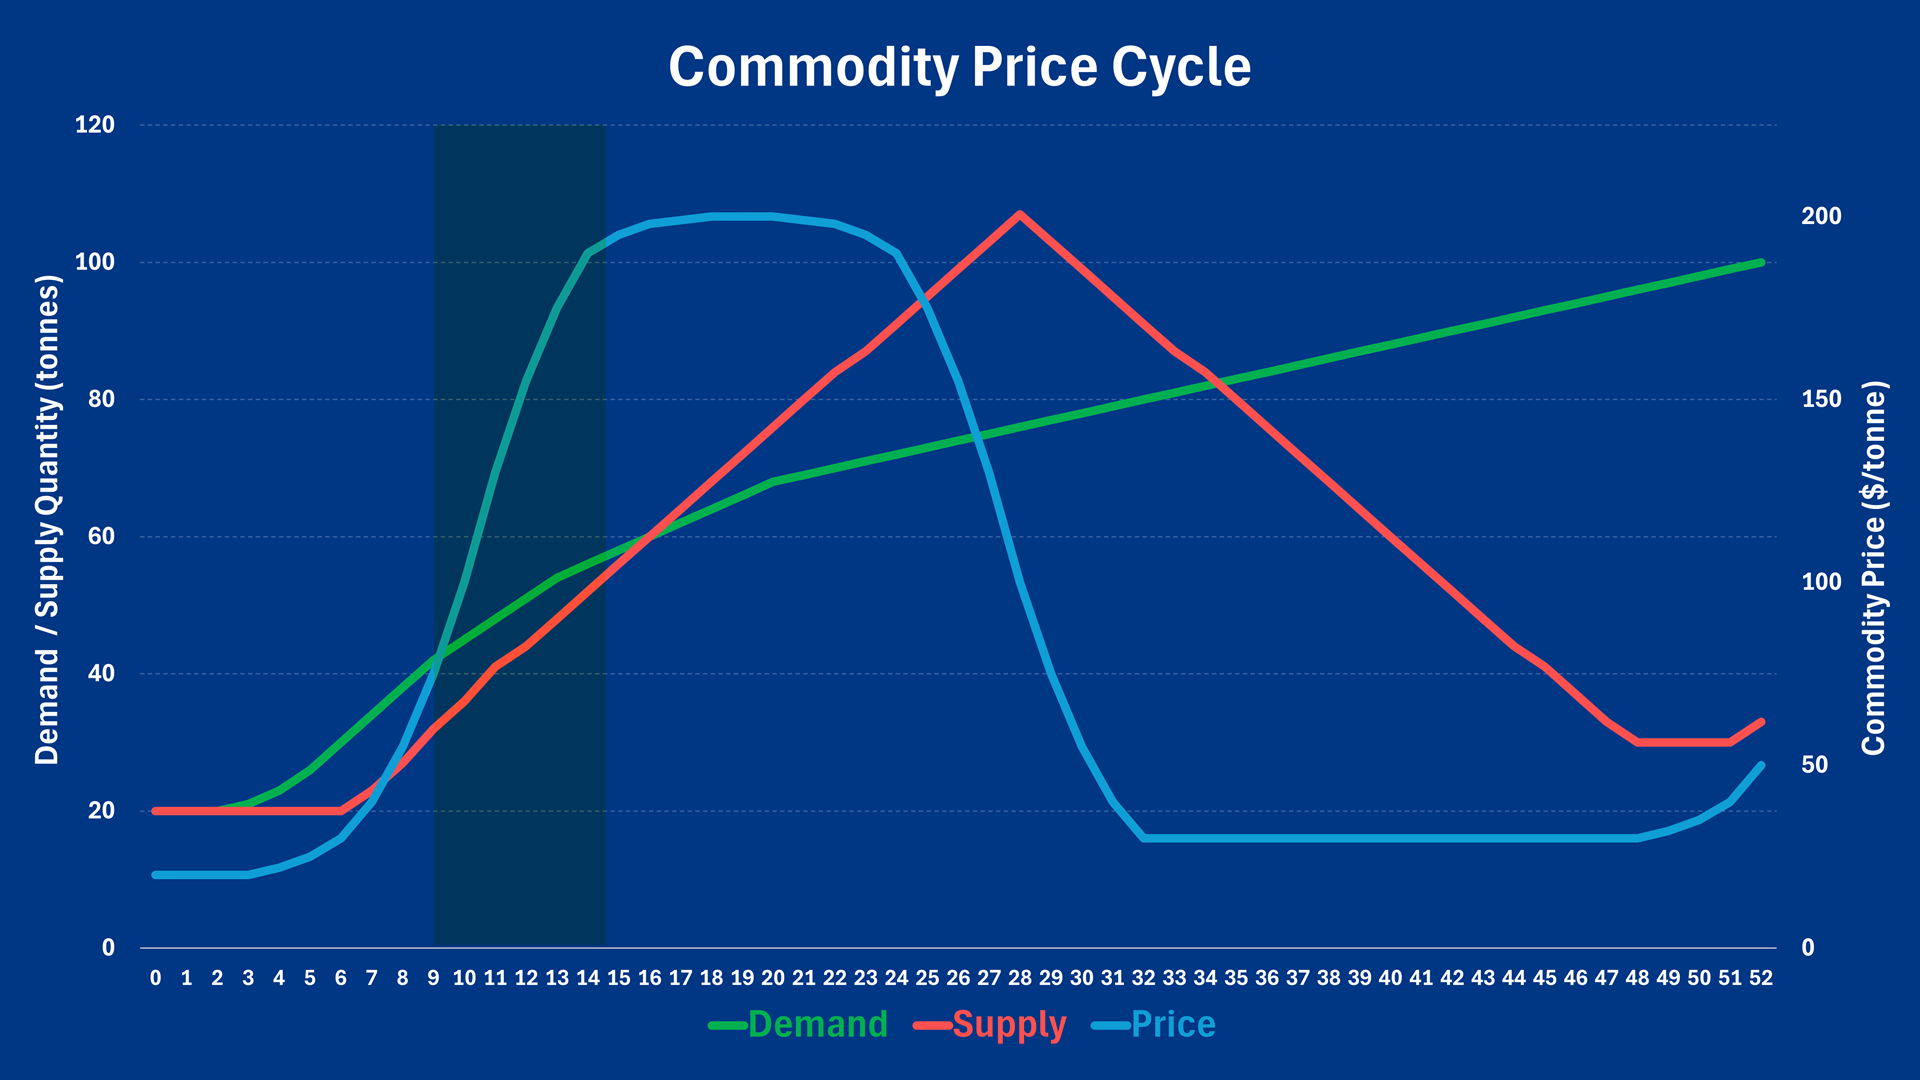
Phase 2: The price surge and market awakening

When demand suddenly and significantly outpaces supply for a commodity (and with narratives rampant of demand increasing bottom left-top right into the infinite future), prices explode. In our chart, by around Month 10, prices for Commodity X are rising at an exponential rate.
The supply side has been busy over the last few months in two ways:
- Extracting every last ounce of production from their existing operations; and
- Raising as much capital as possible to expand their production base so they can keep up with demand as well as take advantage of the lucrative price increase.
The good news for the supply side, is that there’s now no problem getting debt financing from banks only too eager to lend to this suddenly very profitable segment of the economy. It's even easier to get cash from stock investors by issuing more shares, or as is common in Phase 2 – bundling together recently dormant and once-worthless assets into an initial public offering (IPO). Investors, sold on the hype, are only too eager to hoover up this stock.
Soon, ASX-listed companies big and small are kicking over rocks in the desert out the back of nowhere searching for Commodity X. Now, a company’s stock price can double in a day on news of “rock chip samples” showing “visible mineralisation”. This just means that a geo tripped over one particular rock, decided to bash it with his pick, and saw something gleaming in the bit remaining in his hand (…triggers satellite call back to main office…investor relations clerk madly drafting the ASX announcement!).
It's all fuel on the fire for a stock market full of investors clamouring for exposure to this “next big thing” that’s about to make them disgustingly rich. Bottom left-top right demand forever, remember!? The rising demand and price environment for Commodity X emboldens suppliers, explorers, and developers, as well as greedy investors – but at some point, all this investment must lead to an increase in supply. On to Phase 3!
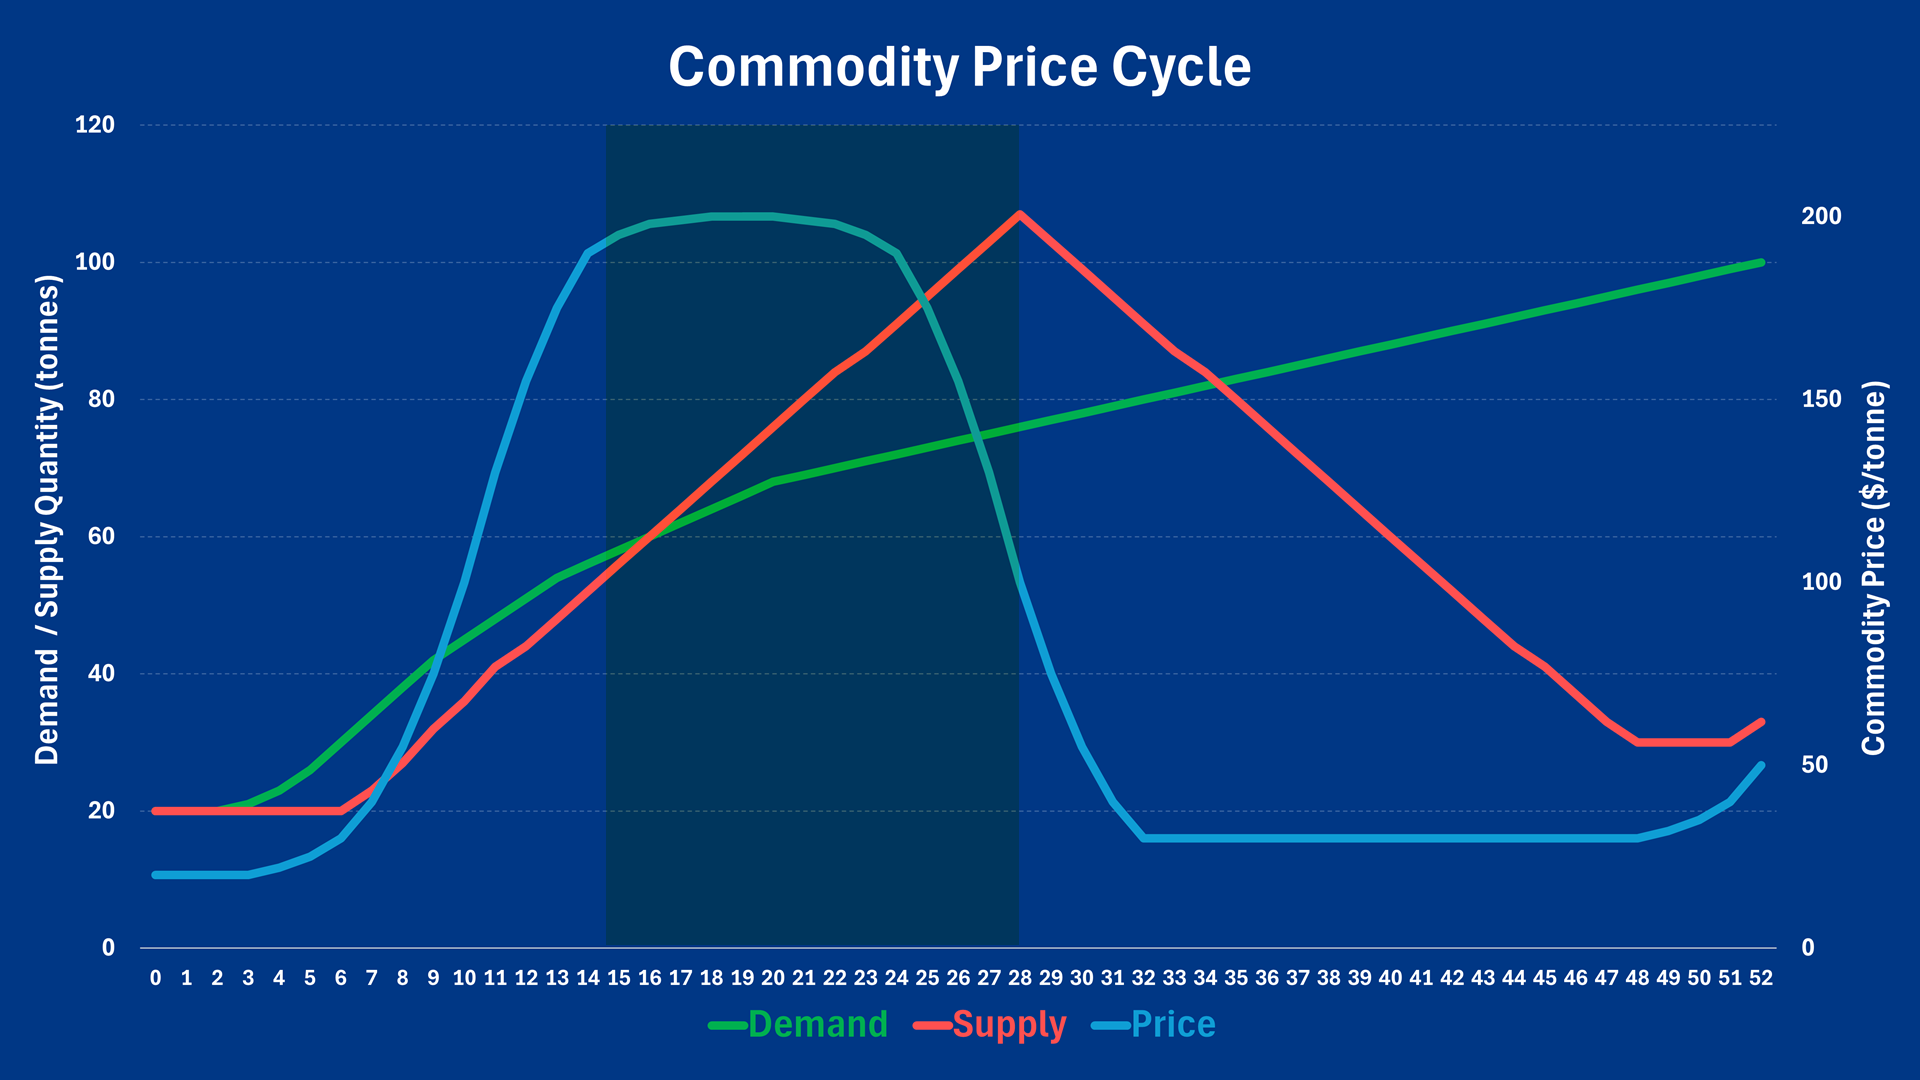
Phase 3: The peak, the crash, and sowing the seeds of the next cycle

Soon, all that investment facilitates greater supply of Commodity X, causing the red line in our commodity price cycle chart to rise. The price of Commodity X is still rising, because supply has not yet caught up to demand, and likewise, the prices of stocks exploring for and producing it are still very much in a growth phase.
Now is the time for Commodity X stocks to be rewarded for delivering production increases on time and on budget (a rare occurrence in this phase because the entire industry is fighting for the same scarce assets – pushing costs of production higher). For many companies, the best way to reduce production costs is to increase scale of production. More supply is the battle cry!
Investors are piling on the profits too, rewarded not only by the rising prices of the Commodity X stocks they own, but also by the pat on the back their profits give them for their incredible foresight. “See,” they tell themselves, “I was right about Commodity X, demand really is bottom left-top right. What a clever investor I am. This will surely go on forever!”.
In our chart, supply catches up to demand by Month 16. With demand and supply now equal, the price of Commodity X begins to level off. Hey – prices are still substantially higher than where they were at the start of this cycle, and by all reports, demand continues to rise in a bottom left-top right manner.
All is good with the world. Suppliers are happy, they’re raking it in, and some of them have even made the transition to dividend payers. These companies have reached the rarified air of being referred to as “Blue chips” now.
Even more enticing for investors is the fact that just about every broker has slapped a Buy rating on Commodity X stocks, as well as ratcheting their price targets ever-higher. This is because brokers can't afford to be caught behind the curve on this high growth area of the market, and far more importantly – clients are clamouring for buy recommendations in the sector. If that's what clients want, and if that's what makes clients transact (i.e., how the brokers get paid), then why wouldn't the brokers assist?
Investors are happy all the same, they're still raking it in, emboldened by bullish broking notes and now even more convinced of the validity of their investments. Yet, it seems few have noticed the red supply line keeps increasing. Why wouldn’t it? There are still fat profits to be made with prices of Commodity X so high, and remember those scale of production benefits? More supply please!
Yet, there's a small group of investors who have tempered their enthusiasm. They know better than to succumb to the hype (perhaps this isn't their first commodity price cycle). They’re reading the demand-supply dynamics, and more importantly, the impact this is having on the price of Commodity X – which is now flattening out. (This will be you next time!).
Meanwhile, consumers of Commodity X have been busy stockpiling it in warehouses for months to ensure they have enough of it around to produce the new widget that everyone wants to own. They never want to be caught out by not having enough of Commodity X on hand again. But as the supply of Commodity X keeps rolling into port, and with warehouses now full to the brim, they start to slow their rate of purchases.
Their desperation to purchase Commodity X at any price – borne out of fear of not having enough of it when supply was scarce – is gone. Consumers of Commodity X now realise they have all the time in the world to buy Commodity X.
The heat has come out of the demand-side’s desperation to purchase Commodity X. Warehouses are full, and the supply of Commodity X is still increasing. The Commodity X market is now in a state of “excess supply”, i.e., its supply exceeds its demand. Economics 101 tells us there’s a very good chance the price of Commodity X must fall – and it does – from about Month 24 in our example.
Smart investors have understood the economics of the market for Commodity X. They have anticipated the looming supply glut, and have dutifully begun to cut their exposure to Commodity X stocks. Fortunately for them, there’s still a cue around the block of mum and dad investors waiting to buy into the Commodity X narrative – more fodder for the pros!
The price of Commodity X and of Commodity X stocks fall slowly at first, but as the imbalance between the burgeoning supply of Commodity X overwhelms its demand (demand which is all the while still rising, mind you), the price of Commodity X takes a sharp turn down.
Prices keep plunging as rising production of Commodity X continues to build stockpiles. Commodity X stocks have also responded to the downturn, and are also paring back fast. “Don’t worry, it’s just a pullback” Commodity X investors tell themselves, “It will go back up soon, it always has”.
Phase 4: Losses, contraction, underinvestment, and the seeds of the next cycle

Unfortunately for Commodity X investors, this time is different. Prices of the commodity, and of stocks related to it, don’t bounce back – but instead, continue their vicious descent. There’s plenty of confusion among investors, stunned by mounting losses, and hardly reassured by company management which is still reaffirming the need for still-scheduled production increases while professing the “long term fundamentals remain intact”.
We’re at Month 28 now, where the price of Commodity X has exactly halved from its heady peak. Several late entrants to the market are now uneconomic and are forced to suspend their exploration and development plans. This lack of future supply is going to be important in later in this phase.
For those who have just started producing Commodity X, they must scale back loss-making production or put operations into care and maintenance. Among the incumbents, who are likely producing now at scales that make them relatively much lower cost producers, slender margins make it harder to secure funding for expansions as stock holders want deep discounts to compensate them for the risk, and banks are more sceptical about the economics. Either way, expansions are pointless in a market that’s already grossly oversupplied.
Supply begins to decline. But the price of Commodity X is still falling – now even more sharply than ever before! This is because it takes time for supply to contract back to equilibrium with demand – which is still rising through all this hullabaloo – as well as for Commodity X consumers to work through the massive stockpiles they’ve accumulated since the start of the cycle.
The supply and demand for Commodity X is back to equilibrium by Month 35, but it’s not until Month 42 that stockpiles have dwindled to a point where Commodity X is beginning to become scarce again. By this point, the low Commodity X price has knocked a substantial portion of supply out of the market. Developers have gone bankrupt servicing projects on care and maintenance, or have sold them off to raise capital to invest in exploring for the next Commodity X. Explorers, with less sunk capital, made that switch months ago!
Only the leanest producers remain in the system now, those that found a way to cut costs sufficiently to remain breakeven or slightly better. They’ve scrimped and saved, and their share prices are a mere fraction of what they were at their peak. But they’re still around – they know they just have to hang around long enough for the next commodity price cycle in Commodity X to begin.
Which it does, in Month 49. After all, the demand for Commodity X never wavered from its bottom left-top right ascent through this whole commodity price cycle. I guess those original narratives were right!
Conclusion: Learning from the boom and bust
As they say on the cooking shows, “Here’s one I prepared earlier”. The lithium price cycle of the last 10 years is perhaps the best example of the commodity price cycle we’re likely to see in a generation. If you invested through it, perhaps buying on the way up, and holding a little too long on the way down (still holding?), then you can probably draw very close parallels between Commodity X’s price cycle and lithium’s.
%20RMB-mt.png)
The commodity price cycle is a relentless beast, inflating bubbles and bursting dreams. It’s been happening since a tulip cost the same as a windmill in Holland back in the 1600s. So, if you’ve been tagged by a commodity price cycle - like lithium or uranium, or whatever – don’t despair. So have I, and so have most investors that spend enough time in the markets.
As always, it’s not about how much you made and then lost in the last commodity price cycle, it’s about how you behave in the next. These cycles – from tulips to lithium and beyond – teach us that those who learn the rhythms of the commodity price cycle can profit from it. For new investors, the commodity price cycle isn’t a trap, it’s a classroom. Study it, respect it, and ride the next rollercoaster with your eyes wide open 🎢.
Enjoy the article? What's your experience of the commodity price cycle? What lessons have you learned that might help other investors in their journey? Tell us in the comments below! 👇
This article first appeared on Market Index on Friday 9 May, 2025.
Never miss an update
Enjoy this wire? Hit the ‘like’ button to let us know.
Stay up to date with my current content by
following me below and you’ll be notified every time I post a wire
Carl has over 30-years investing experience and has helped investors navigate several bull and bear markets over this time. He is a well respected markets commentator who specialises in how the global macro impacts Australian and US equities. Carl has a passion for technical analysis and has taught his unique brand of price-action trend following to thousands of Aussie investors.
........
Investing is risky. Inevitably you will endure losses. If you can't cope with losing, don't invest.

%20RMB-mt.png)
5 topics
19 stocks mentioned

Carl has over 30-years investing experience and has helped investors navigate several bull and bear markets over this time. He is a well respected markets commentator who specialises in how the global macro impacts Australian and US equities. Carl...
Carl has over 30-years investing experience and has helped investors navigate several bull and bear markets over this time. He is a well respected markets commentator who specialises in how the global macro impacts Australian and US equities. Carl...
Comments
Comments
Sign In or Join Free to comment