Gold in corrective pattern as markets look to US election
The gold price fell by more than 3.50% in US dollar (USD) terms during September, undergoing an overdue correction after the explosive gains seen earlier in the year. While prices have bounced in early October, a period of volatility leading into the US Presidential Election should not be unexpected. Long term, the outlook remains supported by a range of macro-economic and monetary factors that are driving investors toward precious metals.
Summary
· The gold price fell by more than 3.50% in USD terms during September, finishing the month at USD 1,886.90oz.
· In AUD terms the gold price was basically flat, finishing the month trading at 2,654.62oz.
· Rising real yields and an increase in the USD index helped drive the correction in precious metals.
· ETF inflows continued, but at a slower pace, whilst managed money investors reduced their long exposure in the second half of last month.
Full Review
The gold market continued its correction from the all-time highs seen in early August, when the precious metal traded at more than USD 2,050oz, to drop by more than 3% during September.
While the market momentarily recovered in early October, with the gold price trading back above USD 1,930oz earlier this week, it has so far proved unable to hold these levels, with multiple factors contributing to the correction we’ve seen in the past two months.
These include:
- Rising USD
The USD index increased by more than 2.50% at one stage during September, though it gave up some of this gain to close last month up by 1.9%. This contributed to the pullback in gold, which often struggles in environments where the greenback is rallying.
-
Rising real yields
Whilst bond yields remain negative in real terms across most of the developed world, they did manage to rise during September. The table below highlights the real yields on US Treasuries of various maturities from five years to 30 years as at 31 August and 30 September 2020, as well as the movement across the month.
Table: Real yields on US Treasuries
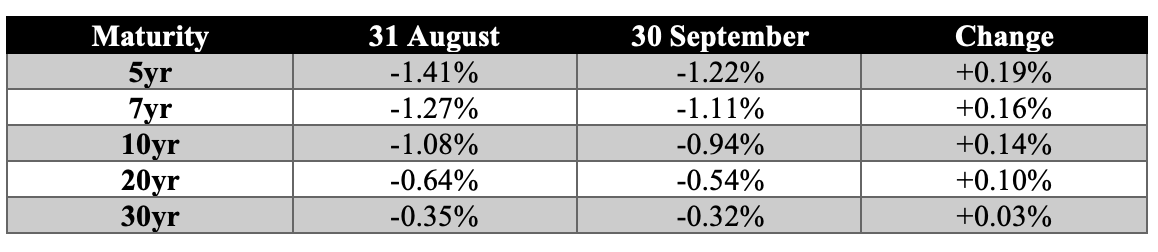
Source: US Department of the Treasury
Long-term, negative real yields on sovereign debt are likely to remain one of the key factors driving increased strategic asset allocations to gold. Short-term, any increases in real yields can act as a headwind, particularly when that increase is driven by declining inflation expectations, which is what transpired during September.
-
Loss of momentum
Another factor contributing to the pullback in precious metals was a simple loss of momentum, with gold, and silver to an even stronger degree, unable to maintain the blistering pace of price gains seen this year.
It was inevitable that this would happen eventually, as no market rises in a straight line. Indeed, it is a healthy part of any bull market to go through corrective periods, with what we believe was an overdue correction in gold explored in more detail below.
Gold correction was overdue
For some time now, we have been warning of the potential for a correction in the gold price. Over the past two years, the market rallied very strongly, with gold increasing from under USD 1,200oz in September 2018 to more than USD 2,050oz in August 2020, an increase of almost 75%.
By August 2020, the gold price was trading 26% above its 200-day moving average (200DMA), which was a warning sign that some short-term froth was evident in the market.
The chart below helps highlights this. It displays the USD spot price of gold from December 1999 to the end of September 2020. It also shows how far the gold price was trading above or below its 200DMA on any given day over this period.
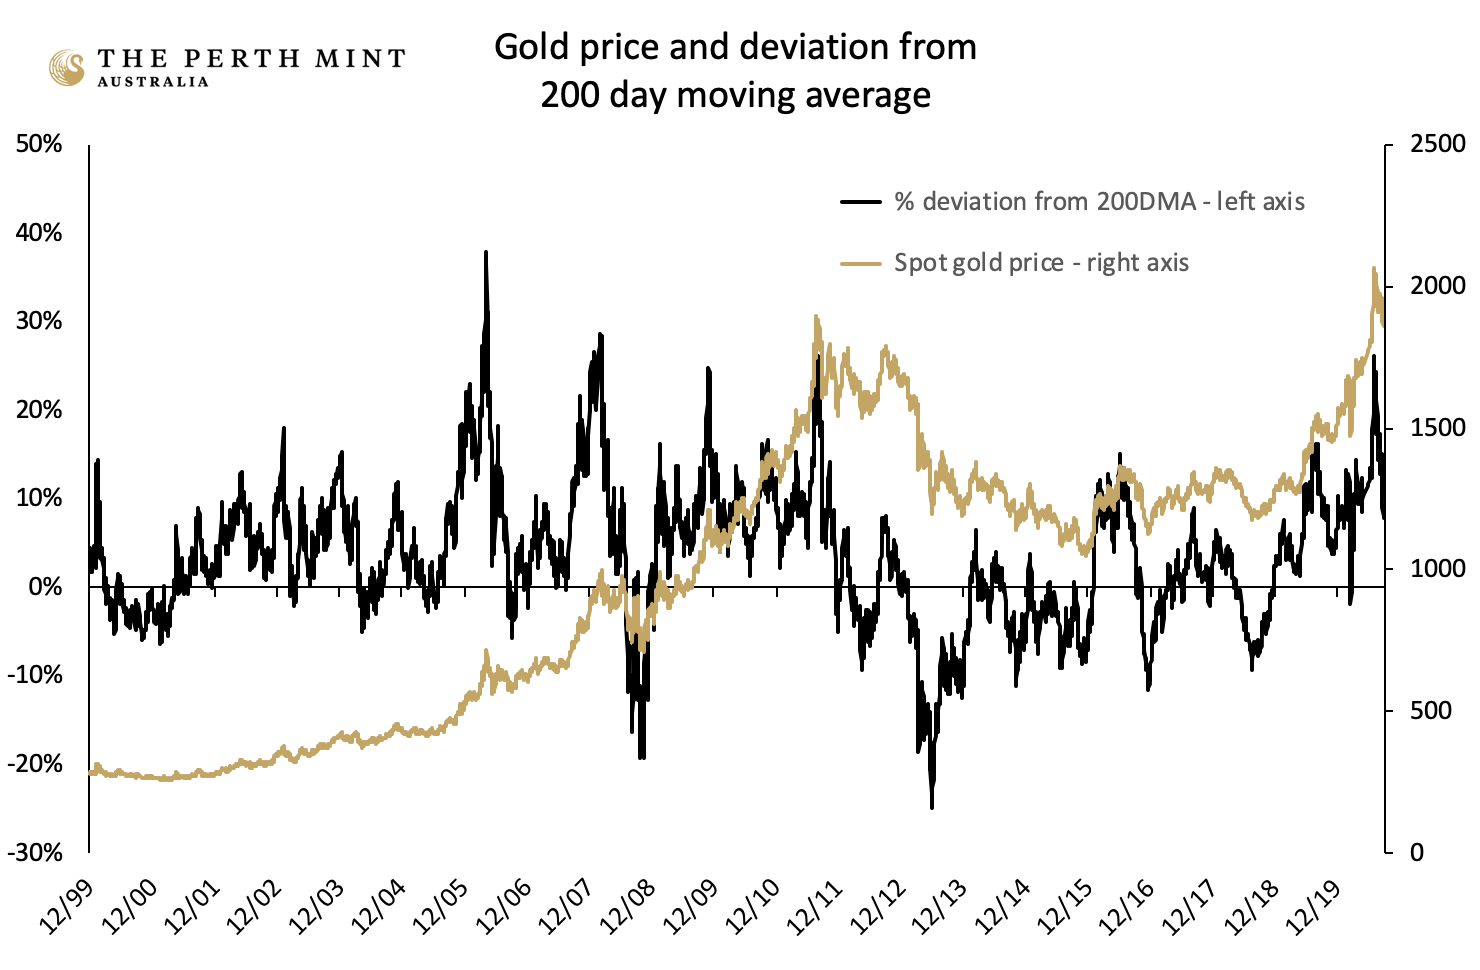
Source: The Perth Mint, Reuters
The chart highlights that there have been several occasions across the past 20 years where the gold price traded at 20% or more above its 200DMA. These have typically been short lived, with the market generally giving back some of these gains in a period of consolidation.
The table below highlights this clearly, showing the previous periods where gold was trading at more than 20% above its 200DMA, the gold price at the time, and the three-month and three-year returns that followed.
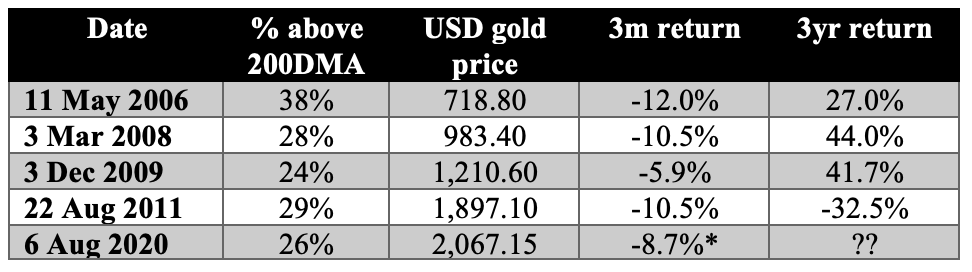
Source: The Perth Mint, Reuters
*This figure represents the gold correction from 6 August 2020 to 30 September 2020. The three-month return will not be known until 6 November 2020.
The table makes it clear that on every prior occasion that gold was trading at more than 20% above its 200DMA, the price fell in the following three months resulting in an average pullback of almost 10%.
Those corrections typically proved to be good times for investors to add to their precious metal holdings. As the table demonstrates, the gold price typically increased in the three years following on from these strong rallies.
The only exception was what happened after 2011, with gold priced in USD falling into a bear market that carried on until the end of 2015.
Environment for gold more supportive today
While there are no guarantees, the table below, which predominantly highlights data from the US, makes it clear that the economic, monetary and financial market environment investors faced at the end of 2011 is vastly different to the one they are facing today.
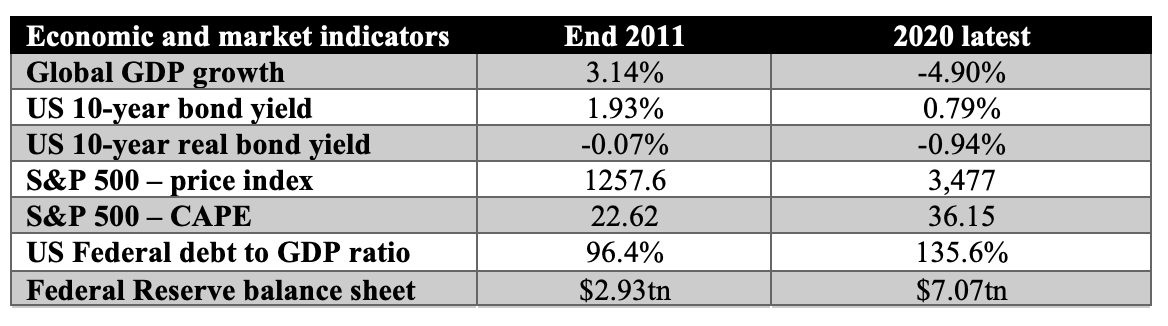
.Source: The Perth Mint, OECD, IMF, Shiller, St Louis Federal Reserve
Global growth is far lower, whilst government debt levels and central bank balance sheets are far larger, both in nominal terms and as a percentage of GDP. Despite this, the yield one can earn for lending to governments is lower, both in nominal and real terms.
Equity markets are also substantially higher, with the increase largely driven by multiple expansion, with investors today forced to pay some 60% more for a given dollar of company earnings relative to what they were paying in 2011.
Given the above factors, we think it is reasonable to state that the environment we are in today is more supportive for gold than that which we saw back in 2011.
Accordingly, there is a reasonable chance that the pullback we have seen in gold over the past two months is similar to those we saw in 2006, 2008 and 2009.
Jordan Eliseo
Manager, Listed Products and Investment Research
The Perth Mint
15 October 2020
Disclaimer:
Past performance does not guarantee future results.
The information in this article and the links provided are for general information only and should not be taken as constituting professional advice from The Perth Mint. The Perth Mint is not a financial adviser. You should consider seeking independent financial advice to check how the information in this article relates to your unique circumstances. All data, including prices, quotes, valuations and statistics included have been obtained from sources The Perth Mint deems to be reliable, but we do not guarantee their accuracy or completeness. The Perth Mint is not liable for any loss caused, whether due to negligence or otherwise, arising from the use of, or reliance on, the information provided directly or indirectly, by use of this article.
Never miss an update
Enjoy this wire? Hit the ‘like’ button to let us know.
Stay up to date with my current content by
following me below and you’ll be notified every time I post a wire
Gold and precious metal bull since early 2000. Have spent +25yrs working in investment analytics, research & portfolio construction, with a primary focus on the role of precious metals in investor portfolios. Author of two books on investing in gold and the causes of the GFC. Lover of markets, competition & technology
.jpg)
2 topics
.jpg)
Gold and precious metal bull since early 2000. Have spent +25yrs working in investment analytics, research & portfolio construction, with a primary focus on the role of precious metals in investor portfolios. Author of two books on investing in...
Expertise
Gold and precious metal bull since early 2000. Have spent +25yrs working in investment analytics, research & portfolio construction, with a primary focus on the role of precious metals in investor portfolios. Author of two books on investing in...
Expertise
Comments
Comments
Sign In or Join Free to comment
most popular
Investment Theme
If 24 LICs ran the Melbourne Cup, which ones would we back?
Affluence Funds Management