Gold: The most effective hedge against equity weakness
Despite the sharp correction in precious metal prices last Friday, it has been a strong start to 2020 for gold, with the yellow metal rising by 12.99% in AUD terms, and 4.54% in USD terms in the first two months of the year.
The increase in the gold price has been matched by an uptick in investment demand, best seen through the growth of global gold ETF holdings, which according to a Bloomberg article titled Gold -Backed ETFs have never seen a run of inflows like this, saw net inflows for a record 25 days running through to late February 2020.
Holdings for global gold ETFs are now at all-time highs, with demand in Australia particularly strong. We have seen this first hand, with our ASX listed Perth Mint Gold product (ASX: PMGOLD), seeing holdings increase by 13% since the end of last year, continuing a strong period of growth which saw holdings rise by 45% in 2019. The total value of precious metal holdings stored by The Perth Mint depository recently topped AUD 5 billion, testament to the growing appetite for gold investment from Australian and international investors.
There has also been a surge in enquiries, with many investors looking for information on how gold has typically performed during periods of equity market weakness. With fears over Coronavirus and a deteriorating global economy continuing to build, there appears to be growing concern that the more than 10% fall on the ASX in late February may usher in a period of higher volatility, and lower returns for equity market investors.
If that were to happen, then despite the occasional pullback like the one witnessed at the end of last week, history would suggest that gold is likely to perform well, with the yellow metal having a track record of strong performance whenever equities have fallen hardest.
This is best seen in the chart below, which plots the returns for gold and for equities in the worst five calendar years for Australian equity markets between 1971 and 2019.
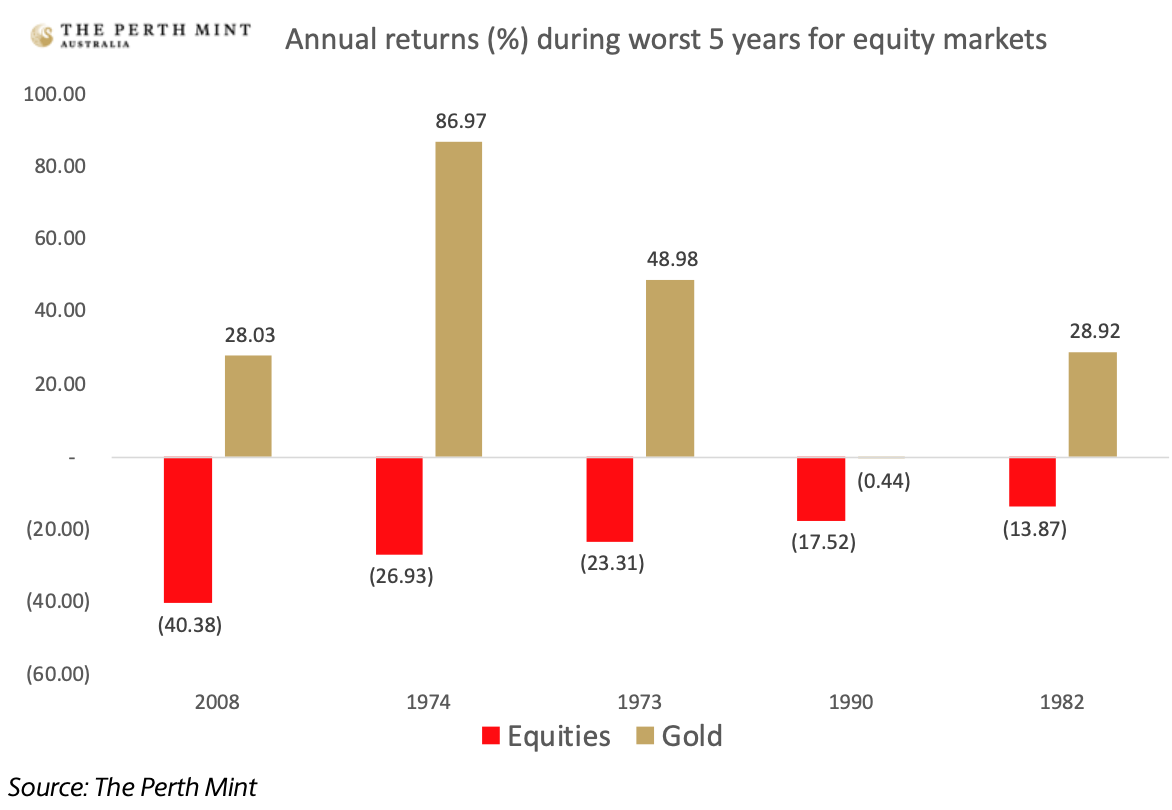
The chart above shows that with the exception of 1990, when it was basically flat, gold delivered strong gains in the years when equity markets suffered their largest falls. The figures amount to a performance differential of almost 65%, with gold delivering an average increase of almost 40%, whilst the share market saw average falls of almost 25%.
Not only did gold perform well in absolute terms in these environments, but in relative terms as well, with a study from The Perth Mint based on data from 1971 to the end of 2019 highlighting the fact that the yellow metal delivered higher average gains than bonds and cash during periods of heightened equity market weakness.
Gold’s diversification qualities, and the way that it can help protect a portfolio during periods of equity market volatility are relevant at all times, but particularly today, given the ongoing risks in equity markets.
What are the risks?
The economic and geopolitical risk factors facing equity markets in 2020 and beyond are well established. Debt to GDP levels are higher than when the Global Financial Crisis (GFC) hit ten years ago, whilst interest rates are much lower, leaving less room for central banks to deploy conventional monetary policy tools to assist in the next downturn.
Beyond those factors are the warning signs in the equity market itself, including:
· Markets are near all-time highs, having gone through one of the longest bull runs on record.
Despite the recent volatility, equity markets like the S&P 500 are trading near their all-time highs, with a decade long bull market that some analysts are claiming is the longest on record.
Locally, the ASX pushed through the 7,000-point barrier in January, whilst the accumulation index had increased by approximately 85% from its 2007 high, and 245% from its GFC low, prior to the pullback in February.
· Price to earnings ratio near record highs
A second warning sign for equity markets can be seen when looking at the S&P 500 cyclically adjusted price to earnings ratio (CAPE), with investors currently paying just over 34 times earnings to be owners of stock. This is a substantial increase, as during the worst of the GFC, the CAPE ratio dropped to just 15.
This can be seen in the chart below, which plots the CAPE ratio from 1900 onward. As the chart makes clear, the current CAPE reading has only been exceeded twice in the last 120 years.
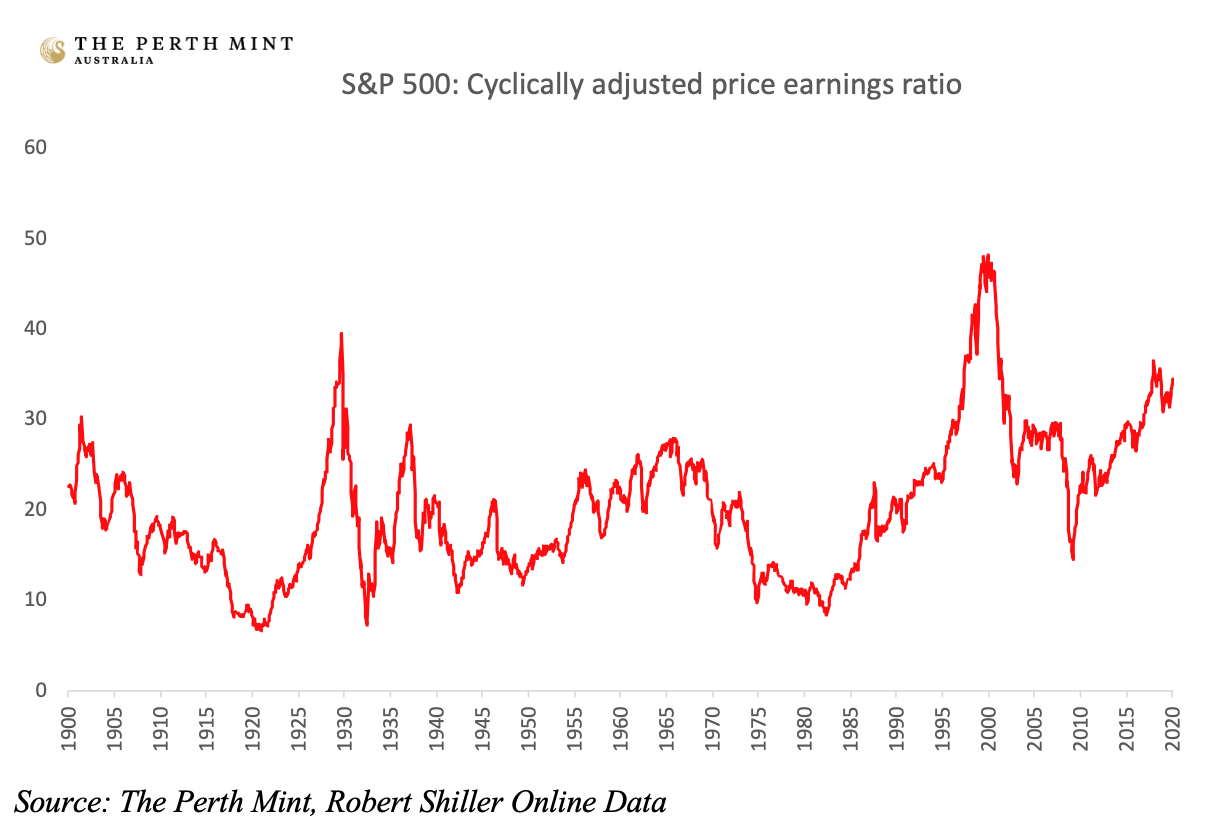
The first of those was back in 1929 when CAPE hit 39, whilst in 1999 the ratio hit 48. Suffice to say that investors who bought into US equities at those levels were not well rewarded in the decade that followed. Will this time be different?
As a brief aside, whilst it might be accurate to say there is little consumer price inflation in the world today, the rise in CAPE (seen in the above chart) highlights substantial asset price inflation in the ‘post’ GFC environment. The price investors have to pay to be an owner of stock, as measured by CAPE, has increased by more than 11.5% per annum over the last 11 years.
· Price to sales ratio at all-time highs
A further warning sign for equities is the price to sales ratio for the S&P 500, which is calculated by dividing the share price of a company (or the market as a whole) by the dollar value of the sales a company generates.
As an example, if a fast food company was trading at $100 per share, and they generated $100 of hamburger sales in a year, then the price to sales ratio would be 1:1.
The chart below plots the price to sales ratio for the S&P 500 as a whole, rather than an individual company, over the last twenty years. The ratio recently hit an all-time high of 2.32 in December 2019, though it declined with the equity market pullback in February. During the GFC, as the chart highlights, the ratio dropped to just 0.8.
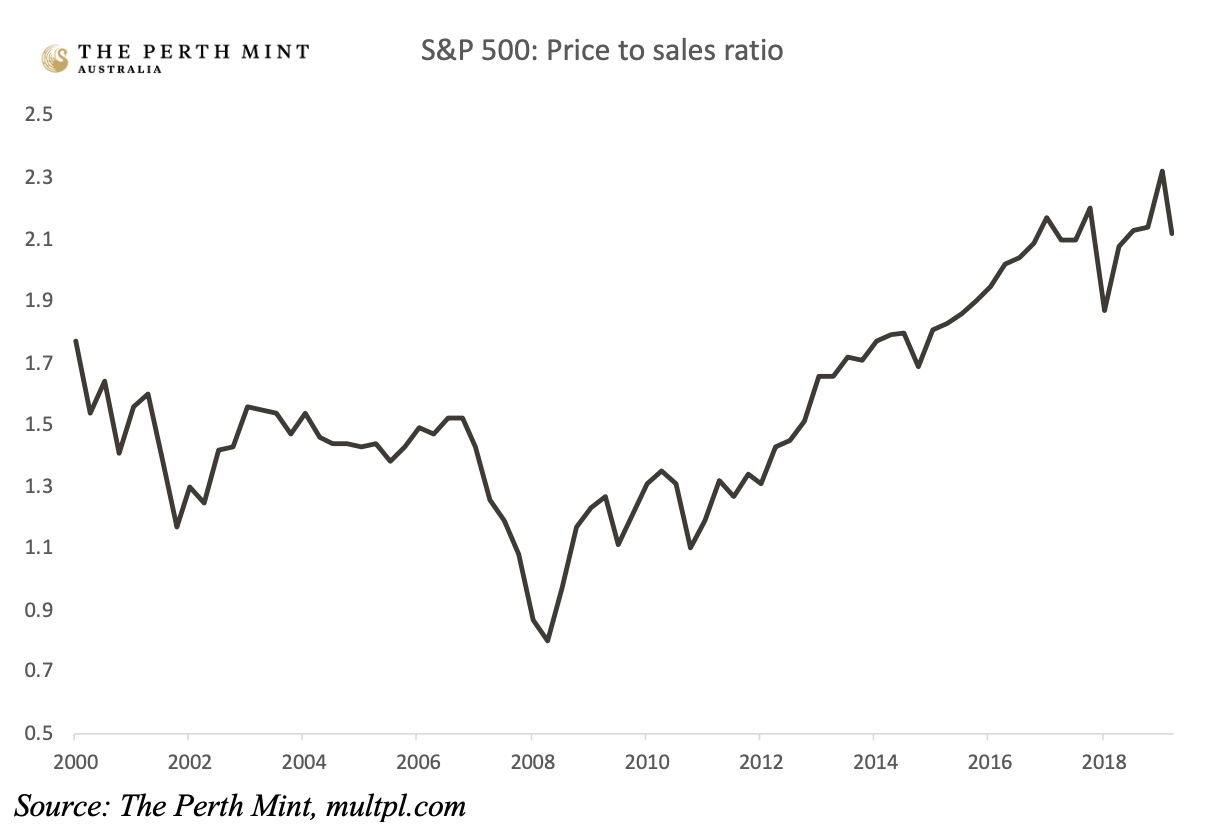
Using our fast food company analogy again, back in 2009 share market investors needed to spend $80 to buy $100 worth of hamburger sales. By the end of December last year those same $100 worth of hamburger sales cost investors $232.
That’s an inflation rate of approximately 17% per annum over the last 11 years.
· The rise of zombie companies
In 2018, the Bank for International Settlements (BIS) released a report looking at the rise of ‘zombie’ companies that are listed on global equity markets. Zombie companies are in effect organisations whose profits can’t meet their current debt servicing costs.
Logic would suggest that in the ultra-low interest rate environment we have been in over the last decade, there would be very few companies in this predicament. In reality, the opposite is true, with the BIS paper (which looked at 14 advanced economies) suggesting 14% of firms were zombies by the end of 2016, up from just 2% in the late 1980s.
This is not just a northern hemisphere phenomenon, with research from Coolabah Capital looking at the Australian market finding that up to 17% of companies listed on the ASX were zombies by the end of 2018, up from just 10.8% in 2010.
Whilst low rates will continue to help keep these companies afloat, one struggles to see how they can meaningfully lift investment given the apparent fragility in their financial circumstances.
Over the long-run one can expect this to depress economic growth rates, with the BIS themselves stating that; “Zombie firms are less productive and crowd out investment in and employment at more productive firms.”
Summary
Whilst none of the above factors guarantee that the recent weakness in equity markets will develop into a GFC like share market crash, or even that equity markets will perform poorly in years to come, they do suggest caution is warranted, especially given the ongoing economic risks and geopolitical tensions. Astute investors pay attention to the warning signs financial markets give off, and right now those warning signs are significant.
Combine these risks with the low to negative real yields available in traditional defensive assets like cash and bonds, and the strategic case for including gold in an investment portfolio today remains compelling.
Jordan Eliseo
Senior Investment Manager
The Perth Mint
4 March 2020
Disclaimer
Past performance does not guarantee future results.
The information in this article and the links provided are for general information only and should not be taken as constituting professional advice from The Perth Mint. The Perth Mint is not a financial adviser. You should consider seeking independent financial advice to check how the information in this article relates to your unique circumstances. All data, including prices, quotes, valuations and statistics included have been obtained from sources The Perth Mint deems to be reliable, but we do not guarantee their accuracy or completeness. The Perth Mint is not liable for any loss caused, whether due to negligence or otherwise, arising from the use of, or reliance on, the information provided directly or indirectly, by use of this article.
Never miss an update
Enjoy this wire? Hit the ‘like’ button to let us know.
Stay up to date with my current content by
following me below and you’ll be notified every time I post a wire
Gold and precious metal bull since early 2000. Have spent +25yrs working in investment analytics, research & portfolio construction, with a primary focus on the role of precious metals in investor portfolios. Author of two books on investing in gold and the causes of the GFC. Lover of markets, competition & technology
.jpg)
2 topics
.jpg)
Gold and precious metal bull since early 2000. Have spent +25yrs working in investment analytics, research & portfolio construction, with a primary focus on the role of precious metals in investor portfolios. Author of two books on investing in...
Expertise
Gold and precious metal bull since early 2000. Have spent +25yrs working in investment analytics, research & portfolio construction, with a primary focus on the role of precious metals in investor portfolios. Author of two books on investing in...
Expertise
Comments
Comments
Sign In or Join Free to comment