Housing Cracks Present Material Opportunities
Australian house prices are falling. Credit availability is tightening. US mortgage rates are rising. These and other factors have put building materials stocks under pressure. In this paper we assess value across the building materials sector given our assessment of “mid-cycle” housing starts and take a view on where we are in the housing construction cycle.
Significant underperformance creates a value investing opportunity
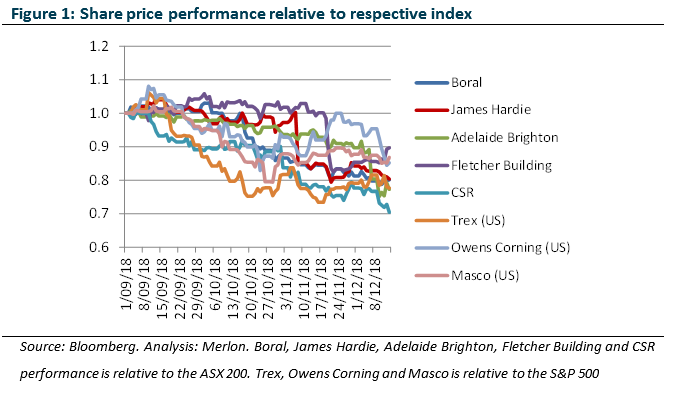
Australian and NZ focused building materials stocks were out of favour in 2018 while stocks exposed to the US housing recovery were well held. However, stocks across each of these markets underperformed their respective market indexes during the fourth quarter of 2018 (Figure 1) as sentiment towards the US turned. The market is of the view that the Australian and NZ housing cycles have peaked and that the US recovery has stalled.
Of course relative performance over a quarter does not indicate value because it depends on the starting point. Rather, current free cash flow yields provide a better initial guide to assess value (Figure 2).
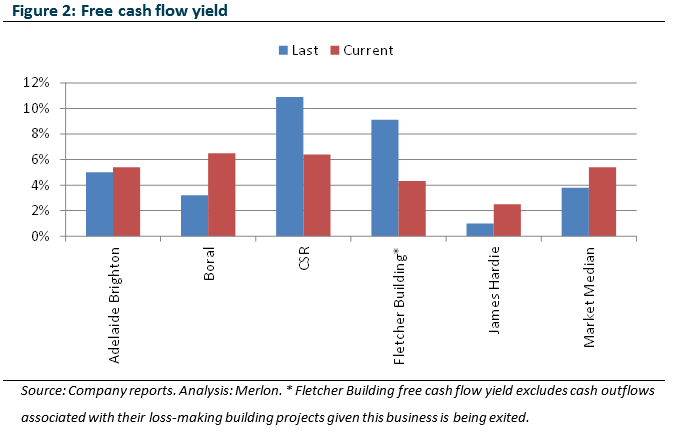
With the exception of James Hardie (where large market share gains continue to be priced in) the other four stocks appear generally cheaper than the market median. This is also evident in more simplistic measures such as enterprise value-to-EBIT (earnings before interest and taxes), with a range of 5.5x to 9.0x compared to the market average of approximately 15.0x.
Of course, Merlon valuations are based on sustainable free cash flow rather than current free cash flow. For cyclical stocks such as building materials, we determine sustainable free cash flow with reference to mid-cycle building activity levels. Furthermore, valuation is one of two research outputs, the other being analyst conviction. Conviction is about market misperceptions which Merlon can refute backed by evidence. For example, if the market is over extrapolating favourable cyclical conditions, we are likely to have lower near term earnings estimates than the market and lower conviction. Conversely, if the market is too pessimistic, we are likely to have higher estimates and higher conviction.
Mid-cycle housing starts a key driver of sustainable free cash flow
While end market exposures vary by stock, residential construction is clearly the key driver for the sector overall (Figure 3).
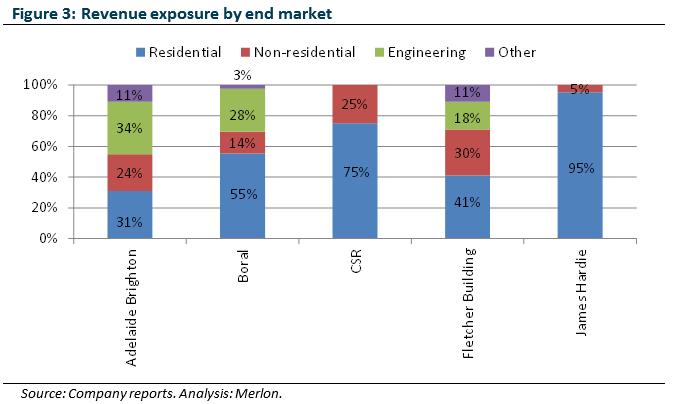
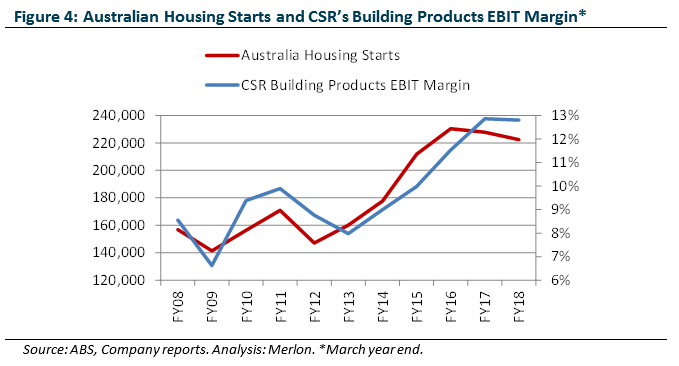
Within residential, the market focuses on housing starts since this is the key driver of demand. For example, with 66% of CSR’s revenue driven by new housing construction, its Building Products EBIT margin has been closely correlated with housing starts (Figure 4).
We estimate mid-cycle housing starts by observing the trend in housing starts per capita. Perhaps surprisingly, housing starts per capita has been declining in all three markets if we take a very long term historical view (Figure 5). In addition, Australia sits well above NZ and the US (partly as a result of a higher proportion of apartments).
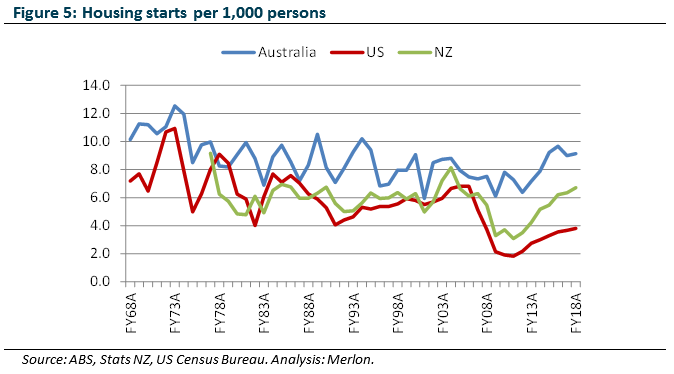
Increasing additions and renovations activity likely explains part of the decline (these now represent 11% of total Australian residential activity, up from 3% in 1974).
That said, the decline in housing starts per capita is less pronounced in recent years. Therefore, we derive our long run housing starts estimate using projected housing starts per capita in FY21. This gives 190,000 starts for Australia (7.2 per 1,000 persons), 26,000 for NZ (5 per 1,000 persons) and 1.5 million for the US (4.5 per 1,000 persons, higher than trend but accounting for the significant impact of the GFC on the trend line).
In the context of current activity, free cash flow for Australian and NZ based residential businesses should be lower in the long run than current free cash flow. Conversely, long run free cash of US based residential businesses should be higher than current levels.
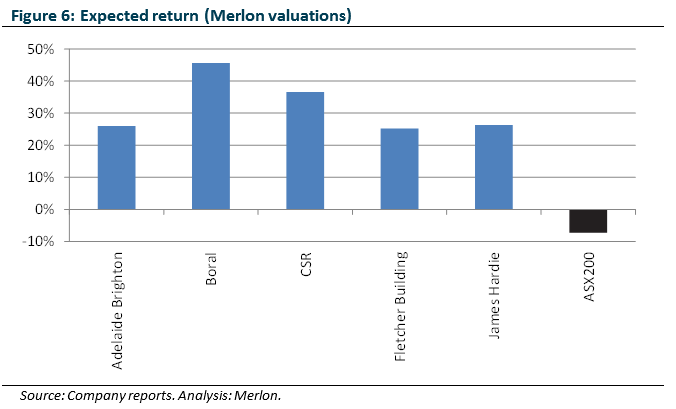
Given our assessed sustainable free cash flow and franking for each stock, we forecast significantly positive expected returns for the whole sector relative to the market (Figure 6).
Having formed a view on valuation, we now assess conviction with reference to where we are in the building cycles and whether the market is overly extrapolating cyclically favourable or depressed conditions.
Australian cycle above trend and turning down, NZ also peaking
Australia and NZ are at different points in the cycle to the US. Australian housing starts and NZ housing approvals (starts not available) are at record levels with their current cycles being stronger for much longer than prior cycles (Figure 7).
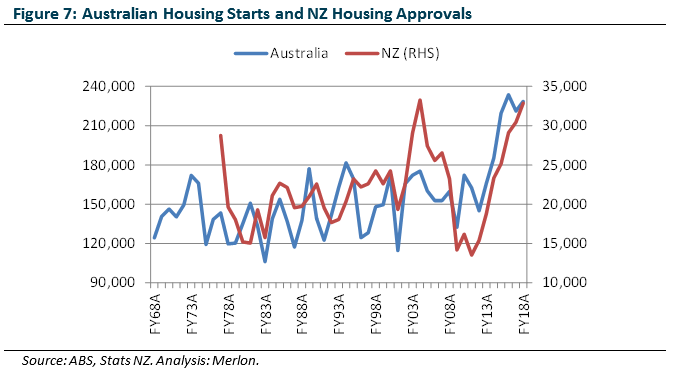
Until recently, the market was overly optimistic on Australia, hence our earnings estimates were generally below market and we had lower conviction. However, there are now clear signs that Australian and NZ housing starts have peaked and estimates are coming down.
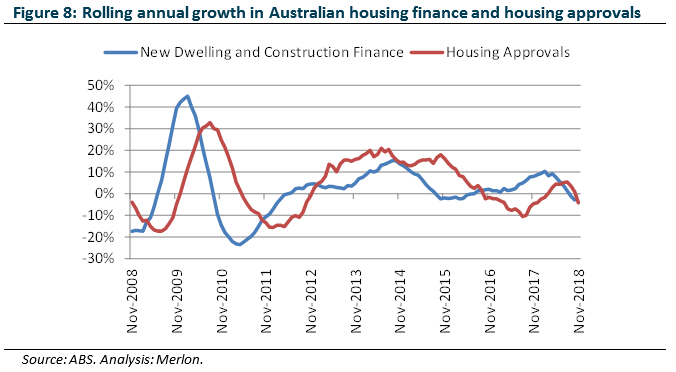
In Australia, both housing finance approvals and housing approvals have rolled over (Figure 8). Alarmingly, housing approvals were down 33% in November 2018.
Recent feedback from Fletcher Building and various property developers also point to a slowdown, particularly for apartments.
With earnings estimates now coming down and market expectations better calibrated to mid-cycle levels, our conviction is beginning to increase (most recently for Boral)
While housing finance data is no longer available for NZ, the quarterly growth in NZ housing approvals has begun to turn negative (Figure 9).
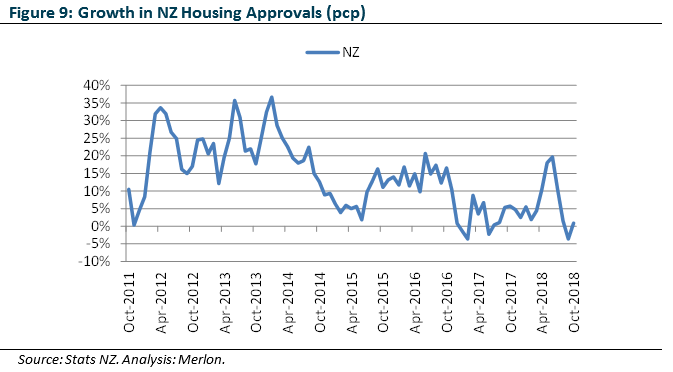
NZ house price growth is also moderating, particularly in Auckland (the key driver of NZ house construction). This will likely put some pressure on construction.
US cycle below trend but might peak below mid-cycle this time
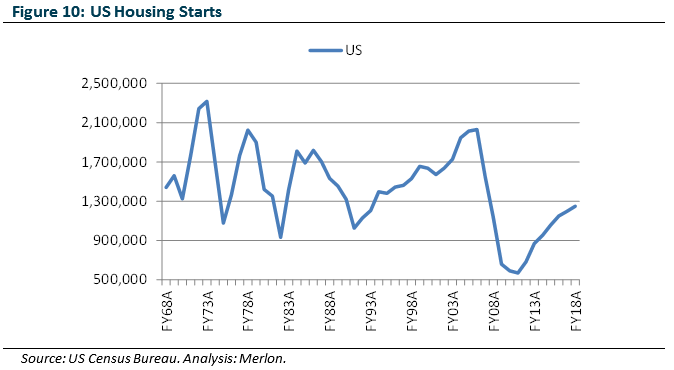
Meanwhile, the US has experienced a very prolonged yet very slow recovery in housing starts off record low levels following the GFC in 2008 (Figure 10).
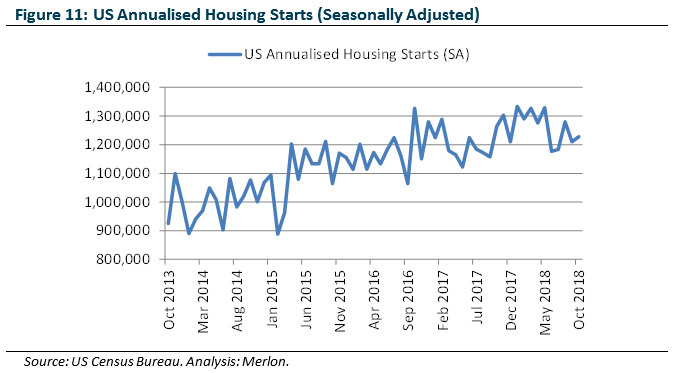
Up until recently there has been universally optimism on the US recovery. This constrained our conviction on Boral and James Hardie. However, the seasonally adjusted annualised figures now suggest that the recovery is slowing if not stalling (Figure 11).
Along with anecdotal feedback from US homebuilders, there are three leading indicators of US housing starts that may explain the slowdown.
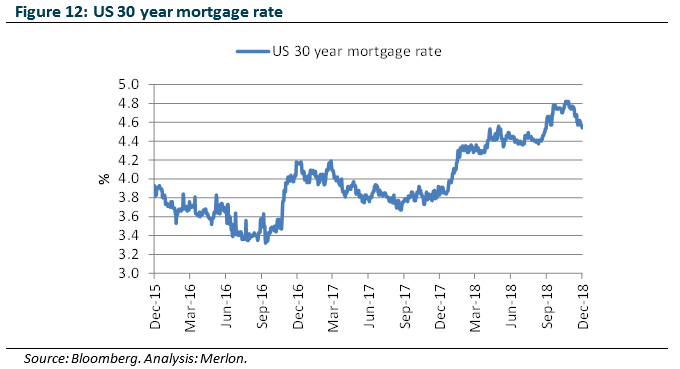
First, the US 30 year mortgage rate has been rising steadily, notwithstanding a slight pullback in recent weeks (Figure 12). As a result this is impacting house affordability.
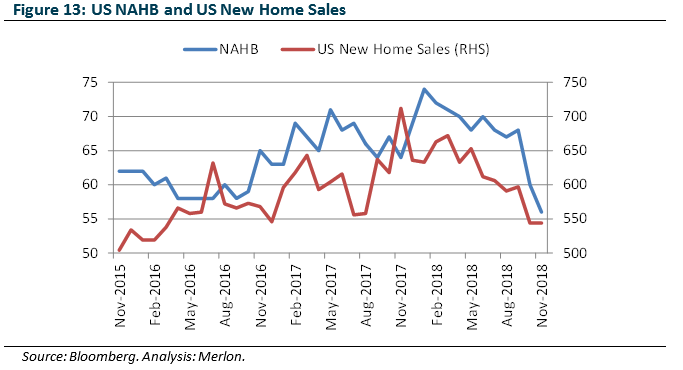
Second, the NAHB (a measure of US homebuilder’s activity) fell quite sharply in October and continued to fall in November (Figure 13). Finally, new home sales have been falling for quite a while now.
While we believe our long run estimate of 1.5 million starts is reasonable, we may find that the current cycle will peak at a level well below that.
Less market optimism on the US recovery and concerns about margins are feeding into lower earnings forecasts for Boral and James Hardie (more on this below). Our conviction is therefore building.
Market misperception around operating leverage
The leverage of operating margins to the US cycle for Boral and James Hardie had been overestimated by the market. However, this is being corrected as consensus FY20 EBITA (earnings before interest, taxes and amortisation) forecasts for Boral and James Hardie’s US segments have fallen by 15% and 17% respectively since August 2017.
We would expect some margin expansion through a housing construction recovery given fixed cost fractionalisation and improved pricing power as capacity in the market is utilised.
However, we believe the market continues to somewhat underestimate the level of cost inflation. A stronger US economy is leading to higher labour, raw material and energy costs and there are costs in ramping up production. This was my biggest takeaway from a recent tour of BLD’s and JHX’s US operations.
While our conviction is improving as US forecasts for Boral and James Hardie become more realistic, we remain below consensus. Therefore, we are looking for further consensus downgrades before lifting our conviction further.
Infrastructure spending to provide some offset
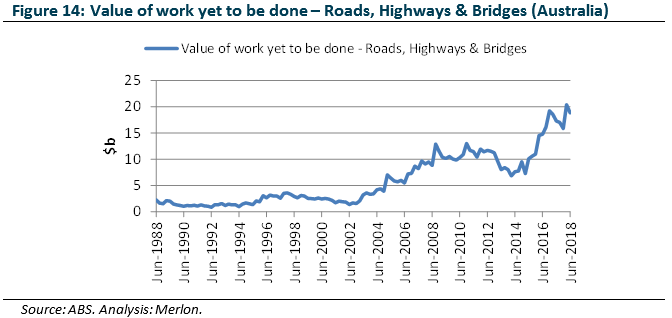
While there are emerging earnings concerns in the residential segment, increased government spending on infrastructure will be supportive of free cash flow over the next few years (Figure 14). This is particularly important for the likes of Boral’s and Adelaide Brighton’s construction materials businesses. Much of this work is concentrated in NSW where Boral’s market position is strongest.
The positive outlook for US infrastructure spending also supports Boral’s fly ash business.
M&A a spanner in the works
Our analysis of building materials stocks is not just about the cycle. We are also focused on company specific issues, of which there are many.
Assessment of James Hardie’s “35/90” strategy is critical to estimating its sustainable free cash flow. James Hardie’s objective is to drive the fibre cement category to a 35% share of the total US siding market (currently less than 20%) while retaining 90% share of the category. Our current estimates factor in 25/90 and margin expansion, though we plan to refresh our analysis.
Boral’s US business following the Headwaters acquisition in 2016 remains a concern. While the strategic rationale was sound, we felt Boral overpaid at the time (Boral’s High Price Acquisition of Headwaters). Given the significant recent decline in US exposed building materials stocks, Boral would have arguably been in a better position had it waited (though that is with the benefit of hindsight).
Our focus on Headwaters now centres on the sustainability of the base earnings and how much if any of the quoted synergies will be retained? While synergies were a key justification for the acquisition (as they usually are), in our experience they rarely hit the bottom line in full. Rather, some if not all synergies usually offset cost inflation and/or customer losses as existing management departs. Consensus forecasts originally seemed to imply that most, if not all, of the quoted synergies (initially US$100m but later upgraded to US$115m) hit the bottom line. However, as discussed earlier, we have seen Boral’s US segment forecasts cut. Indeed, US$39m of synergies were achieved in FY18 but these were more than offset by weather, lost volumes, operational issues and cost increases.
A resolution on the ownership structure of the Boral USG Plasterboard joint venture also looms large. This has been brought on by Knauf’s pending acquisition of USG. On this front we are optimistic that Boral is in a strong bargaining negotiation since it is not compelled to buy or sell. If it does acquire the other half of the joint venture it should be on somewhat favourable terms. We trust Boral will factor in the Australian residential slowdown into its offer price.
For Fletcher Building, key issues relate to the state of its balance sheet and construction losses that have been an ongoing source of disappointment. On the former, the recently announced sale of Formica will enable the restatement of the dividend while leaving plenty of room to buy-back shares. On the latter, we are reasonably confident that there will be no further provisions taken on its buildings and interiors (B&I) construction projects given the large provision taken by the new CEO in 2018. However, we remain wary of potential losses in its infrastructure business (albeit the downside is more limited than B&I).
Free cash flow generation varies across the sector
While many companies focus on EBITDA (earnings before interest, taxes, depreciation and amortisation), we are most concerned with how much EBITDA converts to free cash flow since this impacts our valuation of a business. Despite all operating within the same sector, there are significant differences across the companies with respect to their cash generation (Figure 15).
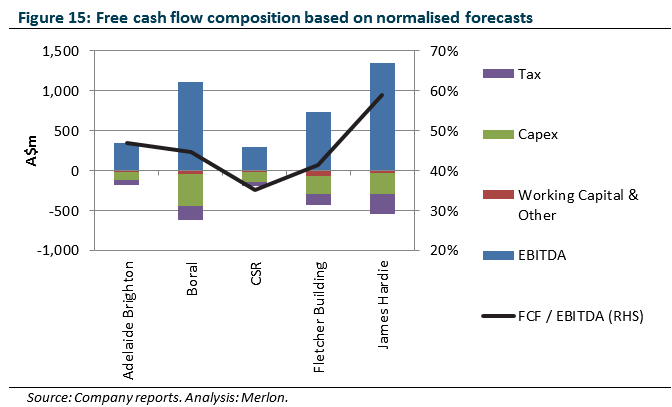
Generally speaking, light building products (eg fibre cement, plasterboard etc) are better converters of EBITDA than heavy construction materials (eg concrete, cement, bricks etc) that are more capital intensive. If all else was equal, we would prefer James Hardie given it is the best cash converter of the group. Its capacity additions are well covered by the high margins it earns on its products. Conversely, despite CSR’s exposure to light building products, its conversion is hamstrung by its poor cash generating Aluminium business.
Boral’s move to increase its light building products exposure through the Headwaters deal has led to improved conversion. Meanwhile, Fletcher Building’s conversion is depressed by its low returning Australian business.
Fund positioning
Overall, there is room to add to our positions in the sector as conviction increases with valuations not expected to change (anchored to mid-cycle assumptions).
Adelaide Brighton, once a market darling, has lost its lustre following several earnings downgrades and management departures. With valuation now more compelling, we have work to do to build conviction.
We observed earlier that CSR’s EBIT margin has typically moved in-sync with Australian housing starts. As housing starts moderate, we continue to see downside risk to CSR’s EBIT margin relative to consensus estimates given this historical relationship. As such we are looking for further consensus downgrades before we raise our conviction.
James Hardie offers an opportunity given its more reasonable valuation provided we can build more conviction on long run market share gains and margin expansion.
We retain our position in Fletcher Building and recently acquired a position in Boral.
Further insights
Merlon Capital Partners is an Australian-based boutique fund manager specialising in equity income strategies. For further insights please click here
Never miss an update
Enjoy this wire? Hit the ‘like’ button to let us know.
Stay up to date with my current content by
following me below and you’ll be notified every time I post a wire
Adrian joined Merlon Capital Partners as a Principal in May 2012 from AMP Capital where he was a Portfolio Manager/Analyst, responsible for investments in retail, food and beverage, transport and chemical sectors. He is a CFA charterholder.

2 topics
5 stocks mentioned

Adrian joined Merlon Capital Partners as a Principal in May 2012 from AMP Capital where he was a Portfolio Manager/Analyst, responsible for investments in retail, food and beverage, transport and chemical sectors. He is a CFA charterholder.
Expertise
Adrian joined Merlon Capital Partners as a Principal in May 2012 from AMP Capital where he was a Portfolio Manager/Analyst, responsible for investments in retail, food and beverage, transport and chemical sectors. He is a CFA charterholder.
Expertise
Comments
Comments
Sign In or Join Free to comment