How far is housing from fair value?
With the housing market continuing to make news, we examine nationwide house prices relative to changes in income, lending rates and a measure called ‘hypothetical borrowing power’, to assess how they compare to 'fair value'.
According to the ABS, nationwide established house prices peaked in December 2017. The subsequent falls were slow to begin with, but have now gathered pace. As the housing market weakens, negative wealth effects and weaker sentiment would likely see the heavily indebted household sector further dampen spending.
Household consumption expenditure came in below expectations in the recently released September quarter national accounts. Private consumption spending has been the key contributor to Australia’s expansion over the past decade. Net exports and investment are unlikely to offset a strong contraction in the household sector.
We are not anticipating an economy-wide collapse in house prices, but it is not entirely out of the question. Such an outcome would likely require an increase in unemployment and lending rates.
Aussie house prices relative to changes in income, lending rates and hypothetical borrowing power
On Tuesday, the ABS released the September quarter figures for its housing price index and reported a 1.7% quarterly decline in established house prices. It noted that falls in Sydney and Melbourne had extended beyond more expensive properties to the middle and lower segments of the market. Sydney and Melbourne are the key contributors to the index.
Exhibit 1 depicts the average of median house prices nationwide and compares this to Average Weekly Earnings (AWE) using ABS data going back to August 1994. Please note that the final observation includes our estimate for AWE (scheduled for release in February), based on historical growth rates and recent trends.
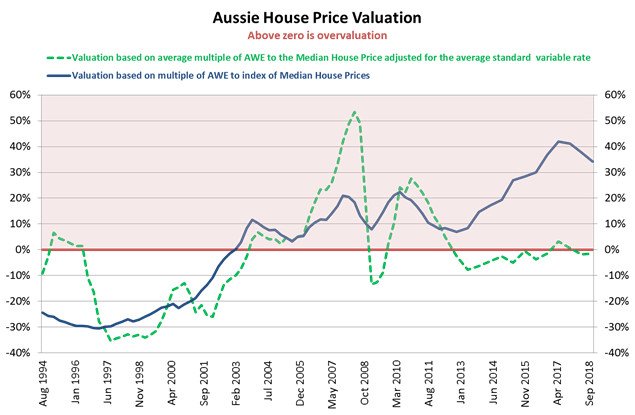
Exhibit 1: Australian established house prices—source ABS, RBA, Evergreen Consultants
Between August 1994 and November 2002, the ratio of the median house price to AWE always ranged between 4x and 6x, with an average of 4.7x.
Since then, a number of structural changes have taken place including an increased desire to own housing, looser lending standards, lower borrowing rates, a surge in the population and the associated increase in household formation.
Inter alia, this has caused a step change in the price-income ratio, and from February 2003 to November 2013 the multiple rose to 6.7x.
In the period beyond this, house prices took a further leg up with purchasers prepared to pay more than 8x AWE for the median-priced home. The multiple now stands at around 8.1x AWE, having peaked at 8.6x in May 2017.
The overall average since 1994 is just over 6.0x AWE. This can be loosely thought of as an indicator of fair value, which is depicted by the bolded line spanning the 0% axis.
On this basis, housing is currently 34% above the average, coming in from 38% in the previous quarter (see the blue line in Exhibit 1). This change can be interpreted as a quarterly reduction in the degree of overvaluation.
On this measure, Australian housing post-1994 reached its most overvalued level around mid-2017, where the blue line in Exhibit 1 was 42% above fair value.
Impact of interest rate fluctuations
Once changes in home lending rates are taken into account this gives a very different perspective.
The hashed green line in Exhibit 1 above shows what happens when the ratio of the median house price to AWE is adjusted for changes to the standard variable home loan rate. This is a more volatile measure, but is relevant to Australia due to its relatively low level of fixed rate home loans.
When lending rates were being pushed up between 2006 and mid-2008 to levels well above the current twenty four-year average of 7.29% p.a. to as high as 9.6% p.a., all else being equal, the impact was to lower fair value. By this simple measure, Australian housing reached peak overvaluation in mid-2008.
In other words, had the lending rate remained at 9.6% p.a. and growth in Average Weekly Earnings stalled, then over time the estimated nationwide median house price could justifiably have come back by more than 50%. Is it any wonder why property investors were especially nervous at the time?
With the standard variable home loan rate now back at 5.35% p.a., this methodology currently suggests that housing is slightly undervalued.
It serves as a poignant reminder of just how sensitive house prices are to changes in interest rates. Since the beginning of 2012, the standard variable interest rate has fallen from above 7.5% p.a. to below 5.5% p.a. During this period, the median established house price in Australia had at one point risen by more than 50% and, even after recent falls, still hovers close to this level.
Hypothetical borrowing power
Exhibit 2 illustrates a slightly different approach to housing valuation, where house prices are linked to borrowing power by estimating some hypothetical ability to borrow. This is not a new concept and there are other economists who have done this using data going back to 1983 on a capital city basis.
My data set commences in 1994 and as it turns out valuation was not greatly out of kilter at this time when using the simple method above of taking home lending rates into account.
The borrowing power index is a function of lending rates, AWE, up-front deposit requirements (so as to avoid mortgage insurance), and repayment serviceability standards. The latter two components are kept constant in the analysis, but any factor can be adjusted to do sensitivity analysis if desired.
This borrowing power index is then compared to an index of weighted median established house prices across capital cities. A valuation ratio is calculated with the 1994 level forming the baseline for the analysis.
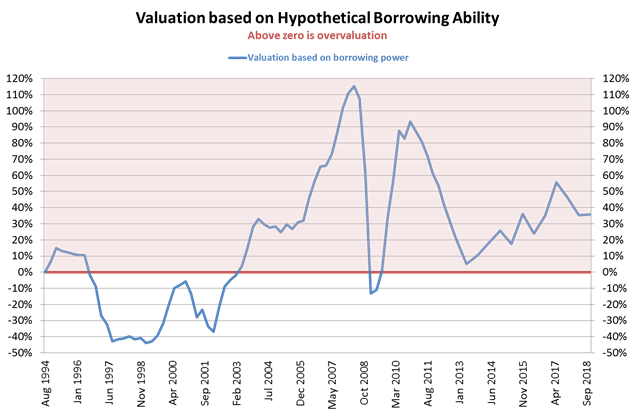
Exhibit 2: Australian housing valuation based on hypothetical borrowing ability—source ABS, RBA, Evergreen Consultants
Looking at Exhibit 2, throughout the mid to late 1990s borrowing power was rising faster than the median house price. The result indicates that the housing market was significantly undervalued right up until early 2003.
Subsequently, as a result of rising interest rates, moderate rises in income and faster increases in the median house price index, the model suggests that there was ‘bubble-like’ overvaluation by mid-2007, peaking during 2008.
However, the sharp decline in home lending rates (as the RBA panicked during the GFC) reintroduced vast amounts of borrowing power bringing relative valuation back into line by the beginning of 2009.
Another spurt in the median house price along with increases in lending rates reignited overvaluation by late 2010, though this largely dissipated by mid-2013. Since then, overvaluation has been rising, even as interest rates have generally declined. On the basis of hypothetical borrowing power, established houses are 36% overvalued nationwide.
Summary
Two of the three measures presented in this note demonstrate that, despite falls over the past twelve months, Australian housing is still well above fair value.
However, a cursory glance at the charts presented in Exhibits 1 and 2 means that one would be naïve to believe that prices would stay at fair value for any significant period.
Conducting the sort of analysis presented in this note on a capital city basis is likely to identify huge disparities among Australia’s regions. In a future wire, we will compare median AWE in capital cities to their respective median house price index and overlay this against borrowing conditions.
Executive summary
- With the housing market continuing to make news, we examine nationwide house prices relative to changes in income, lending rates and a measure called ‘hypothetical borrowing power’.
- A collapse in residential property prices would likely put Australia into recession as debt-burdened consumers pare back spending.
- While a hard landing in the residential housing market is not our base case, it is not entirely out of the question. The OECD reached a similar conclusion in its 2018 Economic Survey of Australia and says a wave of mortgage defaults is unlikely.
- Over the past fifteen years there have been two step changes upward in income multiples that have facilitated Australian house price growth.
- Between August 1994 and November 2002, the ratio of the median established house price to income was 4.7x. From February 2003 to November 2013 the multiple rose to 6.7x—it now stands at around 8.1x AWE, having peaked at 8.6x in May 2017.
- The overall average since 1994 is just over 6.0x AWE. This can be loosely thought of as an indicator of fair value and we use this as the baseline for our analysis.
- On this basis, housing has gone from being 7% overvalued in November 2012 to 34% overvalued in November 2018. In May 2017, this level reached 42%.
- Adjusting for changes in interest rates we find house prices close to fair value. Indeed, with the standard variable home loan rate now back at 5.35% p.a., this methodology currently suggests that housing is just 1% undervalued.
- However, taking this a step further and linking house prices to borrowing power through estimating some hypothetical ability to leverage, house prices are 36% overvalued.
- The borrowing power index is a function of lending rates, AWE, up-front deposit requirements (so as to avoid mortgage insurance), and repayment serviceability standards.
- In our next update, we intend to extend this analysis to a capital city basis.
Never miss an update
Enjoy this wire? Hit the ‘like’ button to let us know.
Stay up to date with my current content by
following me below and you’ll be notified every time I post a wire
Angela co-founded Evergreen Consultants, a bespoke investment consultancy assisting financial advisory firms build robust investment solutions. She has held senior investment roles at QIC and Lonsec, and was Head of Ratings at van Eyk Research.

2 topics

Angela co-founded Evergreen Consultants, a bespoke investment consultancy assisting financial advisory firms build robust investment solutions. She has held senior investment roles at QIC and Lonsec, and was Head of Ratings at van Eyk Research.
Expertise
Angela co-founded Evergreen Consultants, a bespoke investment consultancy assisting financial advisory firms build robust investment solutions. She has held senior investment roles at QIC and Lonsec, and was Head of Ratings at van Eyk Research.
Expertise
Comments
Comments
Sign In or Join Free to comment