Is this the calm before the storm?
Over the last 24 hours a lot of air play has been given to an article by US powerhouse Morgan Stanley saying “The stock slide was an appetizer for the real deal” certainly a title to scare many investors. The crux of their thought process is the looming damage that rising bond yields will have on stock prices. We liked a lot of their reasoning and will today revisit our view for the next few months, what we believe will be the most important period for stock market investors since the GFC.
At MM we are becoming increasingly confident that the Q1 low is in place for global stocks with a rally into April / May our preferred scenario – don’t argue with strong seasonal statistics! – Please enjoy today’s report outlining / explaining our current thought processes from here, importantly, since we are now essentially fully invested after allocating our ~20% cash into the recent panic sell off.
Seasonality
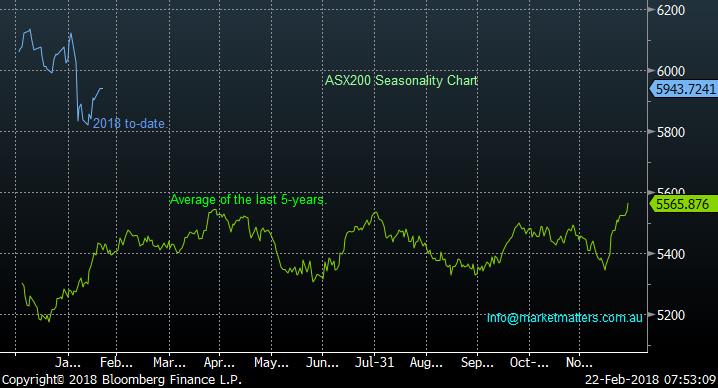
We have discussed at length our reasoning / logic behind the forecast of a decent swing low in early February with the 5786 point mark reached on the 9th looking the goods at present - but what usually comes next if we are correct is rapidly becoming important. Since the GFC:
1. The average rally from the Q1 swing low into an April / May high is 450-points which targets 6235, assuming 5786 holds – not an unrealistic target if the banks come back into favour i.e. up less than 5% from current levels.
2. The market forms a swing high between April and May with no clear pin point target implying slow selling into strength makes sense.
Hence until further notice we will stay long local stocks looking to significantly increase cash levels into April / May.
ASX200 Seasonality Chart
US Stocks & interest rates
Again this morning a couple of points caught our attention from the US market last night / this morning:
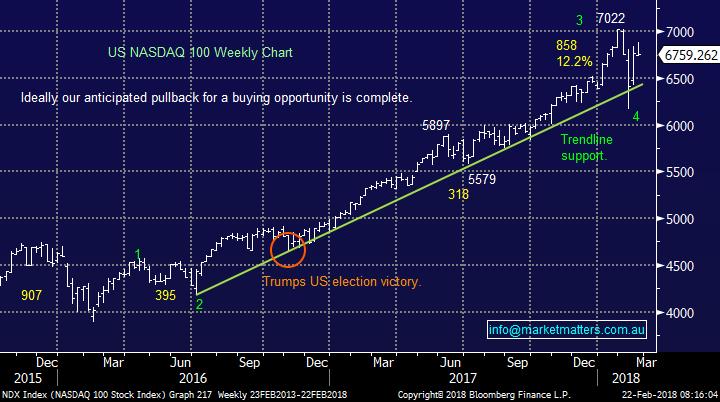
1. The tech. loaded NASDAQ Index traded within 2% of its all-time high last night, we can eventually see another 10% upside. – we often say the NASDAQ is usually the “leading index”.
2. However short-term we think the +11.6% advance from the panic lows on the 9th is probably complete and a few days / weeks weakness, or consolidation, is our preferred scenario.
US NASDAQ Weekly Chart
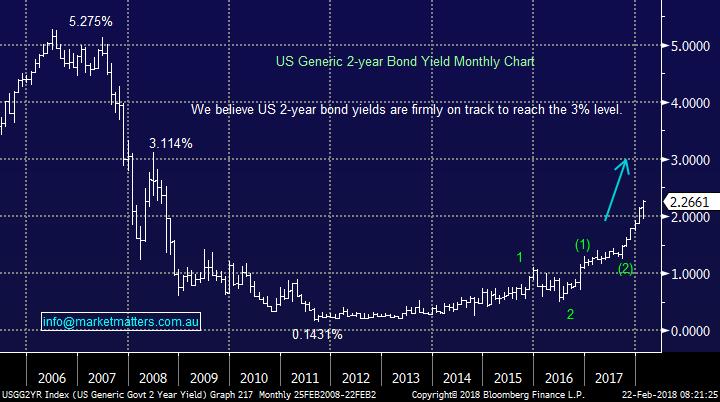
Following the Fed's optimistic minutes last night US bond yields rallied to multi-year highs, this is an advance that we believe has much further to go e.g. US 2-year bond yields look likely to hit ~3% in 2018/9.
As we have seen over the last week, strengthening US bond yields is slowly dragging the $US higher and this should be taken into account when structuring local portfolio’s moving forward i.e. the $A has already fallen from 81.3c to 78c.
US 2-year bond yields Monthly Chart
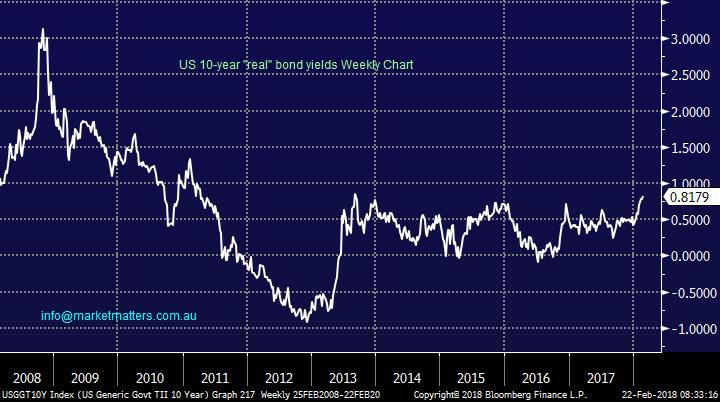
One chart / point that Morgan Stanley looked at in their piece discussing the “calm before the storm” was real US 10-year bond yields i.e. inflation adjusted bonds.
Clearly these are still range bound although in our opinion it’s a matter of time before real bond yields break higher, this could easily be a catalyst to send equities lower hence its now firmly on our radar.
US 10-year “real” bond yields Weekly Chart
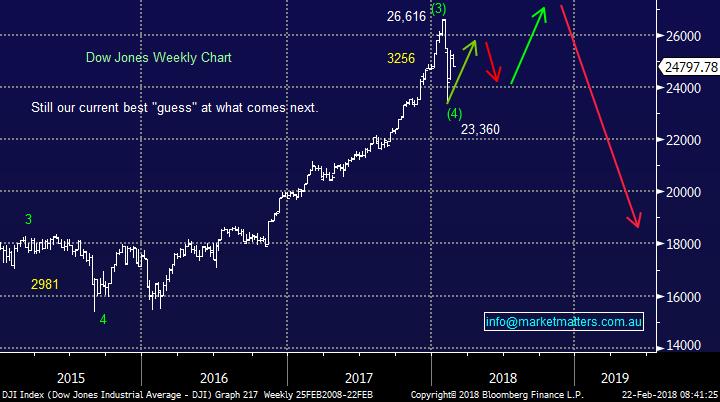
Looking bigger picture at US stocks, while we expect the US market to rally to fresh highs the likely manner of the advance is far more choppy / indecisive than the almost exponential gains we have witnessed from late 2016.
Similar to both 2010 and 2014 we believe that US stocks have given the market a relatively friendly warning recently – a nudge around what could be on the horizon. At this point in time I expect investors to slowly forget the recent volatility and refocus on all the bullish fundamental reasons to be in stocks ideally pushing global markets back up to fresh all-time highs before buying the next dip will become very dangerous. MM view from here:
1. Global markets are likely to regain their bullish euphoric mood through February / March and push prices back to all-time highs.
2. Following later in 2018/9 will be a ~20% correction back to the lows of 2016 i.e. hence our recent buying into the recent weakness is relatively short-term in nature.
US Dow Jones Weekly Chart
Local Index
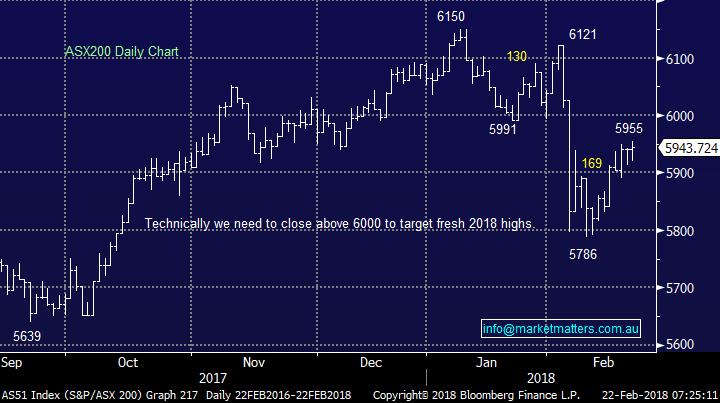
Yesterday’s the ASX200 closed essentially unchanged after yet again rallying for most of the day and closing very near its high. Overall the local market looks constructive and when we bore into its solid advance from its recent panic lows, for the active trader we would be a buyer of any +60-point correction.
However we still need a decent close above the psychological 6000 level to become technically bullish targeting ~6250.
ASX200 Daily Chart
Conclusion
We remain bullish stocks into April / May, but be prepared for increasing volatility as the market looks for a top.
Have a great day
James & the Market Matters Team
The above is an extract from the Market Matters Morning Report. To gain access to all reports for the next 14 days, including our picks into the market drop, CLICK HERE
Never miss an update
Enjoy this wire? Hit the ‘like’ button to let us know.
Stay up to date with my current content by
following me below and you’ll be notified every time I post a wire
James is the Lead Portfolio Manager & primary author at Market Matters, a digital advice & investment platform with over 2500 members that offers real market intel & portfolios open for investment. He is also a Senior Portfolio Manager at Shaw and Partners heading up a team that manages direct domestic and international equity & fixed-income portfolios for wholesale investors.


James is the Lead Portfolio Manager & primary author at Market Matters, a digital advice & investment platform with over 2500 members that offers real market intel & portfolios open for investment. He is also a Senior Portfolio Manager at Shaw and...
Expertise
James is the Lead Portfolio Manager & primary author at Market Matters, a digital advice & investment platform with over 2500 members that offers real market intel & portfolios open for investment. He is also a Senior Portfolio Manager at Shaw and...
Expertise
Comments
Comments
Sign In or Join Free to comment