Livewire Summer School: Investing in Australian Small Cap Equities – There’s a better way

Greg Cooper
There are lots of reasons why investors get excited about small cap stocks, particularly in Australia: the significantly larger opportunity set outside of the top 100 companies, the higher growth rates that small companies can achieve, and the myriad of successful individual stock stories that abound. Global academic research has consistently pointed to the long term returns available from “the small cap effect” relative to larger companies.
To some extent these are true – there is considerably more economic diversity available by venturing into small cap Australian equities and the potential for some very strong growth stories to emerge.
However, the generally accepted approach that we should carve out a specific part of our portfolio for dedicated small cap investment (however we might define that) should be subject to the same rational review as any investment opportunity. In particular, with a large number of managers offering what look like exceptional track records, or the current press around the latest LIC/LIT opportunity not to be missed, it’s easy to miss a bit of the wood for the trees.
While many investors in Australia take a decision to structurally overweight small cap stocks given the sector and stock concentration in the large cap index, our analysis suggests that a separate allocation to small cap isn’t necessarily the best or most cost effective way to achieve this.
The small cap index is a dud index
The following two charts show the rolling 10-year performance of the small and large cap (S&P/ASX 200) index along with the 10-year annualised volatility of each index.
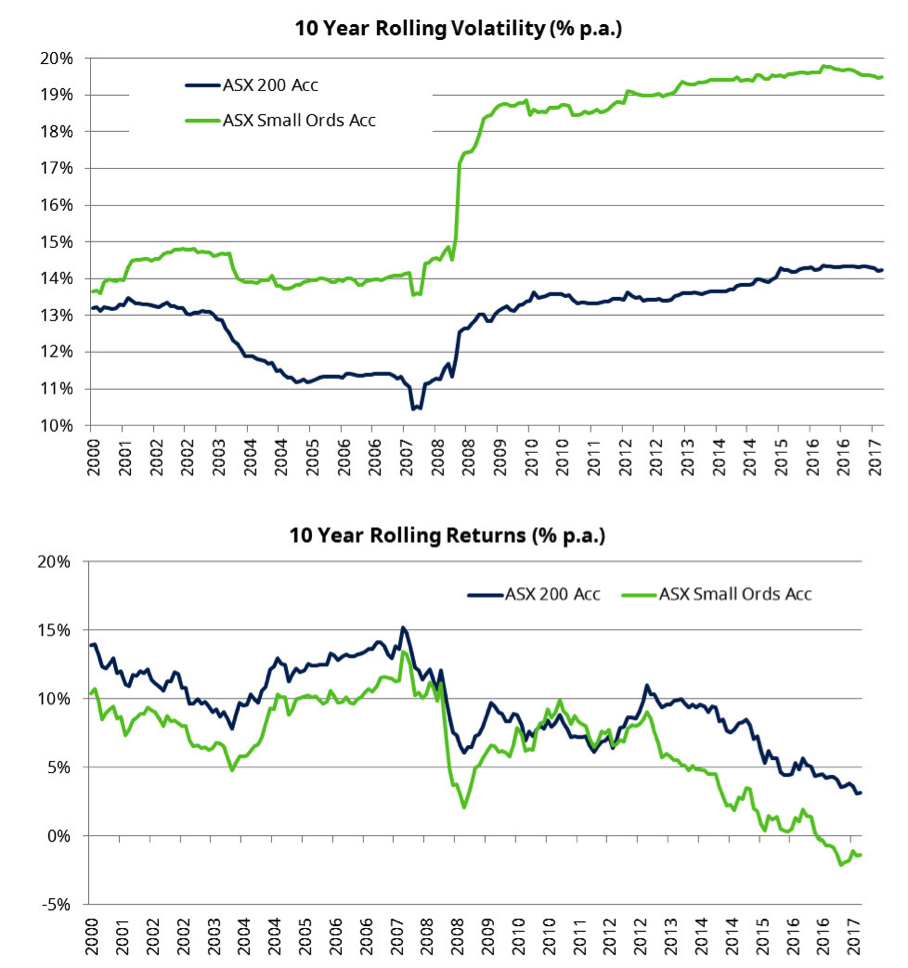
Put simply, at an index level, it simply hasn’t made sense to own the small cap index relative to the large cap index over any reasonable time frame, let alone once we account for the risk of small caps being pretty consistently 25% higher than that of large caps since the GFC. The long-term “drag” from small caps in Australia relative to large caps has been in the order of 2.8% p.a. since 1990 (bearing in mind we use the All Ords prior to 1/4/2000 which includes small cap) and 4.3% p.a. over the last 5 years.
However, this is not to say that there are not significant opportunities in small caps from time to time – the following chart highlights the one-year performance differential of small caps versus large cap stocks.
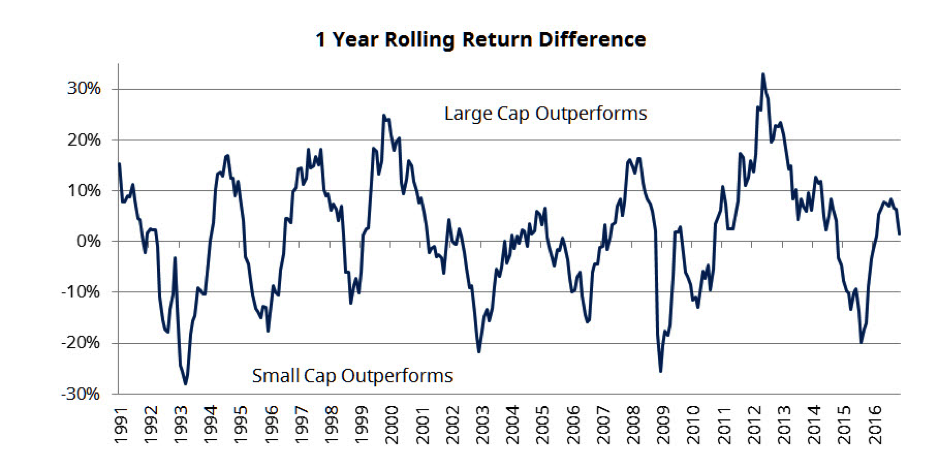
While large caps have structurally outperformed, the performance differentials between small and large cap Australian equities have been significant and highly cyclical, representing a potential for additional value add.
As such, we would suggest that investors should look at the asset class in aggregate rather than having a structural weight to a subsector of the asset class that has shown significant, consistent underperformance and considerably higher risk. While this may be implemented in separate allocations, investors should at least consider a more active approach to the relative weights in large and small caps.
Why does the small cap index structurally underperform?
Australian market indices have a unique history with the Australian Securities Exchange (ASX) setting construction rules around the particular circumstance of the Australian market. Indices were set up to reflect the needs of the local capital markets - in particular for small companies to be able to raise capital. The nature of the local market meant that many of these companies were non-revenue generating mining companies who would raise capital for the purpose of exploration or mine development - and in the absence of a venture capital industry this capital was sought through the listed company stock exchange. So, unlike many other markets (detailed below), the Australian market indices were built around, at times, a large number of non-revenue or profit generating companies – and this methodology was continued after S&P Dow Jones took over the ASX index business in April 2000.
Despite having strict rules in other markets around current profitability and financial viability, when S&P Dow Jones took over the ASX indices (now known as S&P / ASX) there was no change in the index construction process that considered financial viability as a key determinant of index inclusion. When looked at through an active small cap equity manager lens, one of the most effective portfolio construction methods was to avoid the losers - which in the Australian market (outside occasional periods of speculative excess) were often embedded in these loss-making index constituents.
There is no question that given the poor index construction methodology employed in this part of the market, investors should actively manage this exposure.
But don’t small caps offer much greater earnings growth prospects?
Interestingly, and despite the offshore evidence to the contrary, the answer for Australia is: No.
The chart below shows the relative actual earnings growth of small and large cap companies over the 10 years since 2007, with data rebased to 1 from Nov 2007.
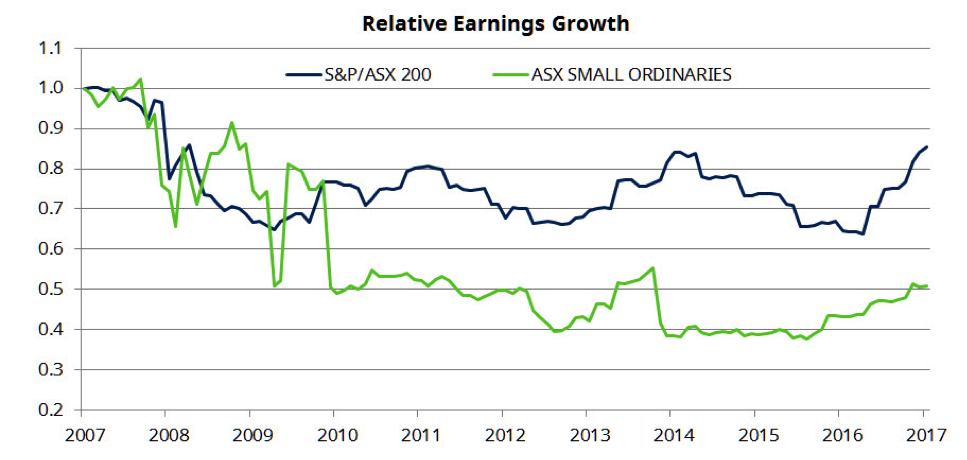
Source: Thomson Reuters Datastream, From 1 November 2007
It is clear from the chart that over the last decade large cap earnings have significantly outpaced small cap earnings, albeit within each market there will be areas where we have seen significant earnings growth for a period of time. The assumptions that the small cap effect exists in Australia at an index level as returns have been better and that is a function of better earnings growth is, put simply, false. Again, we would suggest that flexibility here is the key to exploiting the opportunities that can and do arise in small caps from time to time – this means both actively managing the small cap exposure and actively managing the allocation to that exposure.
But the average active manager in small caps does such a good job?
True (until recently), the average active manager in Australian small caps has shown a startling propensity to outperform the index. Our view would be that this is due in a large part to the inefficiencies in the index construction methodology, among other things.
The Mercer Australian Small Companies survey data shows the median small cap manager has outperformed before fees by 7.32% p.a. over the last 10 years (albeit there are only 23 managers with 10-year data, versus 45 managers in the survey today). Clearly if the index is so poorly constructed we should expect a level of outperformance from active management, albeit we need to adjust for the significant survivorship bias in these results. Importantly, however, we should at least consider the fees we pay for that outperformance as being better structured if they were against the broader opportunity set, not just the small cap index.
The chart below shows the rolling 3-year outperformance of the median Australian small cap manager after adjusting for (some) survivorship bias. We consider this against both the small cap index and against the broader S&P/ASX 200 index for comparison.
Most standard surveys only include managers with a track record up until the date of the survey – they exclude managers who may have had a strategy that closed during the period. In some cases, this can be managers who have done extremely well, closed to new business and removed themselves from the survey. More often than not it is managers who have done poorly and closed and the strategy (Schroders closed its small cap strategy in April 2016, albeit after a period of significant outperformance).
In total, 1/3rd of the universe has disappeared in the last 10 years. The net result of this can be a significant bias upward to the standard survey results (e.g. our 30 Sep 2017 figure is a median excess return of 1.1% p.a. vs 2.2% p.a. for the unadjusted Mercer survey). Our results below are based on all managers who have at least an 18-month track record and include managers in the calculation up until the date they remove themselves from the survey.
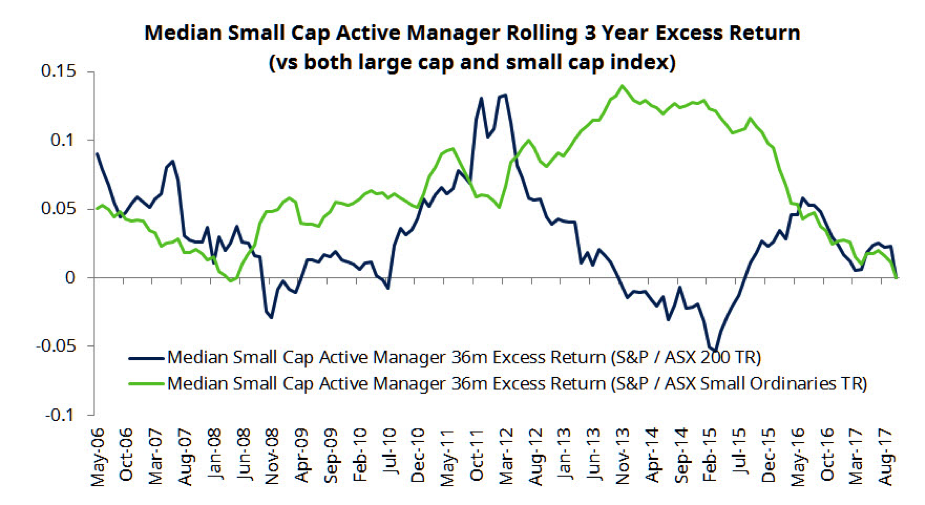
Source: Schroders, Bloomberg, Pre Fees
While at times this outperformance has been significant (against both indices), this is somewhat flattering relative to large caps given the significant (circa 5% p.a.) underperformance of the small cap index relative to large cap over this time period. Our point here is that the decision to allocate assets around some arbitrary cut-off by stock number can lead to quite varying results.
Somewhat more importantly for investors, the propensity of managers to utilise performance fee structures vis-a-vis the small cap index has meant that significant gains have accrued to managers of these portfolios as all of the analysis above is before fees are taken into account.
Our analysis of the fee differential between small and large cap managers is shown below. We note that the fees on small cap portfolios can be quite significant in absolute terms, and are on average 60% higher than that for large cap portfolios. While at a base fee level there is some justification for this given the relative size of assets that can be managed in each market cap segment, we would suggest investors should be wary of the potential for large performance fees to be accrued versus the poorly constructed small cap index. This is further magnified on a year to year basis with outsized performance fees being achieved, hence the wide range of outcomes in the chart below.

Source: Schroders, Mercer, 10 years to 30 June 2017
Valuations
Unsurprisingly valuations on small cap and large cap companies can vary significantly over time and at present small cap P/E’s at 18.7x are relatively high compared to history and higher than large cap at 16.8x. The chart below highlights the variability of both small and large cap P/E’s over the last decade.
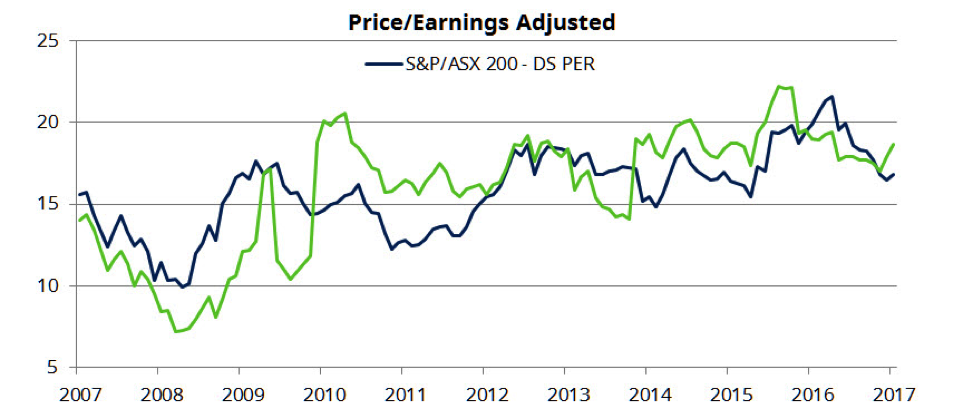
Source: Thomson Reuters Datastream
While both have drifted up (like all asset prices) over the period, small cap valuations have shown a greater variability (which could be a function of price variability and/or earnings variability) relative to large cap. Interestingly, if we constructed a very simplistic analysis of starting P/E differential between large and small cap and subsequent 3 year performance differential we get the results shown in the chart below. For reference, as of mid-November 2017 we are at -1.8.
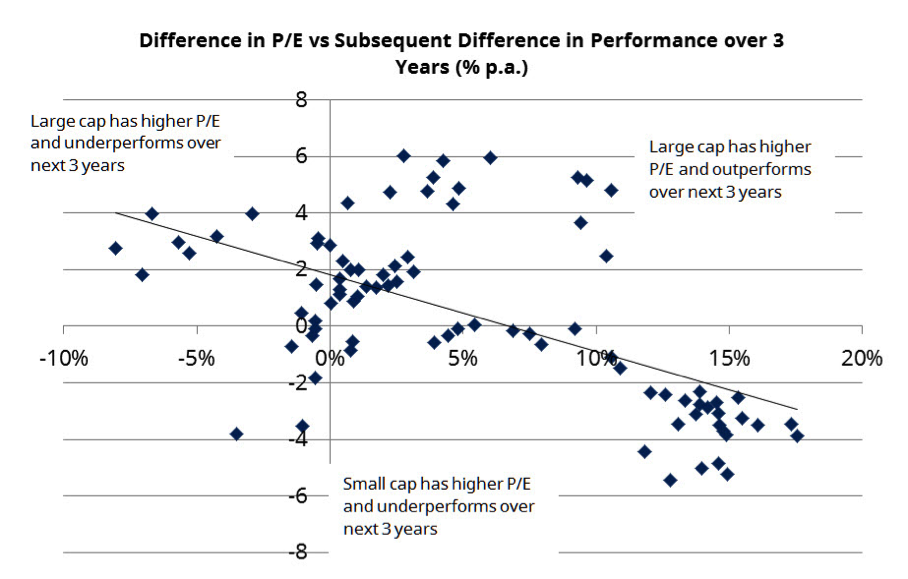
Source: Thomson Reuters Datastream, Global Financial Data, Schroders Analysis
In summary, there is a distinctive trend towards higher valuations in small cap leading to subsequent underperformance relative to large cap, yet higher valuations in large cap not necessarily leading to underperformance relative to small caps.
On this analysis, it clearly makes sense for investors to explicitly consider the valuation differences between small and large cap stocks in making their investment allocation decisions. Once again, investors would be better served by considering the total Australian equity opportunity set in and making relative value decisions across the entire market cap spectrum rather than specifically focussing on small (or indeed large) cap stocks only.
Conclusion: there is a better way
An objective look at the opportunities presented across the small and large cap Australian equities market suggests that segmenting the allocation by market cap (as defined by some arbitrary stock number) isn’t necessarily the best way for investors to manage their portfolio. While investors may wish to consider a bias towards smaller caps to take account of the greater economic diversity from this part of the market, we present a number of reasons why an alternative broad cap exposure is a more rational way to structure a clients’ aggregate Australian equities exposure versus separate small and large cap portfolios. In particular, we conclude that:
1. The small cap index is poorly constructed and suffers from significant structurally lower long term performance, higher risk and poorer earnings growth characteristics.
2. Active management of this part of any Australian equity exposure is both essential and rewarding.
3. The appropriate benchmark against which performance should be measured and fees calculated is a broader market index or the large cap index rather than a specifically small cap index as this is more representative of the opportunity set and removes the bias created by an arbitrary index cut-off.
4. The performance differentials between small and large cap stocks, while biased in favour of large cap, have shown significant historical variability and this represents a greater opportunity for investors with broad cap research capabilities to add value.
As such, in our view the choices available to investors that want small cap exposure as well as large cap exposure are:
1. invest in two separate strategies (large cap and small cap) and actively manage the allocation between these strategies or;
2. invest in a strategy that provides a fund (with the requisite skills) the flexibility to invest across the broader Australian Shares universe (S&P/ASX 300)
We believe that both options have pros and cons and both should be considered by investors looking to get exposure to small companies in their portfolios.
For further insights from Schroders Australia, please visit our website
Never miss an update
Enjoy this wire? Hit the ‘like’ button to let us know.
Stay up to date with my current content by
following me below and you’ll be notified every time I post a wire
By
Greg Cooper,
