The best performing stock market on Earth
Australia has been the best performing equities market globally over the last 120 years, according to the latest edition of the Credit Suisse Global Investment Returns Yearbook 2020. But according the Andrew McAuley, Chief Investment Officer at Credit Suisse, the more surprising finding was that it managed this while experiencing the second lowest volatility in the world.
“Global equities returned 5.2% p.a. in real terms over the last 120 years, and bonds returned 2% in real terms. But the big news for Australians is that the Australian stock market won the gold medal. It is the best returning stock market in US Dollar terms in the last 120 years.”
The lower levels of volatility were particularly surprising as Australia’s equity markets have traditionally been overweight mining companies, which are highly cyclical. For more information, watch the video or read the extract from the yearbook below. The Summary Edition of the Credit Suisse Global Investment Returns Yearbook 2020 is available for download at the bottom of this wire.
The Great Transformation
At the beginning of 1900 – the start date of our global returns database – virtually no one had driven a car, made a phone call, used an electric light, heard recorded music, or seen a movie; no one had flown in an aircraft, listened to the radio, watched TV, used a computer, sent an e-mail, or used a smartphone. There were no x-rays, body scans, DNA tests, or transplants, and no one had taken an antibiotic; as a result, many would die young.
Mankind has enjoyed a wave of transformative innovation dating from the Industrial Revolution, continuing through the Golden Age of Invention in the late 19th century, and extending into today’s information revolution. This has given rise to entire new industries: electricity and power generation, automobiles, aerospace, airlines, telecommunications, oil and gas, pharmaceuticals and biotechnology, computers, information technology, and media and entertainment. Meanwhile, makers of horse-drawn carriages and wagons, canal boats, steam locomotives, candles, and matches have seen their industries decline. There have been profound changes in what is produced, how it is made, and the way in which people live and work.
Figure 10 shows the relative sizes of world equity markets at our starting date of end-1899 (left panel), and how they had changed by the start of 2020 (right panel). The right panel shows that the US market dominates its closest rival and today accounts for over 54% of total world equity market value. Japan (7.7%) is in second place, ahead of the UK (5.1%) in third place, and China (4.0%) in fourth position. France, Germany, Canada and Switzerland each represent around 3% of the global market. Australia occupies ninth position with 2.2%.
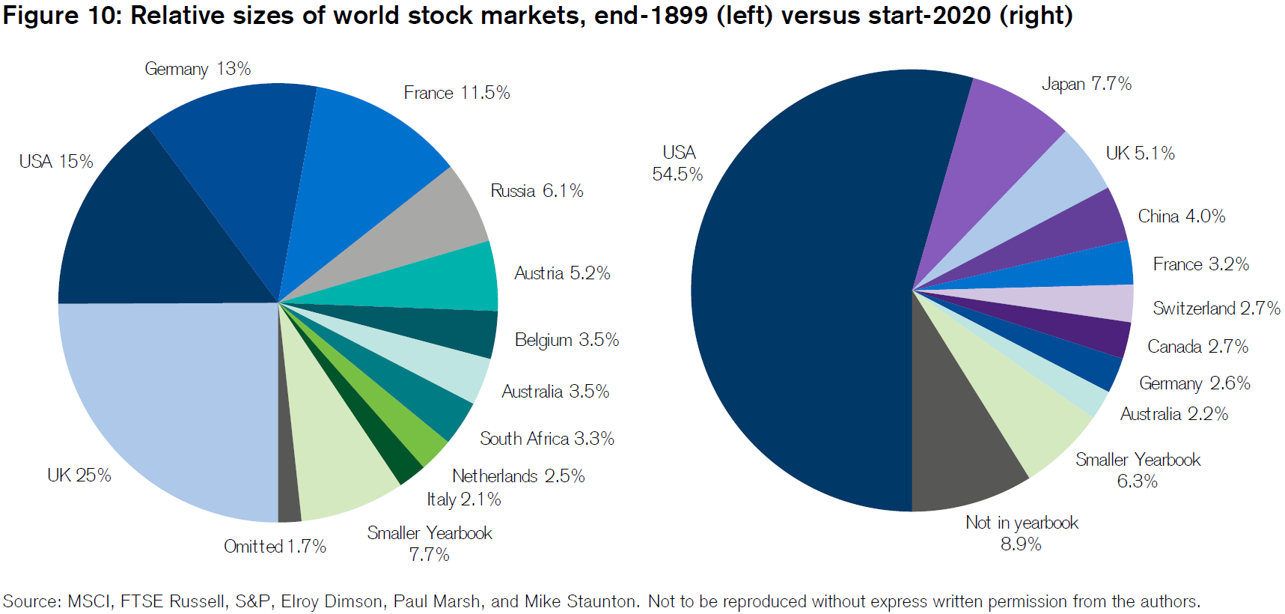
In the right panel, nine of the Yearbook countries – all those accounting for 2% or more of world market capitalization – are shown separately, with 14 smaller markets grouped together as “Smaller Yearbook.” The remaining area of the right-hand pie chart labelled “Not in Yearbook” represents countries comprising 8.9% of world capitalization, for which our data does not go all the way back to 1900. Mostly, they are emerging markets. Note that the right-hand panel of the pie-chart is based on the free-float market capitalizations of the countries in the FTSE All-World index, which spans the investable universe for a global investor. Emerging markets represent a higher proportion of the world total when measured using full-float weights, when inevitability criteria are relaxed, or if indexes are GDP-weighted.
The left panel shows the equivalent breakdown at the end of 1899 – the base date of the DMS database. The chart shows that, at the begin-ning of the 20th century, the UK equity market was the largest in the world, accounting for a quarter of world capitalization, and dominating even the US market (15%). Germany (13%) ranked in third place, followed by France, Russia, and Austria-Hungary. Countries that are not in our 1900–2019 dataset are again labelled “Not in Yearbook.” In total, the DMS database covered over 98% of the global equity market at the start of our period in 1900. By the end of 2019, our 23 countries still represented over 91% of the investable universe. of course, while investors in some countries were lucky, others suffered financial disaster or dreadful returns.
If unsuccessful or non-surviving countries are omitted, there is a danger of overstating world-wide equity returns. In 2013, we therefore added Russia and China to our database – the two best known cases of markets that failed to survive. China was a small market in 1900 and even in 1949, but Russia accounted for some 6% of world market capitalization at end-1899. Similarly, we also added Austria-Hungary, which had a 5% weighting in the end-1899 world index. While Austria-Hungary was not a total investment disaster, it was the worst-performing equity market and the second worst-performing bond market of our 21 countries with continuous investment histories. Adding Austria, China, and Russia to our database and the world index was important in eliminating non-survivorship and “unsuccess” bias. In 2014, we added another “unsuccessful” market, Portugal, to our dataset.
New industries
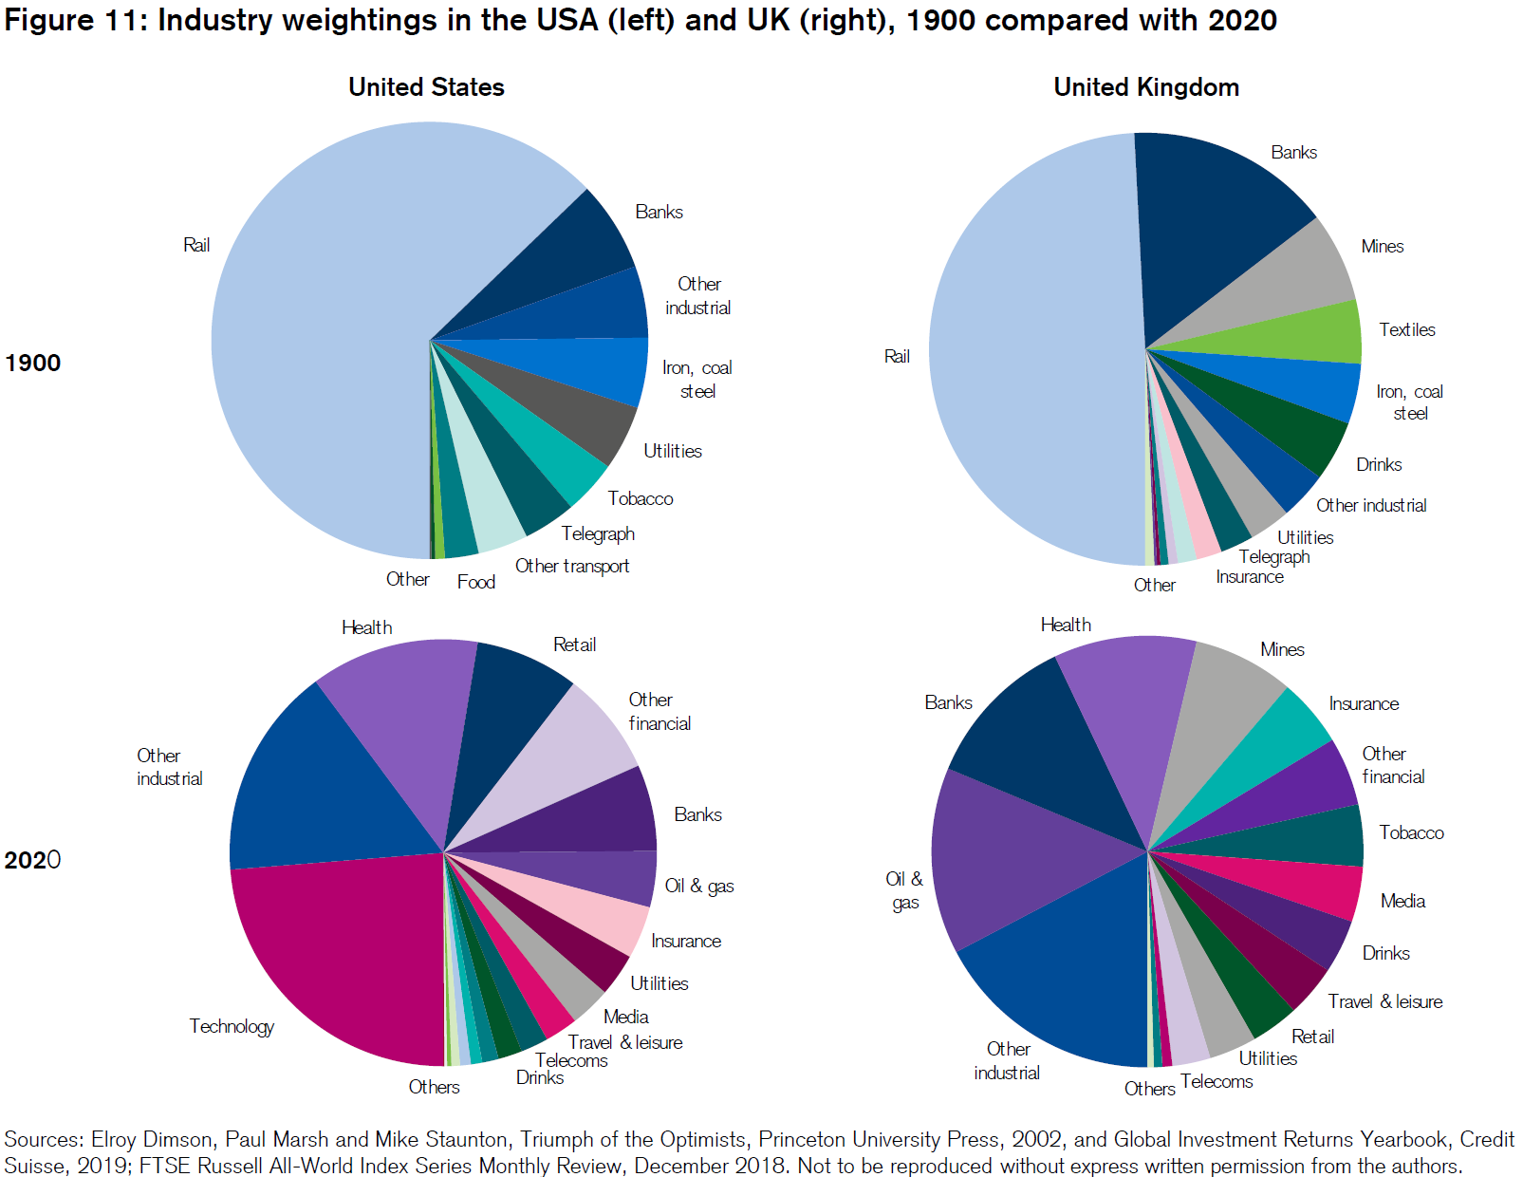
The changing country composition of the global equity market has been accompanied by evolution in the industrial composition of the market. Figure 11 shows the composition of listed companies in the USA and the UK. The upper two charts show the position at start-1900, while the lower two show start-2020. Markets at the start of the 20th century were dominated by railroads, which accounted for 63% of US stock market value and almost 50% of UK value. Over a century later, railroads declined almost to the point of stock market extinction, representing under 1% of the US market and close to zero in the UK.
Of the US firms listed in 1900, over 80% of their value was in industries that are today small or extinct; the UK figure is 65%. Beside railroads, other industries that have declined precipitously are textiles, iron, coal, and steel. These industries have moved to lower-cost locations in the emerging world. Yet there are also similarities between 1900 and 2020. The banking and insurance sectors continue to be important. Industries such as food, beverages (including alcohol), tobacco, and utilities were present in 1900 and survive today. And, in the UK, quoted mining companies were important in 1900 just as they are in London today.
Even industries that initially seem similar have often altered radically. For example, compare telegraphy in 1900 with smartphones in 2020. Both were high-tech at the time. Or contrast other transport in 1900 – shipping lines, trams, and docks – with their modern counterparts, airlines, buses, and trucking. Similarly, within industrials, the 1900 list of companies includes the world’s then-largest candle maker and the world’s largest manufacturer of matches.
Another aspect that stands out in the pie-chart is the high proportion of today’s companies that come from industries that were small or non-existent in 1900, 63% by value for the USA and 44% for the UK. The largest industries in 2020 are technology (in the USA, but not the UK), oil and gas, banking, healthcare, the catch-all group of other industrials, mining (for the UK, but not the USA), telecommunications, insurance, and retail. Of these, oil and gas, technology, and healthcare (including pharmaceuticals and biotechnology) were almost totally absent in 1900. Telecoms and media, at least as we know them now, are also new industries.
Our analysis relates to exchange-listed businesses. Some industries existed throughout the period but were not always listed. For example, there were many retailers in 1900, but apart from the major department stores, these were often small, local outlets rather than national and global retail chains like Walmart or Tesco, or online global giant, Amazon. Similarly, in 1900, more manufacturing firms were family owned and unlisted. In the UK and other countries, nationalization has also caused entire industries – railroads, utilities, telecoms, steel, airlines, and airports – to be delisted, often to be re-privatized later. We included listed railroads, for example, while omitting highways that remain largely state-owned. The evolving composition of the corporate sector highlights the importance of avoiding survivorship bias within a stock market index, as well as across indexes (see Dimson, Marsh and Staunton, 2002).
In the 2015 Yearbook, we asked whether investors should focus on new industries – the emerging industries – and shun the old, declining sectors. We showed that both new and old industries can reward as well as disappoint. It depends on whether stock prices correctly embed expectations. For example, we noted that, in stock market terms, railroads were the ultimate declining industry in the USA in the period since 1900. Yet, over the last 120 years, railroad stocks beat the US market, and outperformed both trucking stocks and airlines since these industries emerged in the 1920s and 1930s.
Indeed, the research in the 2015 Yearbook indicated that, if anything, investors may have placed too high an initial value on new technologies, overvaluing the new, and undervaluing the old. We showed that an industry value rotation strategy helped lean against this tendency and had generated superior returns.
This was an extract from Summary Edition of the Credit Suisse Global Investment Returns Yearbook 2020, which you can download by clicking the link below.
Never miss an update
Enjoy this wire? Hit the ‘like’ button to let us know.
Stay up to date with my current content by
following me below and you’ll be notified every time I post a wire
Livewire Exclusive brings you exclusive content from a wide range of leading fund managers and investment professionals.
1 contributor mentioned
Livewire Markets
Livewire Exclusive brings you exclusive content from a wide range of leading fund managers and investment professionals.
Expertise
Livewire Markets
Livewire Exclusive brings you exclusive content from a wide range of leading fund managers and investment professionals.
Expertise
Comments
Comments
Sign In or Join Free to comment