The Upcoming Lost Decade

Weimin Xie
MX Capital
Deeply embedded human behaviours will ensure that everything in finance will always be cyclical. After a sustained period of good times, the cycle is turning, and investors should prepare for the bad times. Get ready for the upcoming lost decade.
Long-term equity returns have been great ...
Everyone has seen the following chart before, which demonstrates a nice steady trajectory from lower-left to upper-right. This neatly demonstrates how equity markets provide the best long-term return, and (thanks to a log scale on the vertical axis), the 1930 depression is barely a blip, and the 1987 crash hardly noticeable.
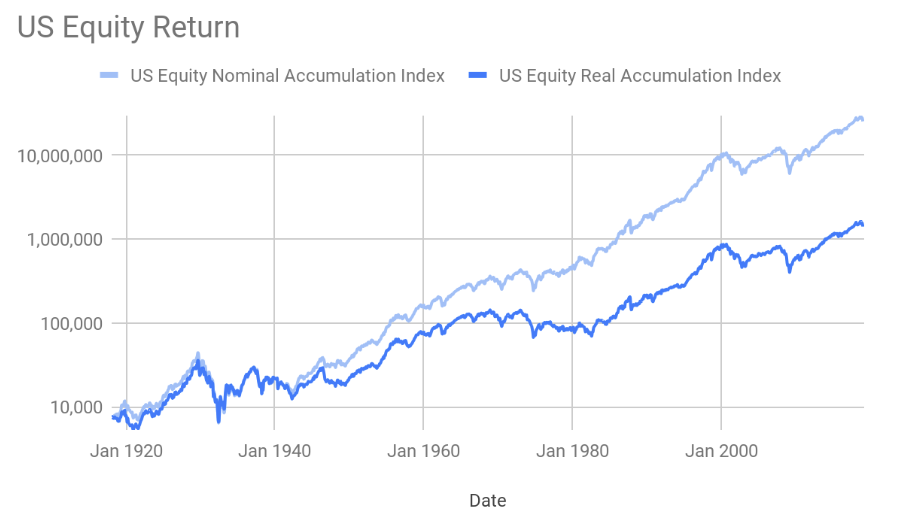
Source: MX Capital, FactSet, US Bureau of Labour Statistics
Australia has a similar return profile. Note that the chart is rebased to $100,000 on 31 August 1976, the date the Vanguard 500 Index Fund (VFINX) started. If an investor hypothetically invested $100,000 on the inception date of the best known passive fund, and a similar product for Australia was in existence, it would have returned close to 15 times its original capital in real term (inflation-adjusted basis).
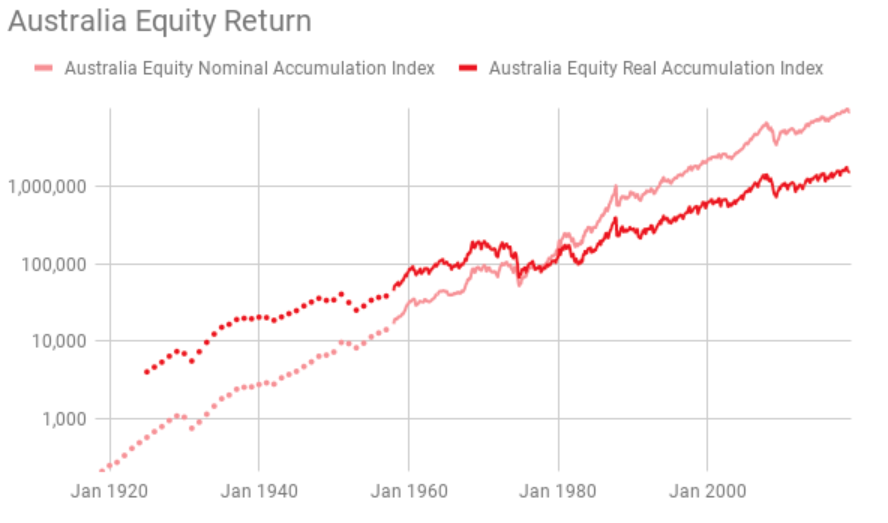
Source: MX Capital, FactSet, The Reserve Bank of Australia, marketindex
But it looks different through a different lens ...
Now let’s introduce some multidisciplinary thinking as championed by Charlie Munger, Warren Buffet’s long-term business partner.
In physics, the Theory of Relativity states that everything in the universe is relative to only one absolute constant, the speed of light.
If we change our lens to look at the financial world in the one constant, gold, what would happen?
Things don’t look quite so pretty...
The following chart is the US equity index expressed in gold. Both the price index and the accumulation index are charted. The price index can be seen as the capital value and the accumulation index the total return. For some investors, such as investors in retirement phase requiring income stream or endowment funds with annual expense liabilities, the price index is more relevant.
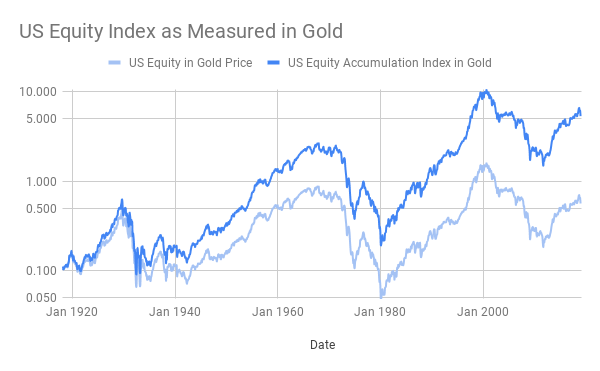
Source: MX Capital, FactSet, kitco, marketindex
The equity price index in gold (lighter blue) displays a multi-decade long cycle, however ultimately treads sideways over the past century.
There were three periods where the purchasing power of equity as measured in gold has gone nowhere: 1929 - 1958, 1967 - 1997, 2000 - 2018. For the three periods, the decline lasted for about 12 years on average, with the decline reaching 85-95% from peak to trough. It took the market about 29 years to fully recover the value of the principal investment. In fact, as of 2018, the price index of equity is similar to the 1961 level, and is only about 16% its level at the peak of 1929!
Characteristics of three lost decades based on price index only
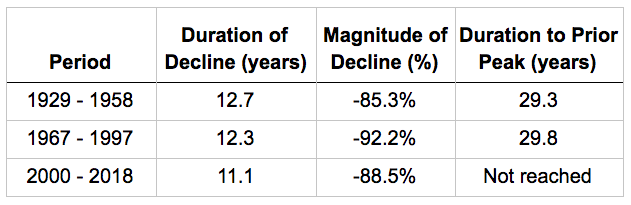
Source: MX Capital
Fortunately, the accumulation index did much better. As of 2018, we have about doubled the level in 1968, fantastic! Obviously, the increase in purchasing power is due to the compound interest of the dividends. Not capital appreciation.
By the way, for that 50 years, effectively, no dividends were paid out so you must have very kind grandparents who saved the money for you, and kind parents as they didn’t take the money away from you. Oh, and the Australian Taxation Office must be kind as well to not tax anything for 50 years across three generations!
If we look at the Australian experience, it is very similar to the US, except the 2000 tech boom and 2009 Global Financial Crisis which gave slightly different peak and troughs.
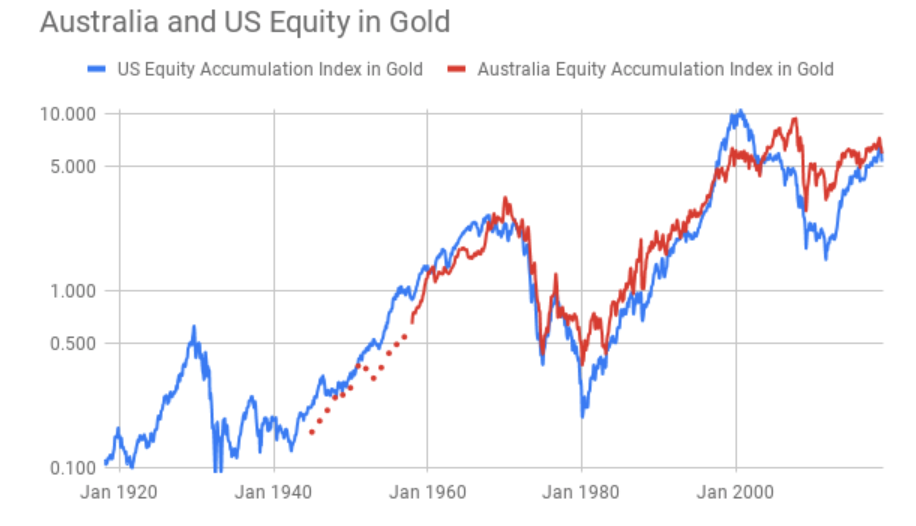
Source: MX Capital, FactSet, kitco, marketindex, The Reserve Bank of Australia
Why do we use gold price as the constant? Because it has shown to be the best store of purchasing power over centuries. Every fiat currency represents the credibility and trust of a government. Governments come and go, and trusts are lost more often than people can remember. (e.g. Argentina), because governments are managed by humans. Gold is the only money that has lasted the test of time and universally recognised by every government in the world, with key aspects of its attractiveness being its scarcity and the fact it is not issued by humans (take notice, bitcoin).
The other way to measure the loss of purchasing power is the Consumer Price Index. But it is not a constant measure. It has undergone numerous revisions to its definition and methodology driven by different thinking across many decades, by different governments. Remember, the Consumer Price Index is controlled by the government, it can be gamed to show inflation less severe than reality to allow better monetisation of government debt.
But gold does have its draw-back. While it is a stable measure of purchasing power over the long-term, it does fluctuate wildly over the short-term, mainly caused by panic and an expectation of an acceleration of future inflation.
In the following chart, we can see three periods of significant gold price increases, being 1930s (the Great Depression), 1970s (oil shock, post-war economic recovery and double-digit inflation), early 2000s (tech boom, single European currency and large US stimulus).
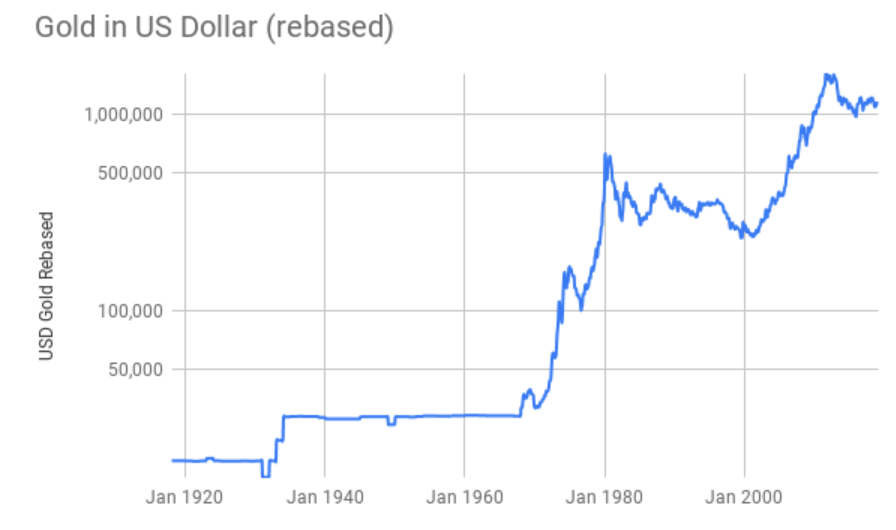
Source: MX Capital, FactSet, kitco, marketindex
With the benefit of hindsight, we could say those gold prices were irrational, bubble-like. But during those periods, the gold price represented the best estimation of future purchasing power of the fiat currency if the economic situation went out of control. Historically there were many failed cases, such as the Weimar Republic. In fact, in Roy Jastram’s seminal work “The Golden Constant”, the conclusion is that gold is a poor hedge of inflation. Gold, however, does hedge the eroding trust in governments, which is highly relevant in today’s world with high government debts.
And the interest rate cycle is not to blame ...
In the following chart, we have plotted the US equity accumulation index in real term denominated in the US dollar, alongside the gold equity index, and US nominal long-term interest rate. It is obvious that the current long-term interest rate cycle will move into the next phase, being an up cycle for the next few decades. One observation not well recognised is that both the equity indices are quite independent of the long-term interest rate cycle. During the post-war economic recovery, the interest rate cycle was in an upward trend and it did not impact the equity rally.
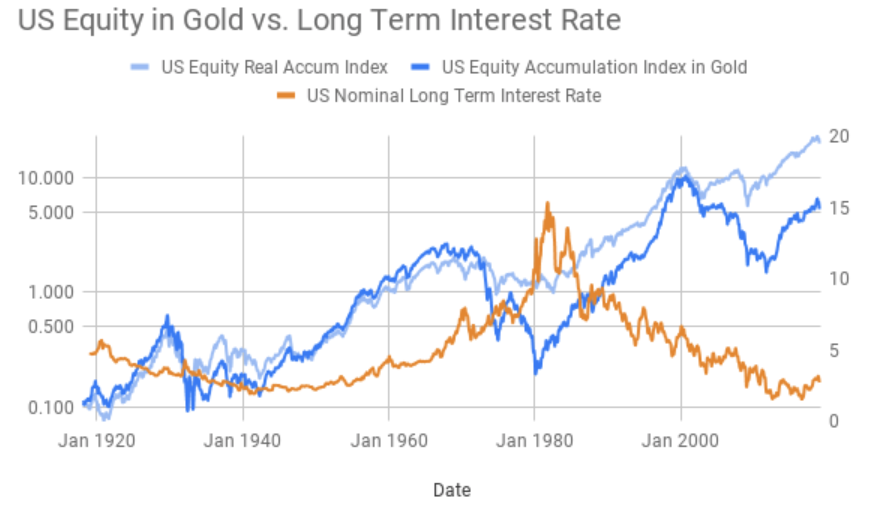
Source: MX Capital, FactSet, macrotrends, marketindex, kitco, US Bureau of Labour Statistics
The upcoming lost decade and what to do...
While forecasting the future is always difficult, it is entirely possible to envisage a scenario where the equity index expressed in gold would decline 80-90% for a decade. This Upcoming Lost Decade would wipe out a generation of investors. Equity could be seen as a fool’s game, a high-risk activity, as it has been recognised repeatedly in the past.
For MX Capital, we approach this potential scenario in three ways:
- We focus on picking stocks that can deliver a significant return on capital. If we can pick a good number of 10-baggers, we will be fine.
- Our investment horizon is the next 50 years, we may see this upcoming lost decade as a necessary evil to the following two decades of a magnificent bull market.
- Our investment mandate is broad and flexible. We have many toolkits to generate a return even in a declining market, such as by shorting the market, buying international equities or maybe eventually own some other asset classes as part of the asset allocation decision.
If you think buy-and-hold of a passive index fund is the sure way to wealth, think again. It may not benefit you... but at least your grandchildren will thank you!
--
Disclaimer: Information provided in this report is for general information purposes only. Nothing in this document should be construed as a recommendation by MX Capital or any associates of MX Capital. Past performance is not a reliable indicator of future performance. The information contained in this document is given in good faith and has been derived from sources believed to be reliable and accurate. However, MX Capital nor any of its employees, directors or associates gives any warranty of reliability or accuracy and shall not be liable for errors or omissions herein, or any loss or damage sustained by any person relying on such information, whatever the cause of loss or damage.
Never miss an update
Enjoy this wire? Hit the ‘like’ button to let us know.
Stay up to date with my current content by
following me below and you’ll be notified every time I post a wire
Weimin has more than 10 years direct experience in the Australian small to mid-cap equity market honed over 3 years with Ophir Asset Management as a portfolio manager, and 7 years with Kosmos Asset Management as an analyst.

1 topic
Weimin Xie
Chief Visionary Officer, Portfolio Manager
MX Capital
Weimin has more than 10 years direct experience in the Australian small to mid-cap equity market honed over 3 years with Ophir Asset Management as a portfolio manager, and 7 years with Kosmos Asset Management as an analyst.
Expertise
Weimin Xie
Chief Visionary Officer, Portfolio Manager
MX Capital
Weimin has more than 10 years direct experience in the Australian small to mid-cap equity market honed over 3 years with Ophir Asset Management as a portfolio manager, and 7 years with Kosmos Asset Management as an analyst.
Expertise
Comments
Comments
Sign In or Join Free to comment
most popular
Funds
The 5 best-performing super funds of the year
Livewire Markets
Equities
Buy Hold Sell: 5 ASX stayers built to go the distance
Livewire Markets