Unpicking sentiment and how we use it to invest

Sam Amora
AMP Capital
Sentiment describes overall investor attitude and the consensus opinion towards a market or stock. It might seem a little vague, and yet used correctly, it is a powerful tool for deciding whether to buy or sell. In fact, it’s one of the five different investment drivers, along with valuations, cycle, liquidity and technicals, that AMP Capital’s Dynamic Markets team use to assess market opportunities.
A core part of our investment philosophy is to buy assets that are undervalued, unloved, or oversold; and sell assets that are overvalued, overloved, and overbought. Sentiment analysis helps us work out which side of the fence assets may sit so that we can act in a contrarian manner.
FOMO
Sentiment is typically described as being either bullish or bearish. It is a major driver of markets, particularly when investor expectations rapidly converge, and herd mentality takes over.
Fear of missing out, or ‘FOMO’, as it’s known, is a popular acronym that has only entered the lexicon in recent times. Its underlying meaning though, has been around through the ages and quite succinctly sums up how investor sentiment can impact markets.
In the 1630s it was tulips. The price of bulbs rose 20-fold in one month and then soon became unsaleable despite the Dutch government stepping in to offer a base price. More recently Bitcoin rose nearly 350 per cent in under three months and then lost most of those gains over the next couple months.
Emotional Investors
The illustration below represents the investor sentiment cycle and shows the rollercoaster of investor emotions.
Investors can get caught up in this rollercoaster, and as markets become overvalued, they believe markets will not stop rising and it is a good time to buy - and vice versa - when markets are falling and become extremely undervalued, they want to sell as they think it will never recover.
This reflects a herd mentality and crowd psychology driven by investors’ focus on the short term and results in sub-optimal ‘buy high, sell low’ outcomes.
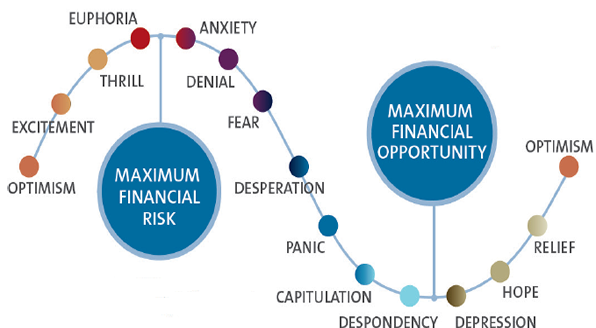
Source: AMP Capital.
We look at sentiment in a contrarian manner. For example, when investors are too bullish and overconfident, that is a warning sign, and can indicate the time to reduce exposure to growth assets. And vice versa, when investors are excessively pessimistic, that represents a positive signal in the process that indicates there could be a buying opportunity.
Whilst these actions may go against one’s natural instinct to follow the crowd, studies have shown that sentiment extremes can precede turning points and indicate that there is little buying power to continue to push prices higher or that there are no more sellers left at market bottoms. This principle brings to mind a famous quote from Warren Buffett, “be greedy when others are fearful and be fearful when others are greedy.”
Measuring Sentiment
There are two main ways that we assess sentiment through investors’ views and their actions. An important consideration in utilising sentiment data is the timeliness and frequency of the data, particularly regarding investor surveys. If the data is substantially lagged, it will not be effective in identifying sentiment extremes at the time, but only in hindsight.
Investor Surveys
There are a number of regular surveys that provide an assessment of various investors and industry stakeholders’ opinion of the market and how bullish or bearish they are.
An example is the widely-followed AAII sentiment survey which has been around for more than 30 years and assesses retail investors’ 6-month forward-looking view of markets and the ratio of bullish to bearish views.
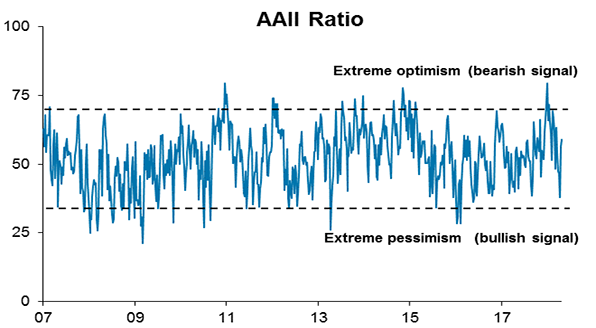
Source: AAII, Bloomberg, AMP Capital. As at April 2018.
Market Indicators
Market indicators of sentiment analyse investors’ actions through tools such as implied volatility, the put/call ratio, the level of short selling and insider buying, the level of ETF inflows/outflows, speculative positioning in various futures contracts or whether fund managers are overweight or underweight a particular market.
VIX is a popular example of a sentiment market indicator which looks at investors’ expectations of future market volatility based on options trading. Generally, when markets are advancing, VIX is low which indicates a level of investor complacency, and vice versa, when markets are falling or bottoming, VIX tends to be high, reflecting investor fear and anxiety.
Use the force
We have constructed composite models based on a combination of the aforementioned investor surveys and market indicators to analyse market sentiment.
Continuing innovations and data availability continue to make sentiment more and more measurable, such as Google Trends analysing how much something is being searched, or Twitter analysis showing what’s currently trending. These innovations could be integrated into our process in the future once there is a longer historical data series, but for now, they can provide additional insight to confirm or refute what the investor surveys and market indicators are showing.
Key signals we look for are when individual sentiment indicators reach optimistic or pessimistic extremes. The signal is even more impactful when the composite of different sentiment indicators across both investor surveys and market indicators indicate an extreme as this implies broad consensus and provides investment teams with strong conviction.
As a standalone driver, we have found that extreme bearishness tends to be more short-lived relative to extreme bullishness where euphoria surrounding market bubbles can persist for a while.
It is not a simple or easy task to identify market tops and bottoms even for professional investors, which is why sentiment indicators should be used in conjunction with other valuation methods and technical indicators to provide confirmation. Doing so can help improve the timing of investment decisions and assist with managing risk.
As part of a holistic investment process, our team believes that sentiment can provide good contrarian signals at extremes, leading to the identification of potential investment opportunities, more informed decision making and represent an important source of value add.
Never miss an update
Enjoy this wire? Hit the ‘like’ button to let us know.
Stay up to date with my current content by
following me below and you’ll be notified every time I post a wire
Sam was appointed to his current position in August 2012. He focuses on portfolio management and investment analysis supporting AMP Capital’s asset allocation capability and products, with a particular focus on the Dynamic Markets Fund

1 topic
Sam Amora
Investment Strategist / Associate Portfolio Manager
AMP Capital
Sam was appointed to his current position in August 2012. He focuses on portfolio management and investment analysis supporting AMP Capital’s asset allocation capability and products, with a particular focus on the Dynamic Markets Fund
Expertise
Comments
Comments
Sign In or Join Free to comment