Value beyond the obvious winners
2023: A stockpicker’s nightmare
Last year the title of our Investment Forum presentation was “Trading places: stockmarket boom to stockpicker’s paradise”. In hindsight, that was wishful thinking! Far from being a favourable environment for active investors, the market’s concentration in the ‘Magnificent 7’ (Apple, Microsoft, Alphabet, Amazon, Meta, Tesla and Nvidia) made the MSCI All Country World Index (World Index) very hard to beat in 2023. These seven companies alone accounted for almost 70% of the S&P 500’s gains last year, and the better they did, the bigger they got, and the more they contributed to index returns. So, investors who stuck with index trackers and passive funds enjoyed a fantastic year. Unfortunately, the same could not be said for investors who had little exposure to these headline-grabbing tech giants.
But…Orbis Global quietly outperformed
In the year to 30 April 2024, the Orbis Global Equity Fund (Orbis Global) returned 24.4% in AUD terms – about 4.6 percentage points ahead of the World Index’s return. Two things matter for our relative performance: what we own, and what we don’t. In the ‘what we own’ side of the ledger, our stock selections added almost 10 percentage points to relative returns. There wasn’t a single theme or driver here – just a handful of idiosyncratic investments panning out in our favour, without any major losers. On the flip side, except for a position in Alphabet (NASDAQ: GOOGL), which was established in 2022 when tech stocks were selling off, not owning the ‘Magnificent 7’ companies in Orbis Global detracted just over 2 percentage points from relative returns.
Currency fluctuations also detracted about 2 percentage points from relative returns, the bulk of this from being underweight to the US dollar and overweight the Japanese Yen. On reflection, the fact we still beat the World Index despite the headwinds from being underweight the Magnificent 7 has been quietly satisfying.
As long-term investors, our goal is to beat the World Index over time, but when we’re able to outperform by investing differently against the market, we add a diversification element that we think is valuable in the context of client portfolios.
Global stock markets are very concentrated
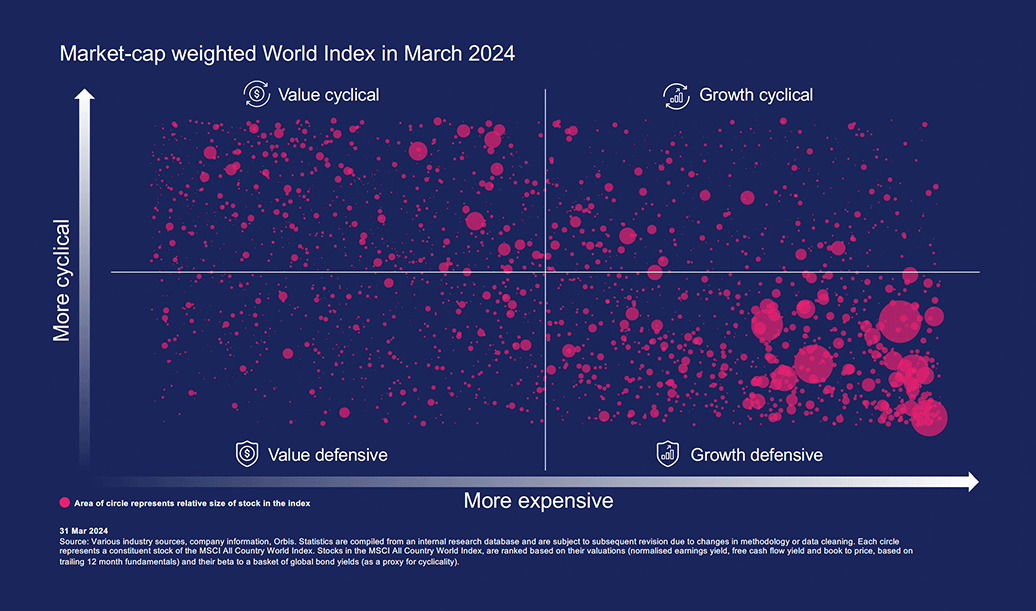
To properly examine the opportunity set we are observing today, and to reveal the true concentrations in markets, we have mapped companies according to their characteristics. The chart below plots the stocks in the World Index, with the size of each dot related to its size in the Index.
Cheaper stocks appear on the left, more expensive ones on the right, defensive stocks on the bottom, and more cyclical ones at the top. The map lets us break the total universe of stocks into four quadrants, which we’ve termed “Value defensive”, “Value cyclical”, “Growth cyclical”, and “Growth defensive”. In the top left quadrant (Value cyclical), for example, would sit an oil and gas company like Shell.
As illustrated in the chart, the market today is heavily concentrated in the bottom right-hand quadrant (Growth defensive). Interestingly, this pattern can also be observed in previous market environments associated with extreme valuations and asset bubbles. For example, at the peak of the Tech Bubble in 1999, 58% of the World Index was concentrated in the same growth defensive quadrant. At the peak of what some people called the ‘Everything Bubble’ in 2021, a good 43% of the market was also in this single quadrant. And today, the World Index has 60% in this quadrant. Furthermore, around 18% is invested in just 7 companies (‘Magnificent 7’), 32% in a single sector (Tech), and 64% in a single country and currency in the US. That’s hardly true diversification, and quite worrying for investors in passive and index funds who may not appreciate the full extent of their portfolio exposure.

Finding opportunity in the unloved
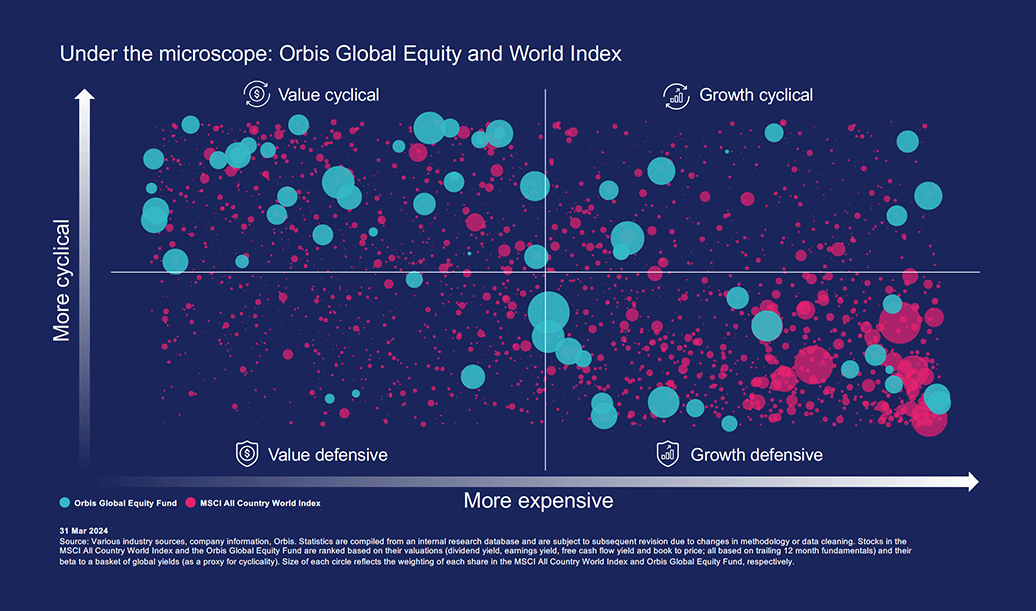
For those familiar with our style of investing, it should come as little surprise that Orbis Global looks quite different to the World Index. As is so often the case, when the market is rushing in one direction we are heading in the other, and this is most apparent at times of extremes. The blue dots in the graph below represent the positions in Orbis Global, with the size of each dot related to its size in the portfolio.

Compared with the World Index you’ll notice a lot fewer blue dots in the bottom-right quadrant (Growth defensive), and a lot more in the top-left quadrant (Value cyclical). And there’s a good reason we’re finding most of our opportunities in the other quadrants – the Growth defensive quadrant is generally expensive.
For investors seeking to properly diversify their portfolio, it is during these periods of extremes when it is most important to invest differently. That is why we are sticking to our investment philosophy of simply investing in a handful of companies that we truly understand, and that we believe are trading at a steep discount to what they’re worth, regardless of their sector or geography.
Whether it’s selected Korean banks trading at less than half their book value or overlooked US health insurers offering above-average returns on capital and long-term growth potential. The result is a portfolio that is very different to the World Index and trades at a near 50% discount*. This is wider than usual and speaks to the opportunities we are finding today.

*Based on the price/earnings metric for the next fiscal year, and in each case calculated first at the stock level, and then aggregated using a weighted median for the top-10 positions in Orbis Global and the MSCI All Country World Index.
7 stocks mentioned
1 fund mentioned

