What does low volatility mean for investors?
Over the past 12 months, a common headline in the financial pages has pointed to record low levels of volatility, as measured by the frequently quoted VIX volatility index. Yet for Australian equity investors, increasingly volatile share price movements in many stocks belies what the VIX is actually indicating - that headline volatility is at an all time low - a rather confusing situation.
This article seeks to explain how the VIX is measured and what IML believes it is telling investors about current sharemarket sentiment and complacency.
What is the VIX?
The VIX is often referred to by the media and some commentators as the ‘market fear’ index. It was launched by the Chicago Board Options Exchange (CBOE) in 1993.
Bob Whaley, creator of the VIX described it to Business Insider as follows: ‘Technically speaking, it is the expected volatility of the S&P 500 over the next 30 days. But the way I explain it, it is the price of insurance. If you were to own a house on the North Carolina coast or Florida coast and you hear the news of this hurricane coming, would you be willing to pay more for insurance?’
Given that the VIX is an index measuring the expected future stock market volatility over the ensuing 30 calendar days, where has the VIX traded in the past and where is it now?
As can be seen from chart 1 below the VIX itself can be a fairly volatile index. The VIX tends to spike when the S&P 500 index suffers a correction while it tends to trend downwards when markets are rising and investors are feeling confident about the market. During the peak of the Global Financial Crisis, the VIX spiked to over 80 on 27 October and 20 November of 2008 on an intraday basis.
As can also be seen from the chart below, the VIX has trended down significantly over the last 12 months and has been trading close to record levels of less than 10 for an extended period and is trading at 13 today.
Chart 1: behaviour of VIX since 1990 relatively to the S&P 500 index (SPX)
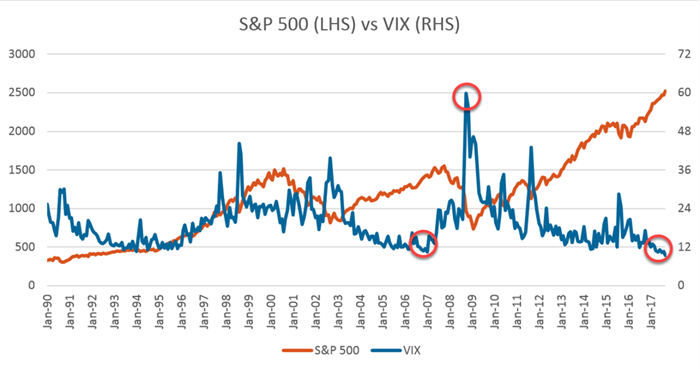
Source: Factset Date range: January 1990 – September 2017
The fact that the VIX is trading at record lows may come as a surprise to many investors who have recently seen the value of some of their individual stock holdings, such as CBA or BHP, move up or down significantly on a daily basis!
So why is it that the overall Index volatility as measured by the VIX is at record lows while individual companies’ share prices seem more volatile and unpredictable than ever?
Part of the explanation for the VIX being at record low levels is that the majority of large investors currently believe that record low interest rates worldwide will continue to support global sharemarkets for the foreseeable future, and that any correction will be short-lived while interest rates stay low. On the other hand, in the last 12 months, investors have seen the share prices of individual stocks move in an erratic manner. Thus CBA recently got heavily sold down on the Austrac money laundering allegations while BHP has spiked recently as it has followed the iron and oil price upwards.
So why are these wild swings happening in stock prices when the VIX is so low?
In our opinion one of the main reason why individual stocks are becoming ever increasingly volatile has been due to the rapid increase in the number of computer quant based funds and hedge funds that trade shares based on short-term news.
Chart 2 below shows the average daily volume of shares traded on the US stockmarket. The chart clearly shows that High Frequency Trading (HFT) Funds and Passive funds as shown by the red and orange blocks were virtually non-existent until 2003. Since then the amount of trading for HFT’s and Passive funds have grown exponentially so much so that they now account for almost 70% of the daily volume of trades in the US stockmarket.
Chart 2 shows the proportion of transactions made by Passive Funds and High Frequency Trades was over 50% of the volume in the US market in 2016.
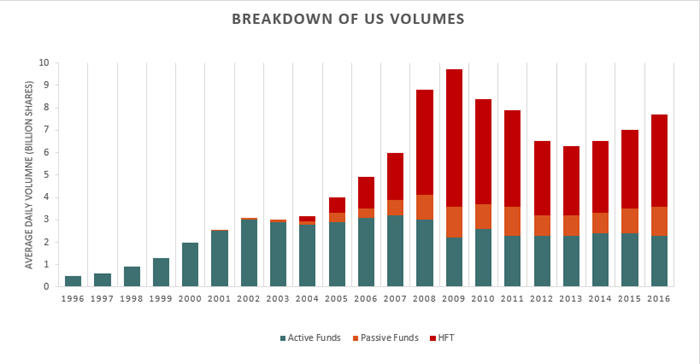
Source: Credit Suisse Date range: 1996-2016
We believe the situation is no different in Australia although it is harder to get a breakdown of the trading volumes in Australia.
Talking about the Australian sharemarket, Anton Tagliaferro, IMLs Investment Director recently told the Australian Financial Review:
"Over 50 per cent of the volume on a day-to-day basis is now done by people or things that don't know what they're buying or selling, they don't know what the underlying company does," he said. "Is this a cyclical thing? I think some of it is. The next correction will sort out the people who are holding good stocks at the right price and people who are just holding stocks because they're popular."
To demonstrate the impact of short-term computer driven quant and hedge funds we have used Ansell as an example. Ansell is a quality industrial company with relatively diverse and stable earnings that has paid a steady and growing yield over the last decade as shown in the chart below which shows Ansell’s earnings (the blue bar) and dividends (the red bar) over the last 10 years.
As can be seen in Chart 3 below, Ansell’s earnings and dividends have grown fairly steadily over the last 10 years although in the last two years stated earnings have declined as the tax rate increased from an abnormally low rate as tax losses ran out and due to a one-off restructuring of its medical glove manufacturing division. The underlying company and business continues to perform relatively well.
Chart 3: Ansell (ASX: ANN) earnings and dividends over the last ten years
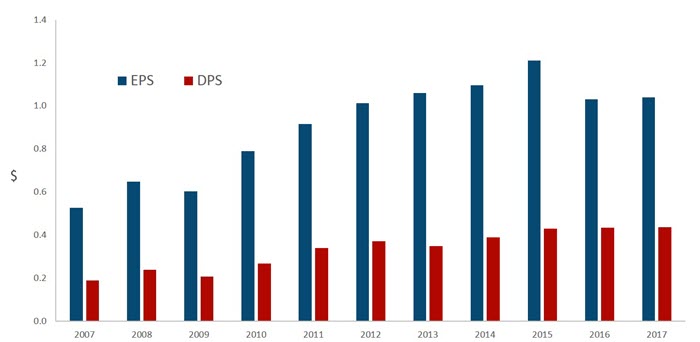
Source: IRESS Date: 01-Jul-2006 to 30-Jun-2017
However, one gets a very different picture when one looks at how Ansell’s stock price has traded over the last 12 months with swings up and down of around 20% being a fairly regular feature as seen below in Chart 4. These are fairly extraordinary share price moves for a company that generates relatively stable earnings from manufacturing industrial and medical gloves!
Chart 4: Ansell (ASX: ANN) share price movements over the past year
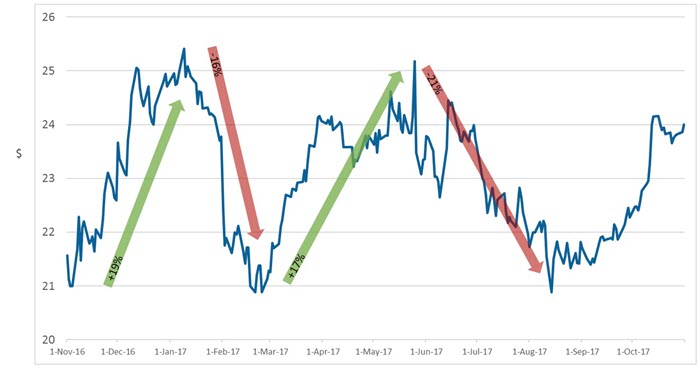
Source: IRESS Date: 01-Nov-2016 to 31-Oct-2017
On the 25th May 2017, Ansell announced the well flagged sale of the company’s sexual wellness division for a very good price – as a result the share spiked over 4% on that day as ‘event driven’ hedge funds and computer driven quant funds bought the shares. On the following day, Ansell’s shares dived almost 7% as earnings were revised downwards as broking analysts excluded the sexual wellness division’s earnings from the company’s consolidated earnings – this led quant funds and hedge funds into selling the shares!
It is quite clear that such trading activity is driven by computer-based short-term events analysis or hedge funds and is not based on any fundamental bottom-up research that takes a long-term view.
So despite a record low VIX, individual stocks are now being impacted by vast amounts of computer trading, quant hedge funds in the sharemarket today.
What is today’s record low VIX telling us about the sharemarket? Is it a good sign?
With the recently VIX at record lows of 10 we are facing fear’s opposite enemy: complacency. The VIX has been trading at its lowest levels seen in the last 10 years - in fact the lowest it’s been since March 2007 immediately before sub-prime mortgage crisis. This is signalling that most investors do not believe that a major sharemarket correction is imminent and that instead most are quite complacent about the risks and level of the sharemarket.
Table 1 below contains examples of what the VIX means:

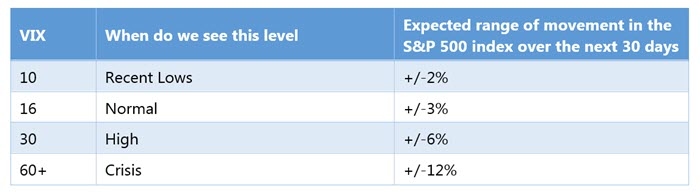
Although the VIX is trading near record low levels, this does not mean that an unexpected sharemarket correction cannot happen - as occurred in 2007 in the GFC shortly after the VIX was trading at a similarly very low level. In fact, the record low VIX is indicating a very high degree of complacency amongst most sharemarket investors - which may actually be more of a cause of concern than comfort!
The situation is paradoxical in that the low level of the “fear” index may also point to overvalued markets and the risk of a correction. Similar to the situation we saw in March 2007, during the Global Financial Crisis.
To quote Warren Buffet “Only when the tide goes out do you discover who’s been swimming naked”.
IML is a quality biased long-term value investor - we believe it is time for caution and simply buying into the current momentum in the Resource sector and ‘concept’ stocks is risky, especially given investor complacency as demonstrated by the record low VIX.
What can investors do to protect their equity investments?
There is no easy solution to protecting the value of your equity investments from any sharp short-term moves on the sharemarket. In fact, most investors realise that while equity markets can be very rewarding over the long-term, this can be at the expense of more short-term volatility than other asset classes such as property or bonds.
Similarly, IML’s Investment Director Anton Tagliaferro has often been quoted as saying “the sharemarket is a great medium for the patient and careful investor to grow their wealth slowly – but it is also a place for the impatient and reckless to lose money quickly.”
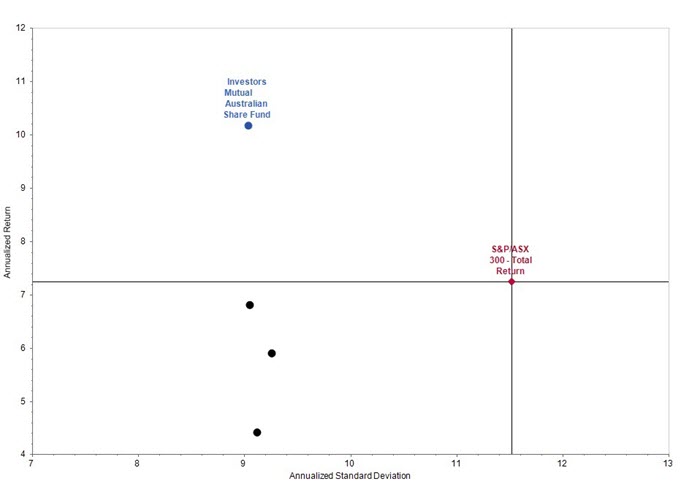
Chart 5: Risk-return outcomes: IML’s Australian Share Fund compared with the S&P/ASX 300
Source: Factset Dates: Since Inception: Jan-2011 – Sep-2017
At IML we focus on long-term investing and not speculating. We have lived through periods over the last 20 years where ‘concepts’ and momentum take hold of sharemarkets. IML’s long-term focus is evidenced by the favourable risk-return outcomes across all our funds (see Chart 5 above) and our focus on income as the most predictable form of return.
IML has found that the best protection from any short-term sharemarket is to always hold good quality stocks that are reasonably priced. Good quality stocks will always weather any market storms, and generally continue to grow their profits and dividends to their shareholders over the long-term.
There is no easy way for investors to time the markets – avoiding the noise and taking a long-term approach is always advised. When markets are complacent, and prices are being driven by speculation and short-term factors such as short-term earnings upgrades or downgrades, investors need to be cautious and not lose sight of their long-term objectives.
Never miss an update
Enjoy this wire? Hit the ‘like’ button to let us know.
Stay up to date with my current content by
following me below and you’ll be notified every time I post a wire
Investors Mutual Limited (IML) is a specialist Australian equities fund manager and was established in May 1998 by Anton Tagliaferro. Based in Sydney, the IML team applies a conservative value-based investment style with a long-term focus.

3 topics
1 stock mentioned

Investors Mutual Limited (IML) is a specialist Australian equities fund manager and was established in May 1998 by Anton Tagliaferro. Based in Sydney, the IML team applies a conservative value-based investment style with a long-term focus.
Expertise
Investors Mutual Limited (IML) is a specialist Australian equities fund manager and was established in May 1998 by Anton Tagliaferro. Based in Sydney, the IML team applies a conservative value-based investment style with a long-term focus.
Expertise
Comments
Comments
Sign In or Join Free to comment