What's driving the Aussie Dollar?
Historically the Aussie Dollar has been regarded as a play on both commodities (specifically iron ore) and its higher interest rates relative to the rest of the world. In the past 12 months, though, the correlations of the currency with those two key factors has broken down. As iron ore prices have more than doubled, the currency has largely trended sideways (i.e. after its initial rally in Q1 2016, fig 6). Equally despite the narrowing of the yield gap between the US & Australia, as the market has priced in increasing US rate hike expectations, the Aussie Dollar hasn’t sold off (i.e. as it typically would during that narrowing - fig 1). Unusually, therefore, neither of the two key currency drivers are determining the direction of the Aussie Dollar, as each appears to counterbalance the other. Therefore, the key to forecasting the direction of the Aussie Dollar is to understand which of those two factors will come to dominate the other.
Fig 1: AUD/USD futures vs AUS-US 2-year sovereign bond spread
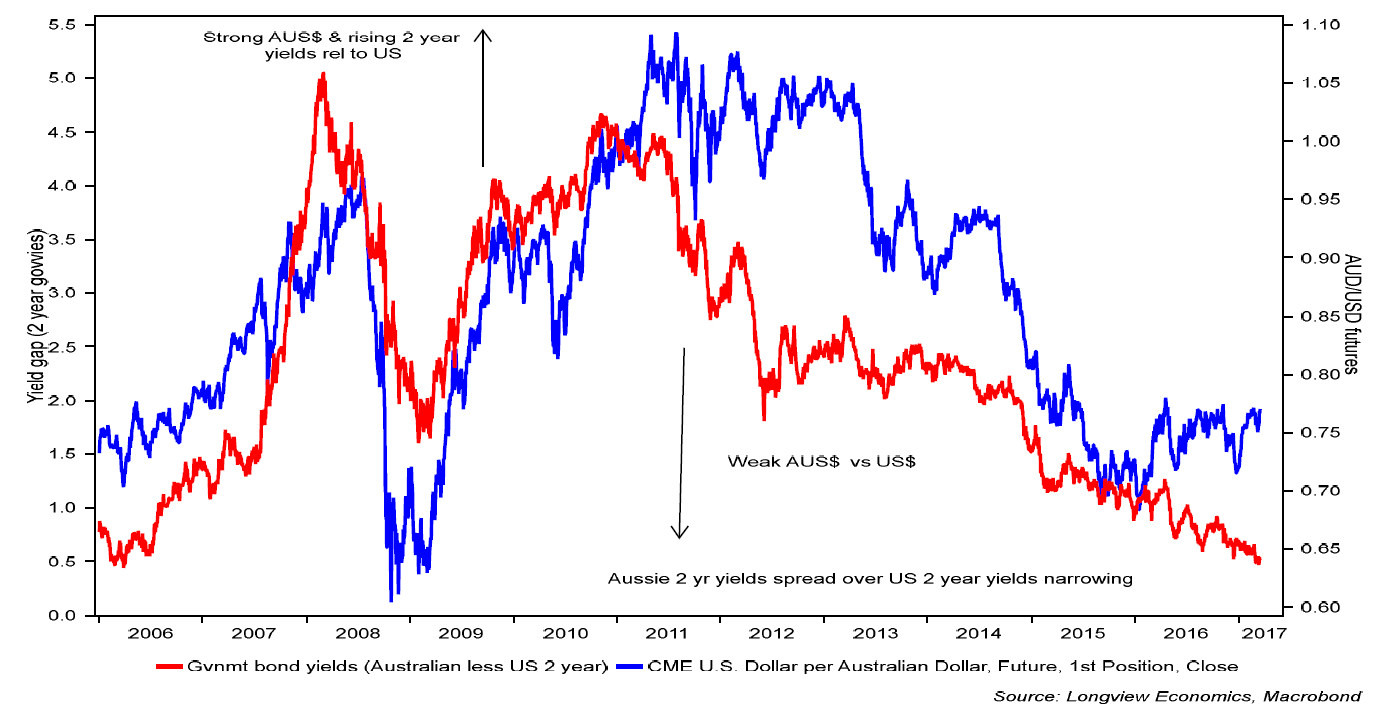
As we lay out below, our view is that the process of US rate normalisation has begun (reflecting the re-acceleration of US money velocity). That, in turn, will bring pressure upon Chinese growth and with that iron ore prices.
1) Fundamentals: The narrowing yield spread between Aussie and US government bonds reflects the strengthening fundamentals of the US economy relative to those of Australia. Australia has avoided a recession for 25 years as the commodities boom, and a continuous rise in household indebtedness and strong house price growth has underpinned economic growth (fig 3). Both the rising household indebtedness (& house prices) are dependent on ongoing cheap money. With an acceleration in US money velocity and a pick-up in growth prospects, though, the US is starting to lead global interest rates higher. As such the cheap money upon which key Australian economic drivers are reliant will come to an end.
Fig 2: AUD/USD: Net speculative LONG/SHORT positions vs spot exchange rate
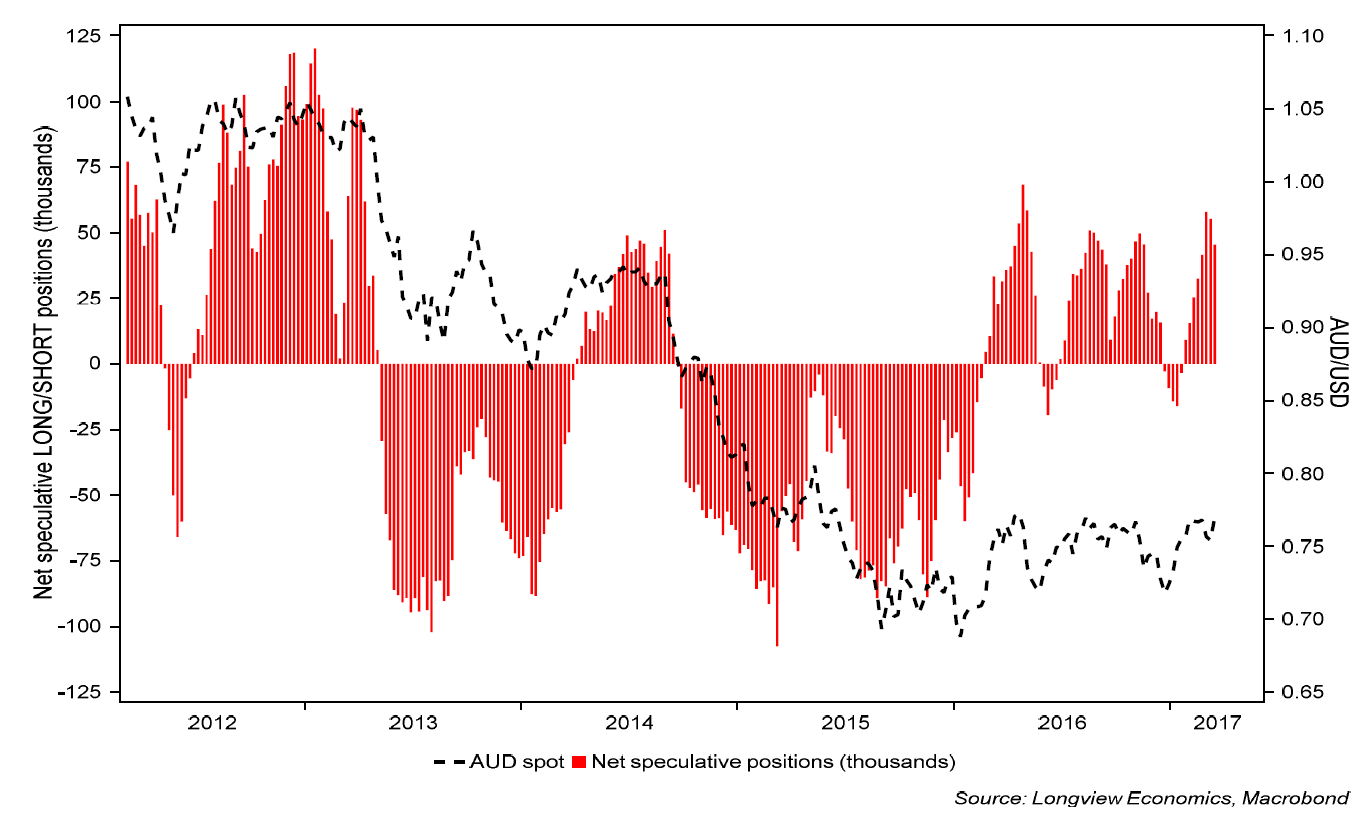
2) Net LONG positioning in the AUD remains elevated: Latest positioning data (as at 14 March 2017) shows that there remains a significant amount of net LONG contracts in the AUD (net positioning is in its 81st percentile relative to its own history since 1987, fig 2). That latest data, though, does not show any changes in positioning since the ‘dovish hike’ by the Fed last week from which the AUD has rallied (and thus we expect net LONG positioning to have increased further). This is now, therefore, generating a contrarian SELL signal.
3) Longview medium term technical model is on SELL: Our medium term technical scoring system has just crossed onto SELL (fig 4). This model aggregates a number of technical indicators (RSI, MACD, momentum) and has recently generated effective SELL signals that have been followed by AUD weakness in the subsequent months.
4) AUD/USD is at a key resistance level: The currency pair was unable to break 0.78 at its highs in November and has struggled again on recent attempts. A tight trading range has formed between its resistance line and its 200-day moving average acting as support (fig 6). We expect it to fail to meaningfully break its resistance and see a move below its 200-day moving average in the coming months.
Fig 3: Aussie household debt to income ratio vs 8 capital cities house prices (rebased to 100)
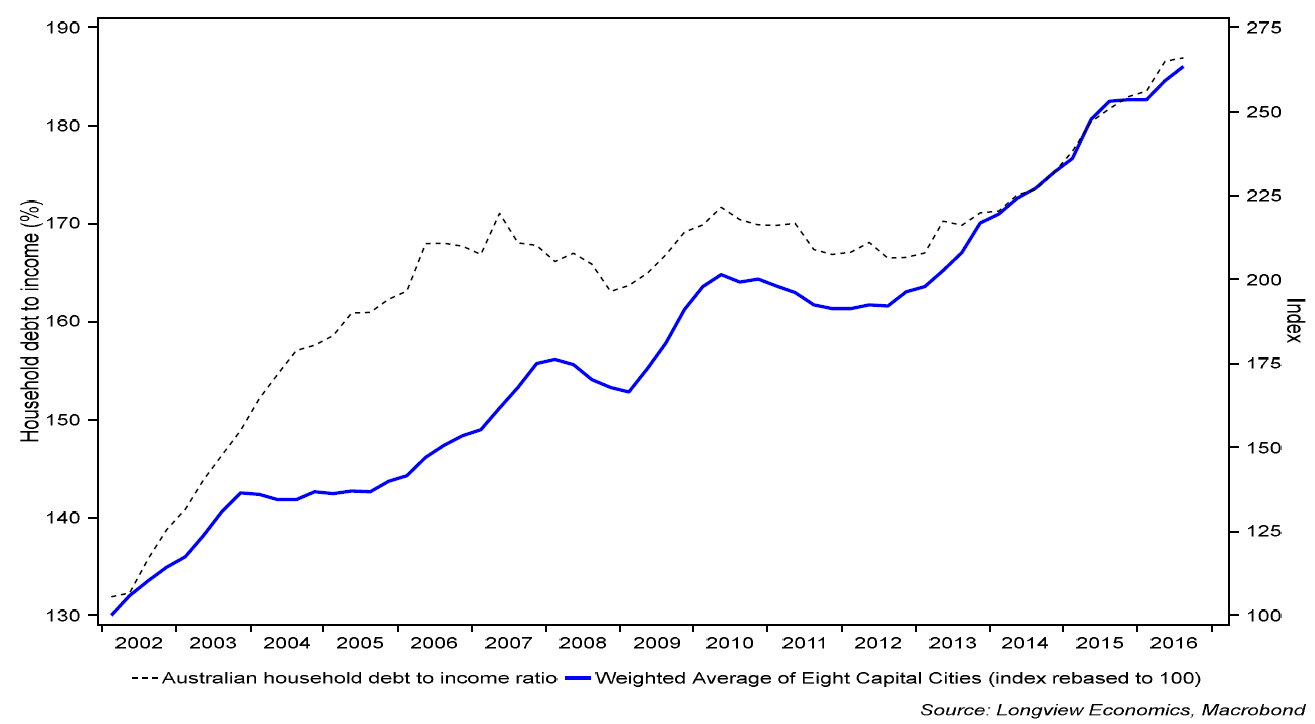
Fig 4: Longview AUD medium term technical scoring system vs AUS$-US$ spot exchange rate
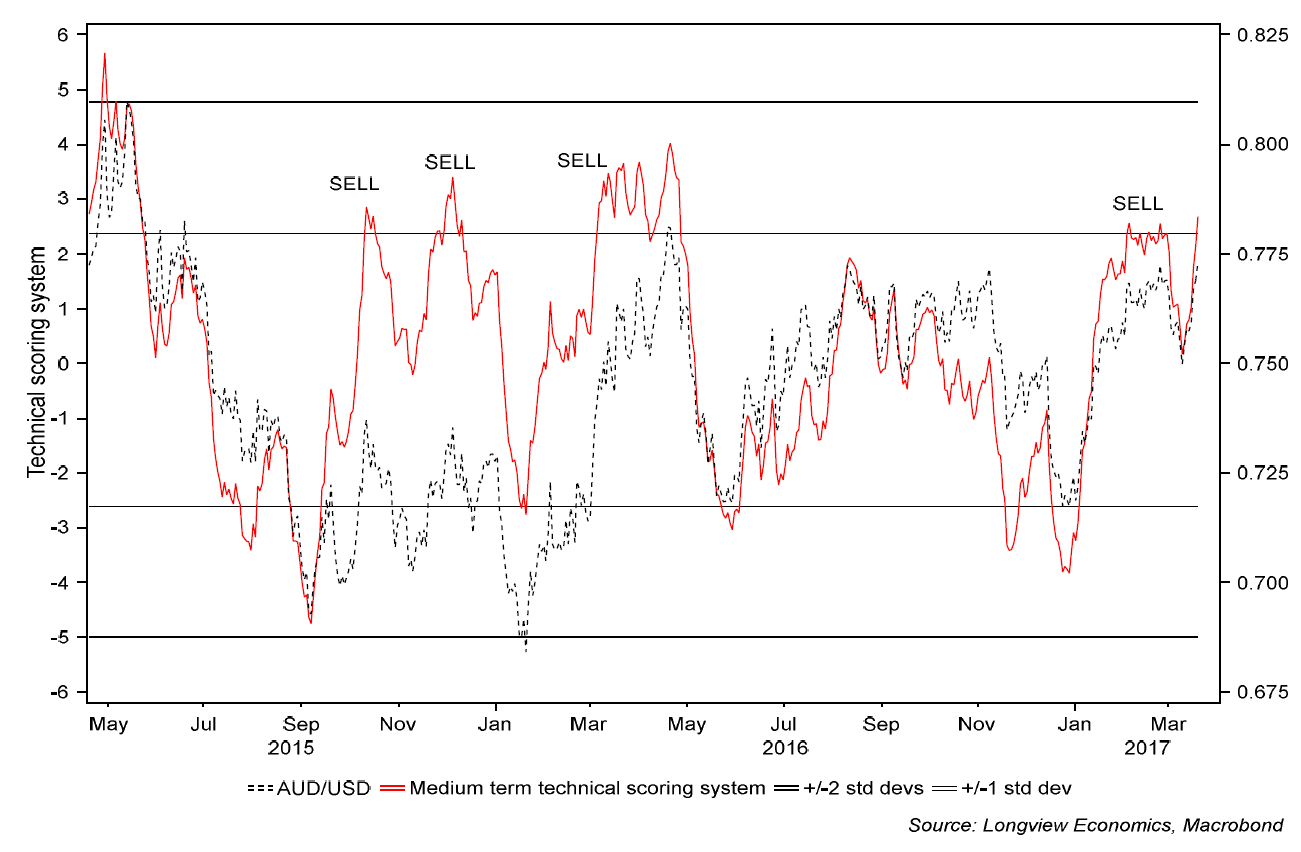
Fig 5: AUD/USD futures candlestick shown with stop and resistance (& key moving averages)
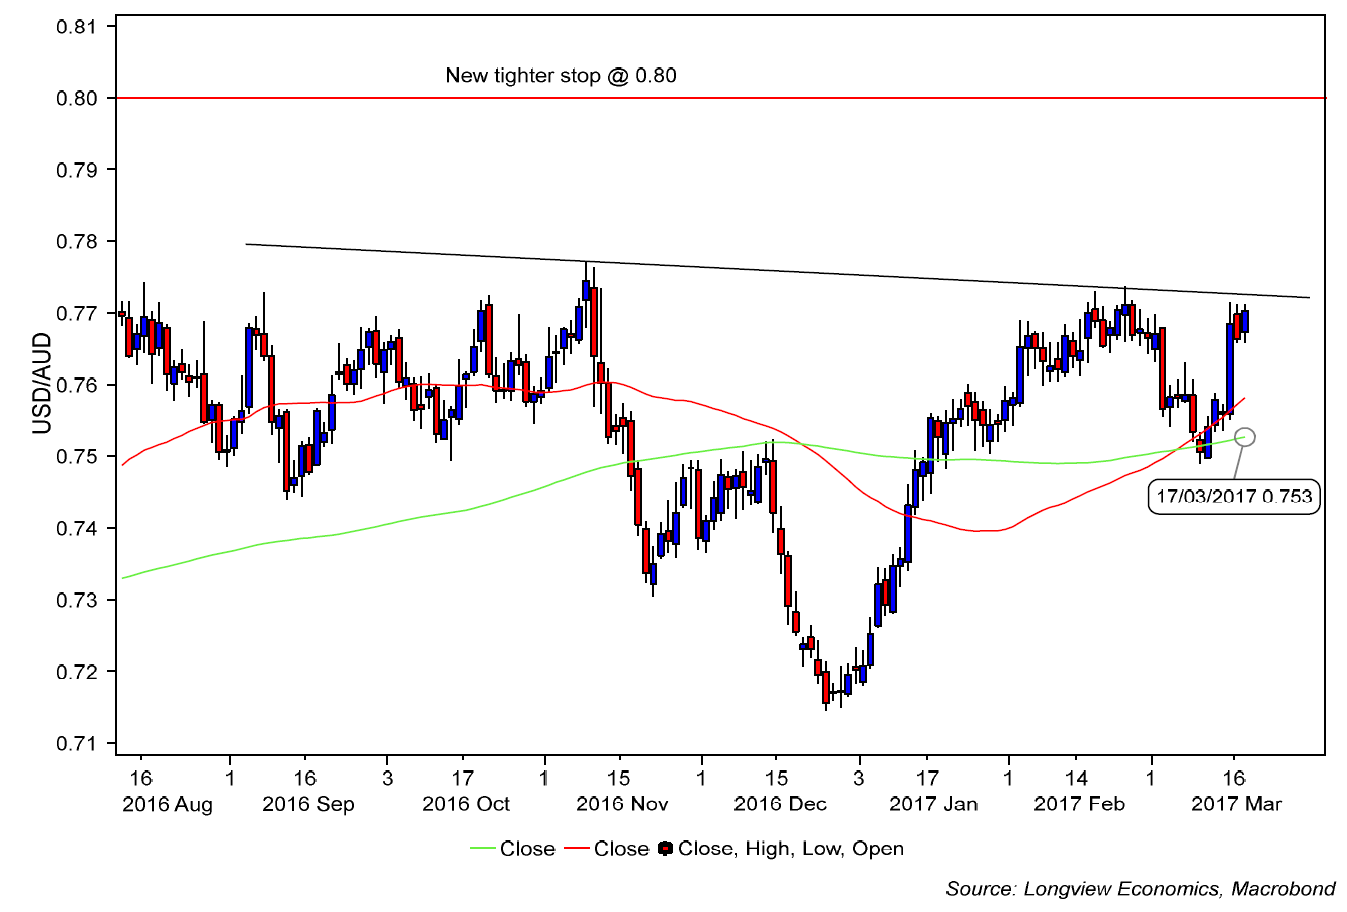
Fig 6: AUD/USD vs iron ore price (US$/ton)

Originally published on 20th of March.
Never miss an update
Enjoy this wire? Hit the ‘like’ button to let us know.
Stay up to date with my current content by
following me below and you’ll be notified every time I post a wire
Longview Economics, founded in 2003 by Chris Watling, is an independent research house based in London, providing three distinct yet interrelated groups of research products: Short and medium term market timing; Long term global asset allocation advice; and Global thematic, macro and commodities research.

2 topics

Longview Economics, founded in 2003 by Chris Watling, is an independent research house based in London, providing three distinct yet interrelated groups of research products: Short and medium term market timing; Long term global asset allocation...
Expertise
Longview Economics, founded in 2003 by Chris Watling, is an independent research house based in London, providing three distinct yet interrelated groups of research products: Short and medium term market timing; Long term global asset allocation...
Expertise
Comments
Comments
Sign In or Join Free to comment