Why its time to rotate to emerging markets Value
Equity markets are currently at all-time highs. This has generated returns that, we believe, are unlikely to continue, so we need to think about where returns are likely to come from over the next 10 years. Further, we need to think about how investors can position themselves to take advantage of this. This note highlights why emerging markets (EM) Value looks to be a market segment that appears – relatively speaking – to be attractive.
To support this conclusion, we see below that:
- Valuations are currently more stretched in Developed Markets (DM) than in EM.
- Many DM markets are either at or close to their all-time historic highs (US large and small-caps).
- Forecasts point to EM markets outperforming DM over the next 10 years, with the forecast for EM of an average between 6-9% compared to 4-6 % for global developed funds
- Value as a style, although having rebounded recently, is still undervalued compared to other investment styles of Growth, Quality and Momentum. This is likely to be partly driven by the broader macro expectations of improving economic outlooks as economies reopen and vaccines are rolled out.
Equity markets
Equity markets are at all-time highs. Looking at historical 10-year Australian dollar returns to 30 April 2021, we can see that Developed and All World equities have strongly outperformed all other asset classes over the last ten years including emerging market equities. MSCI World returned 13.8% p.a. over the period versus 7.3% for MSCI Emerging Markets and 8.0% for MSCI Australia. Within global markets, the US (which makes up approximately 60% of the broad global indices) has led, returning approximately 18.5% p.a. in AUD for S&P 500 and 16.1% p.a. in AUD for MSCI USA Small Cap.
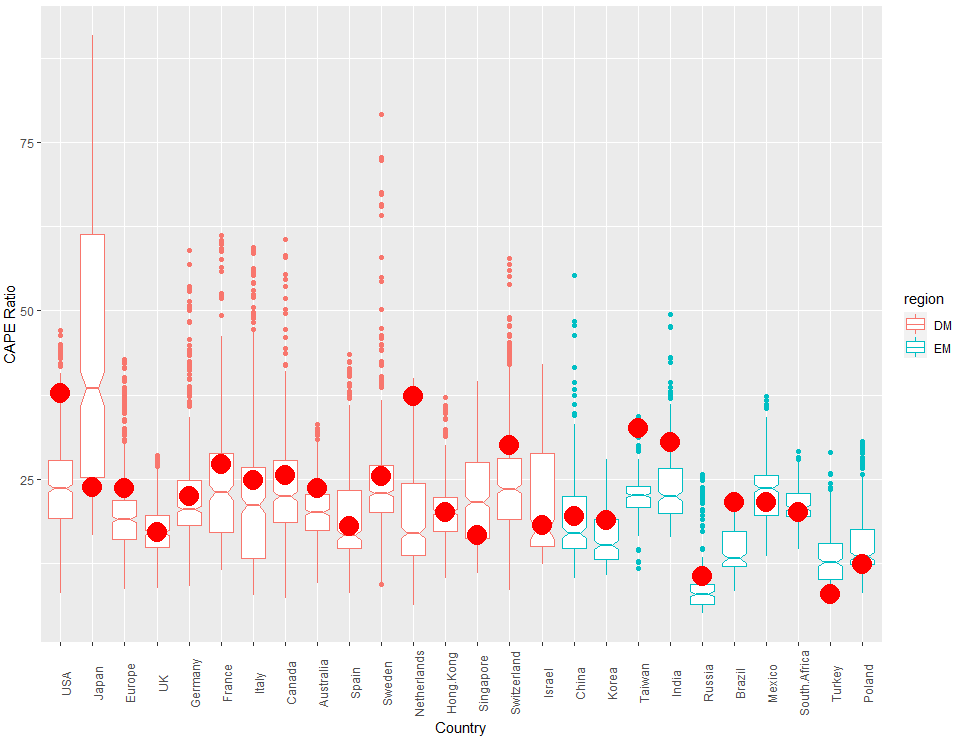
Reflecting the strong performance of global markets we see valuations across equities (as measured by the CAPE ratio) towards the higher end of their historical levels. This is most notable within the Global Developed markets. If we look at the country level, the USA and the Netherlands are close to historical highs, with many of the other developed markets close to or above their historical 75% percentile.
CAPE Ratio across both DM and EM countries

Source: Barclays Bank Plc as at 31 May 2021
EMs are also at relatively high levels compared to their historical valuations. However, this is mainly being driven by Taiwan (which makes up approximately 14% of the index) and to some extent India with many other EM countries e.g. Turkey and Poland being at the bottom end of their historical valuations, and other large index constituents just above their long term average.
Given the strong returns that have been experienced and the current valuations, forward looking returns to most asset cases are expected to be more muted.
The chart below shows this. It looks at the long term expected returns and volatility to different asset classes (in AUD).
One of the standout asset classes in these forward expectations is EM Equity. We can see expectations for EM are close to double that for US large-caps over the next 10-15 years (7.2% vs 4.2%) with similar volatility levels.
Expected returns and volatility

Source: JPM Asset Management, Realindex as at 30 September 2020
Sharpe ratios paint a similar story, with the EM universe having the strongest Sharpe ratio with other Asian markets ex-Japan being the next highest. US Large caps are forecast to have the lowest Sharpe ratio.
Sharpe ratio by Region

Source: JPM Asset Management, Realindex as at 30 September 2020
When we look across investment houses, we see the same pattern presenting itself; forecasts of returns to EM markets being between 6-9% vs that forecast for developed markets of 4-6%.
Will any exposure in EM do?
Having identified EM as a potential market that looks to have some strong returns over the next 10 years, the question then becomes what is the best way to invest in this market? Do we want market cap index exposure or do we want a style tilt to the investment?
Investors generally consider a market cap index provides them with good broad exposure to the equity market. Within the EM market, this has historically been the case. But over the last 10 years with the growth of China and internet stocks, we have seen this become a more heavily concentrated index. If we look at the top four stocks within the index, they previously accounted for approximately 7-8% of the total index.
This has grown sharply from about 7% in 2011 to approximately 22% in 2021 - a threefold increase in the space of 10 years.
This has meant that the performance of the index is very much guided by the performance of these four stocks. The chart below shows the performance of the MSCI EM index and the MSCI EM index with these four stocks removed. We can see the strong difference that the performance of these four stocks have on the overall index and how much this small number of stocks can drive the overall index.
Impact of top four stocks within EM Universe

Source: MSCI, Realindex, data as at 30 April 2021
Unlike the MSCI EM index, the Realindex Emerging Markets Fund is an accounting weighted fund. This means that rather than choosing the members of the fund and their relative weights based on market caps, stocks are chosen and weighted based on accounting metrics. This results in a value tilt via the nature of the accounting metrics chosen against the market cap index.
Further, due to the nature of its construction and the fact that weights are not driven by prices, it avoids the concentration issue that cap-weighted index funds currently have as its positions do not grow as prices grow. It still has a level of concentration, as do most indices, but the weight of the top four stocks in the Realindex Emerging Markets Fund has averaged around 12% over the last ten years and this level has been relatively consistent over time. These differences are more clearly seen in the chart below which looks at the percentage weight of the index from the top four stocks versus the Realindex Emerging Markets Fund.
Evolution of the top 4 stocks in the universe

Source: MSCI, Realindex, data as at 30 April 2021
Why value in EM? – Because it is relatively cheap and still has room to move
Across regions and globally, value has significantly underperformed growth. The two charts below show the rolling three-year average of value minus growth in both DM and EM. While value had good performance in the early to mid-2000s, the last 10 years and particularly the last two have had a very sharp reversal of performance towards growth. There has been a small shift back to value over the past six months.
3Yr Annualised Returns: MSCI World Ex AU Value - MSCI World Ex AU Growth
Dec 1999 – April 2021

Source: MSCI, Realindex, data as at 30 April 2021
3Yr Annualised Returns: MSCI EM Value - MSCI EM Growth
Dec 1999 - Apr 2021

Source: MSCI, Realindex, data as at 30 April 2021
The weak performance of Value has largely been a result of the very expensive stocks getting significantly more expensive – many within the Consumer Discretionary and IT sectors. This is highlighted if we look at differences in book yields between the most expensive (growth) and cheapest (value) stocks.
The two charts below look at quintile differences in book yields in both DM and EM. In both universes, changes in the most expensive quintile have driven this increased divergence between Value and Growth rather than in the traditional Value stocks. This has particularly been the case in the last two years with an increase in the most expensive stocks rather than an adjustment of the cheaper stocks. Recently we are starting to see some reversal of these expensive stocks toward the long term averages.
Looking at the difference between DM and EM more closely, there has been an upward trend for some time in the top quintile within the DM universe with a very steep increase lately. This is in contrast to EM where although we have seen an increase in the last two years, there appears to be a more constant level that this top quintile reverts back towards. This indicates that there may be more of a structural change to growth within the DM universe that we are not seeing in EM and we may not expect it to revert back to its historical levels.
Emerging Markets Average Price to book

Source: Realindex, Factset, data as at 31 April 2021
Developed Markets Average Price to book

Source: Realindex, Factset, data as at 31 April 2021
These changes have also led to Value being under-represented in the cap-weighted indices. While Value and Growth stocks were relatively equally represented in the MSCI EM index in the early 2010s, there has been a sharp increase in the percentage of the index now represented by ‘growth’ companies. There is now approximately four times the number of Growth stocks compared to Value stocks in the index. This same pattern has arisen in DM markets.
Percentage of Expensive and Cheap stocks in the MSCI EM Index

Source: MSCI, Realindex, data as at 30 April 2021
Finally, we have recently seen some factor rotation back into Value, but it is still historically cheap. In the chart below we can see that not only is Value cheap relative to the other style factors, its current value (indicated by the black dots) is also at the lower ends of these valuations. This is compared to several Quality and Growth factors, which are towards the upper end of their historical valuations.
Valuation of different factors within the MSCI EM universe

Source: Realindex, data as at 31 March 2021. The X-axis shows buckets of factors where EY = Earnings yield, DY = Dividend yield, EBITDAEV = Earnings before interest, tax, depreciation, amortisation to Enterprise value, SY = Sales yield, DPS = Dividends per share, EPS = Earnings per share, ROA = Return on assets, ROE = Return on equity, Mom = Momentum.
What is driving some of the reversal towards value?
Value traditionally outperforms with rising interest rates and inflationary expectations. During the recent pandemic, and even before in some instances, official interest rates were cut which helped accelerate the performance of growth stocks. Recently we have seen talk of rising inflation and with borders starting to open up and vaccine rollouts globally, we are seeing longer term interest rate expectations start to rise. Below are some of the yield curves within EM. We can see that all have expectations of rising rates which should continue to bode well for value stocks.
Comparable Treasury Yields from different EM countries

Source: RBA, data as at 31 March 2021
Why Realindex EM?
So how can you achieve exposure to EM whilst also achieving a value tilt to take advantage of the relatively cheap nature of this style at the moment? Will a market cap index do it? As we saw above, the market cap index is susceptible to concentration bias, especially in the EM space. It will, by its nature, tend to overweight expensive stocks and underweight cheaper stocks, embedding growth and momentum styles to the investment. It is also vulnerable to pricing bubbles and subsequent corrections.
The Realindex Emerging Markets Fund looks to weight stocks based on metrics that reflect company size but are not correlated with prices. The core components it considers when calculating weights for the stocks are adjusted sales, adjusted book value, cash flows and dividends. By its nature, this makes it value-tilted relative to the cap-weighted benchmark but this is an outcome, not a goal. Like a cap-weighted index, it has the positive aspects of index investing (systematic, lower cost and lower turnover) but not the unintended exposure to expensive stocks.
If we look at some statistics of the Realindex Emerging Markets Fund vs the MSIC EM index we can see that it is well-positioned to capture the value exposure identified above as a potential source of future returns. Relative to the MSCI EM index we can see it is at a discount to Price/Cash Flow, Price to Book and Price to Sales metrics and a premium to the Dividend Yield of the market cap benchmark. The chart below shows the historical ranges of these discounts/premiums and the red triangle represents the position at the end of March 2021.
Realindex Emerging Markets Valuation Comparison vs MSCI Emerging Markets

Source: Realindex, Factset, data as at 31 March 2021
In summary
It is a combination of a number of factors that might lead investors to view EM Value as a source of returns over the coming years. These include forecasted returns in EM, rising interest rates and Value being the most undervalued style. Also, the more muted returns that EM has experienced relative to DM over the past 10 years, as well as the lower country CAPE valuations relative to history, provides for more opportunities in the EM space. Within EM, Value has underperformed relative to Growth over the last ten years although we are starting to see these fortunes reverse. Within the EM space we are seeing Value metrics not only being cheap relative to other style factors but towards the bottom end of their historical averages providing yet another opportunity for continued outperformance in this space.
Given the above, we believe the opportunity from a long term valuation perspective is in Emerging Markets Value with the Realindex Emerging Markets Fund being well placed to capture this. This Fund doesn’t suffer from the current concentration issues like the cap-weighted benchmark and by the nature of its construction, we believe will provide the value tilt that investors seek as reflected in the Fund’s valuation characteristics.
A smarter way to invest
Across Australian and global equities, Realindex adopts a systematic, rules-based approach to investing. Our strategies are lower cost, lower turnover and are tax-efficient compared to traditional active investment approaches. To learn more, visit our website.
Never miss an update
Enjoy this wire? Hit the ‘like’ button to let us know.
Stay up to date with my current content by
following me below and you’ll be notified every time I post a wire
Joanna brings 13 years’ quantitative investment experience including senior roles at Acadian, where she was a senior portfolio manager, and Blackrock, where she was a portfolio manager within scientific equities, ran index portfolios and was Head of Sustainable Investment in Australia. Joanna is also a Lecturer at the University of Technology, Sydney and at New York University. Joanna holds a CFA accreditation, has a PHD in Economics from Yale University, and was awarded a Fulbright scholarship. She has a Bachelor of Laws and Economics (Honours) from the University of New South Wales.
........
Livewire gives readers access to information and educational content provided by financial services professionals and companies ("Livewire Contributors"). Livewire does not operate under an Australian financial services licence and relies on the exemption available under section 911A(2)(eb) of the Corporations Act 2001 (Cth) in respect of any advice given. Any advice on this site is general in nature and does not take into consideration your objectives, financial situation or needs. Before making a decision please consider these and any relevant Product Disclosure Statement. Livewire has commercial relationships with some Livewire Contributors.

4 topics

Joanna brings 13 years’ quantitative investment experience including senior roles at Acadian, where she was a senior portfolio manager, and Blackrock, where she was a portfolio manager within scientific equities, ran index portfolios and was Head...
Expertise
Joanna brings 13 years’ quantitative investment experience including senior roles at Acadian, where she was a senior portfolio manager, and Blackrock, where she was a portfolio manager within scientific equities, ran index portfolios and was Head...
Expertise
Comments
Comments
Sign In or Join Free to comment