A Very Uncertain Life after COVID – where to from here?

Jonathan Sheridan
FIIG Securities
Risk assets, in particular the equity market, even after last night, are still pricing in a decidedly V-shaped recovery from the COVID-19 lockdown and subsequent economic shock. We feel that path is unlikely with a U or even L shaped recovery a more probable outcome and suggest investments to consider on that basis.
Executive Summary
We expect deflation to follow a relatively short but deep recession (depending on virus outcomes) with a drawn-out recovery. This is likely to be followed by inflation as policy measures allow the economy to run hot.
We recommend continuing to improve overall credit quality across portfolios, and specifically we like investment into longer-dated government or semi-government bonds for the deflationary period as well as inflation linked annuities throughout, given their unique ability to perform in negative or positive inflation environments.
Economic damage wrought – generationally bad
Government policy and actions across the globe have been unprecedented in order to contain the spread of the COVID-19 virus. The follow-on impact however to all variety of economic data appears to be the worst in living memory, and in many cases as bad as the Great Depression of the 1930s.
To quote the RBA Governor Philip Lowe after the monetary policy decision on the 2nd of June:
“The Australian economy is going through a very difficult period and is experiencing the biggest economic contraction since the 1930s. In April, total hours worked declined by an unprecedented 9 per cent and more than 600,000 people lost their jobs, with many more people working zero hours. However, the outlook, including the nature and speed of the expected recovery, remains highly uncertain and the pandemic is likely to have long-lasting effects on the economy.”
We agree the monetary and fiscal stimulus was necessary to provide a safety net for the economy whilst the Government attempted to gain control of the virus, but future generations will be picking up the tab for a long time to come.
Here are some charts which show the extent of the downturn in activity:

World trade is highly correlated to recessions and was declining even before the virus struck. Indeed, the last time world trade was negative was in the early 1980s and 2008/9 recessions (this data is only to February so is likely to be much worse to May):

With the world in a weakening position prior to the virus, we find
ourselves in unprecedented contraction territory.


Remember some elementary mathematics – from 100 to 50 is -50%. To get back to 100 you must grow 100% from the new base level, i.e. double. Ask the question – is it likely that economic activity will double from this low base in the near future – the ‘V-shaped’ recovery? We think it very unlikely.
The Congressional Budget Office in the US has a similar view to us, albeit they are much more optimistic than the Atlanta Fed’s prediction:
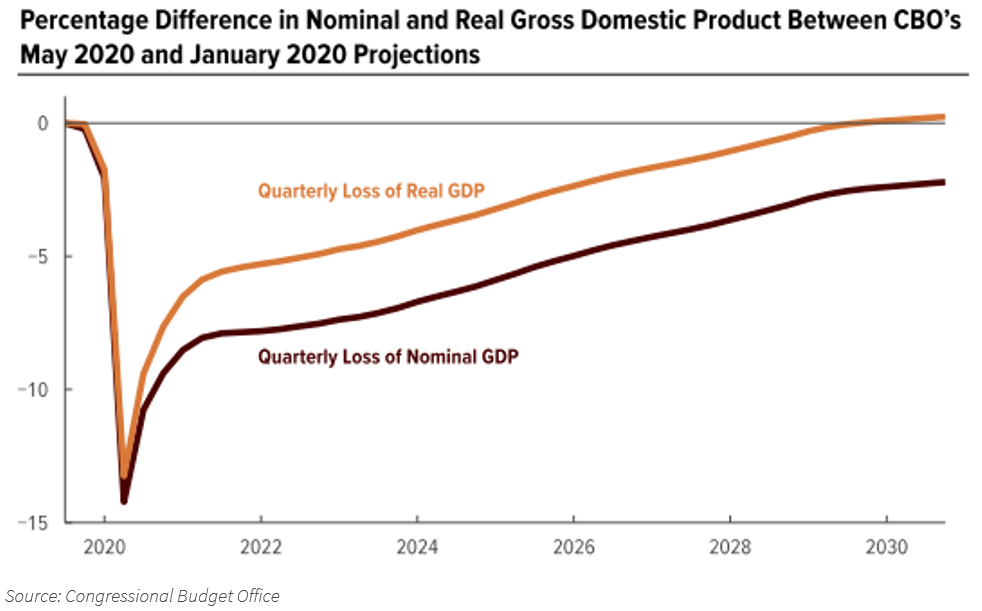
This is more of a “tick”-shaped recovery, which is predicted to take about 9 years to get back to where we were pre-virus.
Impact on business activity
We can look to China, being a few months ahead of the rest of the world in easing restrictions post the most acute stage of the virus, for an indication of how business has been affected and a potential path forward:

This looks like everything is fine and activity has returned to previous levels after just one month. That is the standard and unfortunately incorrect interpretation of this data. PMI indices are what are called diffusion indices – i.e. they measure the month-on-month changes in activity. So for a reading of 50, this means that activity is the same as it was the previous month.
The above series therefore actually shows that in February activity (Composite – i.e. Manufacturing and Services) dropped significantly (approx. 75% of survey respondents indicated a contraction in activity), and since then activity has continued contracting, albeit at a reduced rate. A level of 50 indicates no expansion or contraction.
So business activity has dropped and is not really recovering at all.
Impact on employment
The major consequence of this huge reduction in business activity has been felt in the employment market. We have seen unprecedented levels of people seeking unemployment benefits:
US initial jobless claims:

In the GCF in 2008/9, the peak weekly initial claims number was 661,000. The last 10 weeks of data from March 21st have shown the following numbers:

A total of 40.8m previously employed individuals have asked to be covered by unemployment insurance. Employment data out this Friday the 5th of June is expected to show that approximately 20% of the entire US workforce is currently unemployed.
We pose another question – with most employment being derived from SME (small/medium enterprises) businesses, would you as an owner of such a business be quick to rehire staff when you have little confidence your business will operate at the same capacity as before the virus? Think of a restaurant that is now restricted to only 30% capacity due to social distancing rules.
Impact on the consumer
For a long time approximately 70% of the US economy (and indeed the Australian economy) has been driven by the consumer. The long term trend of movement of western style economies to service-based rather than production-based has meant that the impacts of the virus, which have largely shut down the service economy while manufacturing has been less affected, means this recession is likely to be deeper than previous ones.
The most obvious window into the consumer and their spending is retail sales. This chart below is self-explanatory:

If I am a currently unemployed person, or furloughed, and I regain my previous employment, am I likely to spend at the level I was prior to the virus? We think not, as history would indicate the likelihood of a second wave of the virus and associated shutdowns. Even if this does not occur, rational behaviour would indicate that consumers will be more prudent and save more in the event their employment is again at risk.

We are actually seeing this happen immediately in the US as above, although Australia does not seem to be as extreme.
Impact on earnings
The cascade continues on into profits – whilst many costs have been temporarily set aside due to government directives, such as mortgage repayments or rent, these are merely deferrals. Costs still accumulate and with revenues severely impacted, there is an inevitable reduction in profits:

With this backdrop of lower earnings, you would expect the equity markets to reflect this, and indeed they did – for a few weeks. The S&P500 dropped below 3,000 on the 27th of February and regained that level again (after peeking over and falling back) just 2 months later on the 27th of May.
In the face of the worst unemployment conditions since the Great Depression and with the consumer making up ~70% of US GDP, equities have generally responded to a decline in profits of approx. 15% by falling just 11% from all-time highs.
Impact on the real economy
This has led to a huge disconnect between the real economy and financial markets, which is encapsulated in this chart:

One may say this contradicts the previous mention of private saving. The offset is the government, with their huge deficits (i.e. dis-saving) to provide the safety nets – these are dwarfing the private side of the equation.
Why is this important? The US will have net negative national saving for the first time since the 1930s.
One of the classic formulae of monetary economics is that investment (i.e. growth) must equal saving. Without saving there is no excess capital to be invested. Therefore, with net negative saving it follows there must be net negative investment, which will pull down the standard of living, and is also likely to lead to deflation.
Impact on inflation (deflation)
Recessions tend to lead to deflation. The below table shows the worst 3 recessions since WW2 and the impact on deflation. Oil, which is often seen as an indicator for inflation given its ubiquity as a raw material, surprisingly has no correlation.

With current 5 year inflation expectations (as measured by the difference in yield between the 5 year US Treasury nominal bond and the inflation protected equivalent) at 1.48%, even a decline in inflation by half of the average of these 3 recessions would send the US economy into deflation.
The same is true of Australia, and with current 5 year expectations at just 0.39%, we are at greater risk of the same.
Impact on risk asset prices
Eventually we believe that this divergence between risk assets and traditional safe haven assets as described in our previous article will result in falling risk asset prices as the inevitability of the economic situation forces prices to adjust.
The current ‘melt-up’ in equity prices following the fastest ever bear market is in our view purely liquidity driven. The unprecedented monetary stimulus has made the markets awash with liquidity, which is propping up otherwise untenable positions, mainly in levered equity strategies.
Furthermore, the equity rally has largely been centred around technology stocks, with the NASDAQ index actually being positive for 2020.
The following chart sums up our view:

The sheer speed of the initial drop in stock prices overwhelmed the usually more cautious central banks, and, bearing in mind the delayed response during the GFC, they responded with immense stimulus, which has been backed up by fiscal response.
However, as the reality of the economic situation becomes inevitable, such as the roll off of the JobKeeper program domestically, we believe that risk asset prices will fall. In turn we believe that safe haven assets should outperform.
Conclusion – what to invest in?
We believe that the likely combination of falling risk asset prices and deflation makes one strategy clear.
This is to improve credit quality in portfolios as a priority. This is a message we have been consistent on for more than a year, as we saw excesses build up in risk markets.
The combination of deflation and falling risk asset prices should provide the environment for high quality bonds to outperform other assets.
We believe the recession internationally as well as domestically may be short but deep, and therefore the bounce back may come quickly, but it will not be enough to recover all the lost ground for some years.
Central banks are likely to maintain stimulatory conditions for longer than they otherwise would which may run the economy ‘hot’– note the RBA Governor’s comments on Tuesday: “The Board will not increase the cash rate target until progress is being made towards full employment and it is confident that inflation will be sustainably within the 2–3 per cent target band.”
If this actually makes its way into the real economy, then eventually it is likely to generate real inflation, as opposed to asset price inflation.
For this reason we still remain cautious in the medium term about the risks of inflation, whilst expecting deflation in the shorter term.
There are two bond investments we recommend for this environment:
1. Longer dated high quality bonds – government or semi-government
a. Due to the credit quality and longer duration, we expect these bonds to outperform in a deflationary environment as market yields will fall. Broadly, long term yields reflect growth and inflation expectations, both of which are likely to decline in this environment.
These positions should be held until it becomes clear that inflationary expectations should begin to rise (which would be bad for their prices as yields would also be expected to rise). Liquidity available in these high-quality markets should enable trading out of these before this occurs.
2. Inflation linked annuity bonds (IABs)
a. It might seem contradictory to recommend a bond which rises with inflation when we are expecting some form of deflation. However, IABs are unique in that they typically have a floor of the previous level of the inflation index when calculating their regular payments. They are different to CIBs in this way.
This means that when inflation is negative, i.e. deflation, their return actually rises relative to their real yield, as each payment cannot be lower than the last. For example, if inflation is -2%, they make a constant payment, so the investor return is equal to inflation +2%. This may be greater than their expected real yield in a positive inflationary environment.
They are also typically long dated and of a high credit quality, so they also fit the requirement of 1. above.
Supply can be patchy and as most of these bonds are similar, we would encourage adding exposure whenever supply is available, regardless of the particular name.
Aside from these two specific recommendations we would encourage investors to review their portfolios with a view to increasing the overall quality. This may mean for example moving from an unsecured to a secured position in the high yield portion of the portfolio, as well as increasing the investment grade proportion of the portfolio overall.
Get investment ideas from industry insiders
Liked this wire? Hit the follow button below to get notified every time I post a wire. Not a Livewire Member? Sign up for free today to get inside access to investment ideas and strategies from Australia’s leading investors.
Never miss an update
Enjoy this wire? Hit the ‘like’ button to let us know.
Stay up to date with my current content by
following me below and you’ll be notified every time I post a wire
Jon is FIIG Securities’ Chief Investment Strategist. Also a Chartered Accountant, Jon has been working in multi-asset class investment markets for over 15 years, and now specialises in providing fixed income solutions for FIIG’s clients.
........
This document has been prepared by FIIG Investment Strategy Group. Opinions expressed may differ from those of FIIG Credit Research.
The contents of this document are copyright. Other than under the Copyright Act 1968 (Cth), no part of it may be reproduced, distributed or provided to a third party without FIIG’s prior written permission other than to the recipient’s accountants, tax advisors and lawyers for the purpose of the recipient obtaining advice prior to making any investment decision. FIIG asserts all of its intellectual property rights in relation to this document and reserves its rights to prosecute for breaches of those rights.
FIIG Securities Limited (‘FIIG’) provides general financial product advice only. As a result, this document, and any information or advice, has been provided by FIIG without taking account of your objectives, financial situation and needs. FIIG’s AFS Licence does not authorise it to give personal advice. Because of this, you should, before acting on any advice from FIIG, consider the appropriateness of the advice, having regard to your objectives, financial situation and needs. If this document, or any advice, relates to the acquisition, or possible acquisition, of a particular financial product, you should obtain a product disclosure statement relating to the product and consider the statement before making any decision about whether to acquire the product. Neither FIIG, nor any of its directors, authorised representatives, employees, or agents, makes any representation or warranty as to the reliability, accuracy, or completeness, of this document or any advice. Nor do they accept any liability or responsibility arising in any way (including negligence) for errors in, or omissions from, this document or advice. FIIG, its staff and related parties earn fees and revenue from dealing in the securities as principal or otherwise and may have an interest in any securities mentioned in this document. Any reference to credit ratings of companies, entities or financial products must only be relied upon by a ‘wholesale client’ as that term is defined in section 761G of the Corporations Act 2001 (Cth). FIIG strongly recommends that you seek independent accounting, financial, taxation, and legal advice, tailored to your specific objectives, financial situation or needs, prior to making any investment decision. FIIG does not provide tax advice and is not a registered tax agent or tax (financial) advisor, nor are any of FIIG’s staff or authorised representatives. FIIG does not make a market in the securities or products that may be referred to in this document. A copy of FIIG’s current Financial Services Guide is available at www.fiig.com.au/fsg.
An investment in notes or corporate bonds should not be compared to a bank deposit. Notes and corporate bonds have a greater risk of loss of some or all of an investor’s capital when compared to bank deposits. Past performance of any product described on any communication from FIIG is not a reliable indication of future performance. Forecasts contained in this document are predictive in character and based on assumptions such as a 2.5% p.a. assumed rate of inflation, foreign exchange rates or forward interest rate curves generally available at the time and no reliance should be placed on the accuracy of any forecast information. The actual results may differ substantially from the forecasts and are subject to change without further notice. FIIG is not licensed to provide foreign exchange hedging or deal in foreign exchange contracts services. FIIG may quote to you an estimated yield when you purchase a bond. This yield may be calculated by FIIG on either A) a yield to maturity date basis; or B) a yield to early redemption date basis. Some bond issuances include multiple early redemption dates and prices, therefore the realised yield earned by you on the bond may differ from the yield estimated or quoted by FIIG at the time of your purchase. The information in this document is strictly confidential. If you are not the intended recipient of the information contained in this document, you may not disclose or use the information in any way. No liability is accepted for any unauthorised use of the information contained in this document. FIIG is the owner of the copyright material in this document unless otherwise specified.

5 topics
Jonathan Sheridan
Director, Fixed Income & Investment Strategy
FIIG Securities
Jon is FIIG Securities’ Chief Investment Strategist. Also a Chartered Accountant, Jon has been working in multi-asset class investment markets for over 15 years, and now specialises in providing fixed income solutions for FIIG’s clients.
Comments
Comments
Sign In or Join Free to comment