Active manager skill in Australian small companies

Andrew Mouchacca
Flinders Investment Partners
Active management has successfully delivered alpha from Australian small companies over the long-term. Further, in periods when the dispersion of stock returns within the benchmark has been high, the median manager has delivered strong alpha. However, the ability to outperform the benchmark in periods of low returns dispersion (as has been the case for the last 3 years) has been poor.
Therefore, to determine if a manager can deliver long-term alpha over the cycle, we must assess their performance in conditions of low volatility (which can persist for significant periods) where opportunities are scarce, in order to validate the manager’s stock selection and portfolio management skill.
When and how alpha is added
In the last 20 years, small companies have provided investors with an abundant source of strongly performing investment opportunities. An actively managed portfolio of small companies delivered significant outperformance, with the median small cap manager returning 12.1%pa (gross), an outperformance of ~9%pa above the S&P/ASX Small Ordinaries Accumulation Index.
While alpha has mostly remained positive, there have been several periods through the last two decades where the median manager returns have fallen below the benchmark (see Chart 1 below). This has been the case in the last 3 years.
Chart 1. Outperformance of the median small companies’ manager (rolling 12 months)
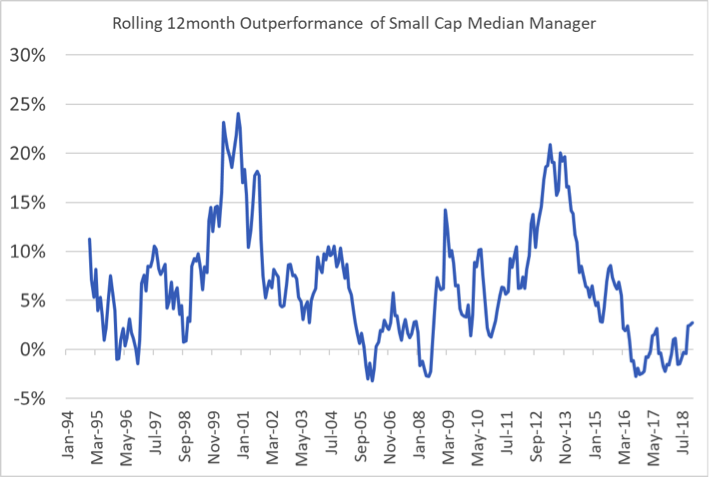
Source: Mercer, Flinders Investment Partners
Fund managers often attribute their edge in generating alpha to either style (value, growth, core, quality etc) or to a lesser extent sector exposure (or the exclusion of sectors e.g. resources).
We have illustrated previously that a fundamental growth approach is preferred in delivering outperformance in small companies. However, this report will focus on statistical market characteristics in determining when and how alpha is added.
To do this we will analyse the cross-sectional volatility (or returns dispersion) of the small companies index. We will also review market returns and characterise how volatility has assisted (and hindered) managers in delivering alpha.
Active managers require a reasonable level of stock returns dispersion to provide an opportunity set in order to select winners against losers. Therefore, active returns are a function of manager skill and cross-sectional volatility, with cross-sectional volatility magnifying the manager's skill.
Volatility is generally defined as the standard deviation of returns. Volatility can be calculated for a single stock or a universe of stocks. Our analysis will focus on the universe or index of stocks and practically it is defined as the dispersion of stock returns within a given index. This is known as cross-sectional volatility and is a measure of stock level dispersion which is essential in determining the effectiveness of an active manager’s skill. So, when we reference volatility in this paper, we refer to cross-sectional volatility.
Volatility provides a leveraging effect for managers' skill
Where the volatility of a stock index is high, the opportunity for an active manager to rank stocks according to relative returns expectations is strong and hence, the opportunity to add value is strong.
Stock selection skill remains a key determinant to alpha generation, with volatility providing a leveraging effect to a managers’ skill. Regardless of skill, active managers will tend to reduce their active positions as the cross-sectional dispersion of returns increases.
Where the volatility of a stock index is low, the distribution of returns amongst the index stocks is low. Hence, the opportunity of the active manager to add value is challenged and therefore stock selection skill becomes the key determinate to outperformance. In this case, active managers should increase active positions in the portfolio to offset low dispersion of returns and hence low idiosyncratic risk.
So, stock selection skill remains the primary driver of alpha generation, however, portfolio construction must respond to the prevailing volatility.
Chart 2. S&P/ASX Small Ordinaries Accumulation Index cross sectional volatility (Jan 2000 to Dec 2018)
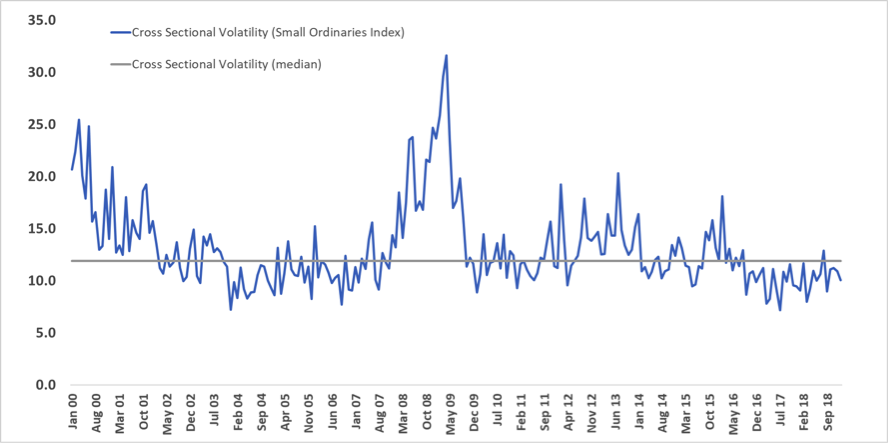
Source: Flinders Investment Partners
As can be seen from Chart 2, volatility of the Small Ordinaries Index has moved through large bands over the last 20 years. Key periods of high volatility include:
- Tech boom-bust, 2000 to 2001
- GFC, mid 2007 to 2009
- Post China Stimulus, 2011 to early 2014
Key periods of low volatility include:
- Global growth boom, 2004 to mid 2007
- China stimulus, 2009 to 2011
- US growth supporting global growth, 2015 to now...
Variation in market idiosyncratic risk requires a response from the active manager. As can be seen from Chart 3, the level of volatility does not determine the direction of the markets but rather indicates a change in the market dynamics which an active manager must interpret and respond.
Chart 3 S&P/ASX Small Ordinaries Index cross sectional volatility and S&P/ASX Small Ordinaries Accumulation Index (Jan 2000 to Dec 2018)
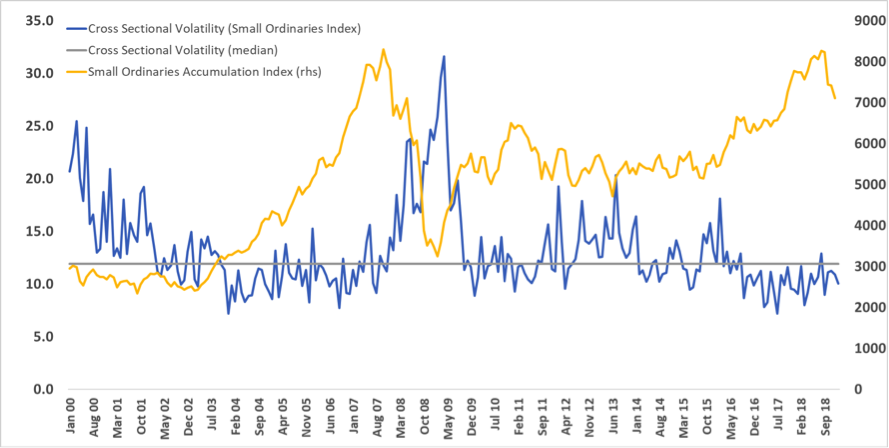
Source: Flinders Investment Partners
To determine manager skill, we need to review the manager's outperformance against volatility (as illustrated in Chart 4).
Chart 4: S&P/ASX Small Ordinaries Index cross-sectional volatility and excess performance of the median Australian small company manager (Jan 2000 to Dec 2018)
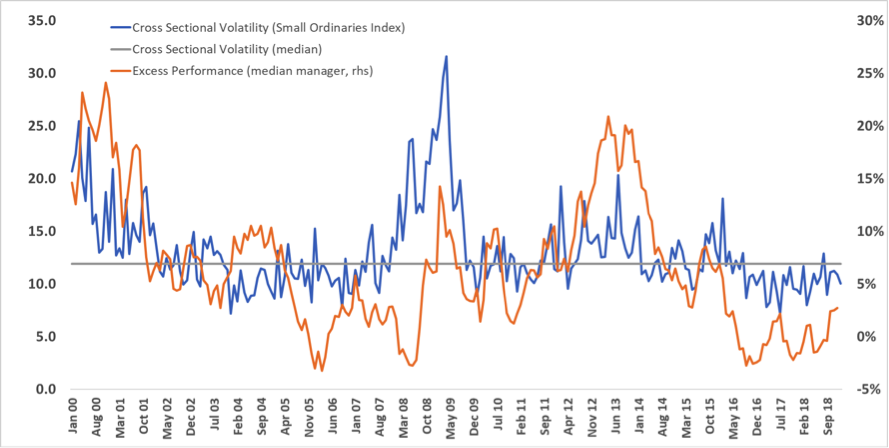
Source: Mercer, Flinders Investment Partners
Chart 4 illustrates that over the journey, the median manager has added considerable value (~9%pa). Typically, where volatility has been above the long-term median (~12%), active managers have successfully added solid active returns. On the contrary, where volatility has traded below the median, managers have tended to struggle. This points to a lack of skill by the manager in responding to a subdued dispersion environment.
For example, the median manager successfully generated alpha in the period between 2011 and 2014, which coincided with the end of investment stimulus in China, and which led to a substantial derating of resource companies as well as associated industrial companies (which as a group represented ~40% of the benchmark at the commencement of the period). This market development led to increased volatility and therefore, active positioning away from this group of stocks added significant value. Post this period, as the returns dispersion fell towards the long-term median and below, the median manager struggled to add value.
Low/negative alpha was also observed during 2005 - 2008 (strengthening emerging market growth), and the 2009 - 2010 (GFC) period.
In each of these cases, a market thematic had established itself, however once this changed (due to survivorship, valuation differential, etc.), the active manager was either not prepared to enhance active risk in the portfolio to offset a reduced returns dispersion and/or, demonstrated poor stock selection skill. We believe both factors are relevant.
Look at how a manager performed in times of low volatility
It has been demonstrated over time, that active management is a successful strategy for generating alpha from Australian small companies. Further, when volatility is high, the median manager has delivered strong alpha. However, the ability to outperform the benchmark in periods of low volatility (as has been the case for the last ~3 years) has been poor.
Therefore, to determine if a manager can deliver long-term alpha, it’s critical to analyse their performance in periods of low volatility (which may persist for significant periods).
Underperformance during these low volatility periods may indicate the manager’s inability to interpret the prevailing environment which requires enhancing active risk (portfolio management skill) and/or accentuate the manager’s poor stock selection skill.
What about big caps?
The use of passive versus active investment management is often suitable for subdued volatility markets. As can be seen from chart 5, if we compare the volatility of large and small capitalization companies in the Australian market, we can see that large caps trade at materially lower levels than compared with smalls caps.
We therefore accept that within large caps, there is relatively little opportunity for value to be added through vanilla, active management. However, for small companies, dispersion supports active management.
Chart 5 Cross sectional volatility for the S&P/ASX 100 (Large Cap) and the S&P/ASX Small Ordinaries (Small Cap) Index
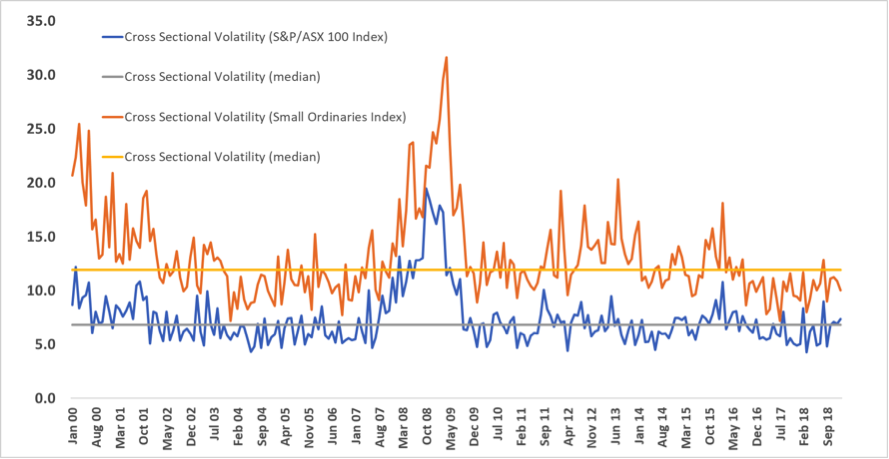
Source: Flinders Investment Partners
Disclaimer and Disclosure
Equity Trustees Limited (‘EQT’) (ABN 46 004 031 298 AFSL 240975) is the Responsible Entity for the Flinders Emerging Companies Fund. The material contained in this communication (and all its attachments) is general information only and has been prepared by Flinders Investment Partners Pty Ltd (“Flinders”), a Corporate Authorised Representative of Prodigy Investment Partners Limited (“Prodigy”), AFSL 466173.
It is not intended to take the place of professional advice and you should not act on any recommendation (if any) made in this communication without first consulting your investment advisor in order to ascertain whether the recommendation (if any) is appropriate, having regard to your investment objectives, financial situation and particular needs. Nothing in this communication shall be construed as a solicitation to buy or sell a security or to engage in or refrain from engaging in any transaction.
Flinders and Prodigy believe that the information and advice (if any) contained herein is correct at the time of compilation. However, Flinders Prodigy and EQT provide no representation or warranty that it is accurate, complete, reliable or up to date, nor does Flinders, Prodigy or EQT accept any obligation to correct or update the opinions (if any) in it. The opinions (if any) expressed are subject to change without notice. Flinders, Prodigy and EQT do not accept any liability whatsoever for any direct, indirect, consequential or other loss arising from any use of the material contained in this communication.
This communication may refer to the past performance of a person, entity or financial product. Past performance is not a reliable indicator of future performance. Investors should obtain the relevant product disclosure statement and consider it before making any decision to invest.
Never miss an update
Enjoy this wire? Hit the ‘like’ button to let us know.
Stay up to date with my current content by
following me below and you’ll be notified every time I post a wire
Andrew is Founding Partner of the Flinders Emerging Companies Fund, which provides investors with an actively managed portfolio of listed small and emerging Australian companies, and is one of the top investment managers in the space.

6 topics
Andrew Mouchacca
Founding Partner and Portfolio Manager
Flinders Investment Partners
Andrew is Founding Partner of the Flinders Emerging Companies Fund, which provides investors with an actively managed portfolio of listed small and emerging Australian companies, and is one of the top investment managers in the space.
Expertise
Comments
Comments
Sign In or Join Free to comment