An odd period for quant in the Australian equity market
Many investment managers use quantitative screens to focus their attention on the investment opportunities that are most likely to reward close study, and we are certainly among them. Over the years we have built software tools that make it easy for us to analyse the historic performance of a wide range of fundamental and other data points in forecasting future investment performance.
Those data points found to have the strongest predictive ability we combine into forecast models to give us an indication of potential future returns. When the model identifies a company likely to deliver strong returns, our process leads us to study its quality and value closely to determine whether it meets our criteria.
Currently, for the Australian equity market, we use a model that incorporates 18 different factors, including things like historical return on equity, cash flow yield and price volatility. The model has very solid back test performance, and while the future is always hard to predict, our analysis gives us confidence that the model should provide very useful guidance. However, our analysis also tells us that the model won’t work all the time. There will be periods when it works very well, and periods when it doesn’t work at all. As with most forms on investing, patience is important.
A critical issue in building and using models like this is overfitting. By allowing the model to become excessively complex, it is possible to make it work extremely well for historical data (so called “in-sample” data), but much less well for future forecasts (so-called “out-of-sample”). This happens when a complex model is built around unique patterns in the historical data that may not be repeated in future. Quantitative model builders need to be alert to this risk and strike a careful balance to get the best results.
This question becomes acute when the model experiences a period of weak performance, which is something we have seen in the Australian market in last year or two. Our final investment decisions for the Montgomery Fund and the Montgomery [Private] Fund are based on our own assessment of quality and value, and these decisions have been generally successful, but we will get the best possible results if we are able to focus our analysis on the highest-grade opportunities. Accordingly, in looking at a soft period for our quantitative models, we need to determine whether this is part of the natural ebb and flow, or whether our modelling is wanting.
Happily, there is a straightforward way to test whether we are seeing an overfitting problem. The way we do this is to include the most recent data in our standard model building process. If we are overfitting, a model built in this way will perform well on the most recent data. If, on the other hand, the new model doesn’t perform well on the most recent data, it tells us that there is something unusual about this stretch of time.
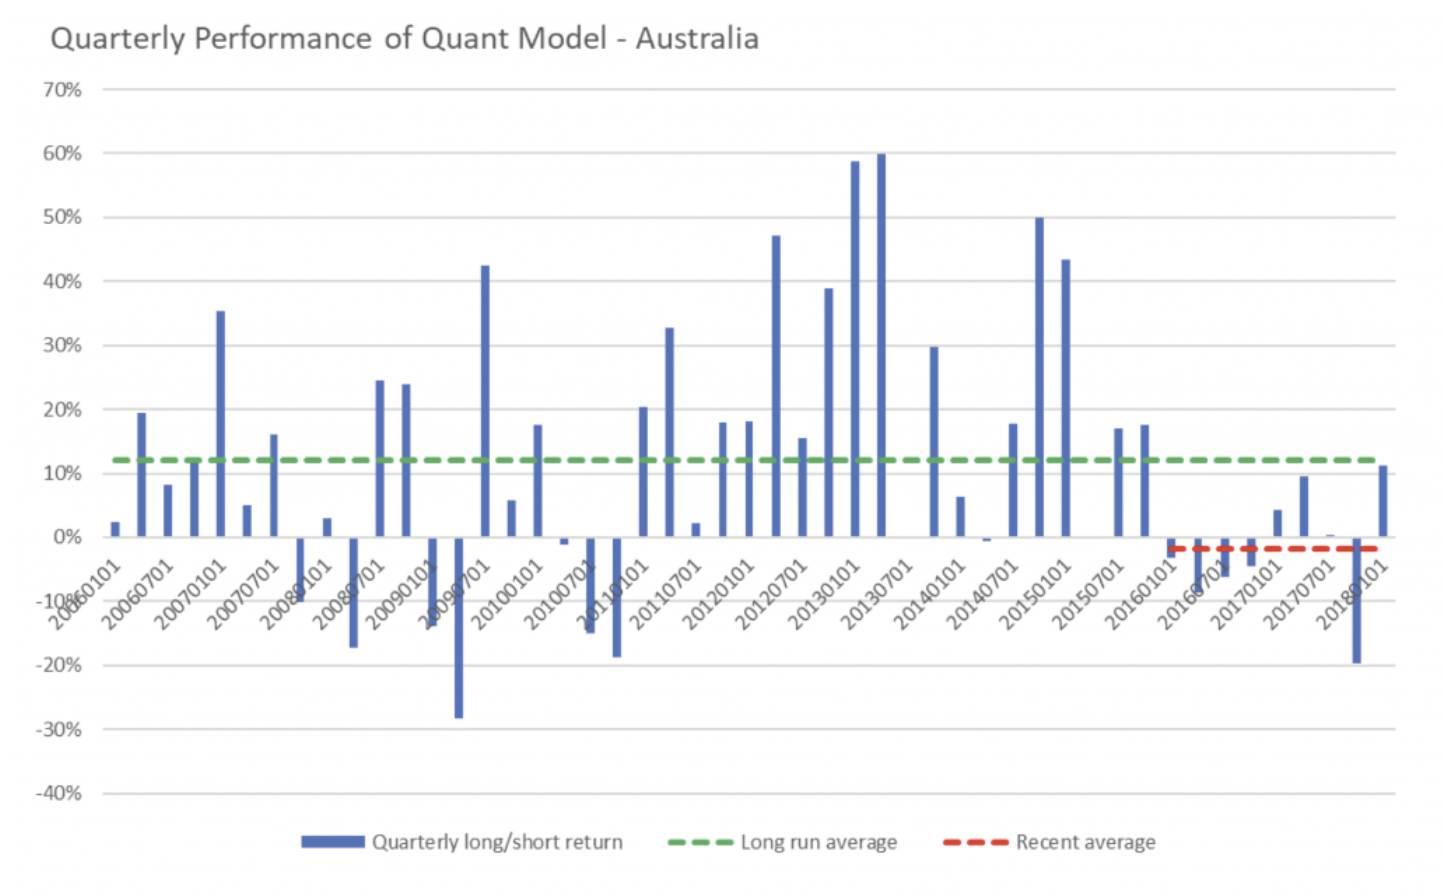
The results of the analysis are set out below. The chart shows the quarterly investment performance of a long/short portfolio built by taking the top and bottom 20 per cent of ASX200 companies based on their forecast return.
Source: MIM
A couple of things are immediately clear from the analysis. Firstly, the average result is very strong, with the long/short portfolio delivering a return in excess of 10 per cent each quarter (note that this ignores costs as well as any portfolio diversification considerations). Secondly, the performance varies significantly from quarter to quarter – there are some extraordinarily good periods and some very ordinary periods. Finally, we can see that the most recent period is unusually weak, with not a single quarterly result coming in above the long run average.
The analysis is effectively saying that, even if we had perfect hindsight, the model we would have built to cover this twelve year period would have endured an ordinary run of performance through the most recent couple of years.
This leads us to view this most recent stretch of time as an unusually challenging one for quantitative forecast models in the Australian market, and part of the natural ebb and flow for this type of investment technique. Interestingly equivalent analysis leads us to a similar conclusion in Western Europe, while North America has experienced more favourable conditions.
One of the hallmarks of successful long-term investing is investing consistently using a logical process, especially through the inevitable difficult stretches, and when it comes to the quantitative element of our process in the Australian market, we see this most recent period as a difficult stretch that will pass.
The other elements of our investment process have allowed both The Montgomery Fund and the Montgomery [Private] Fund to beat the ASX300 Accumulation Index in the 12 months to 31 May 2018, and that is certainly pleasing, but we look forward to significantly better results when all the elements of the process are working together.
If you would like to read more articles by me, please click here.
Never miss an update
Enjoy this wire? Hit the ‘like’ button to let us know.
Stay up to date with my current content by
following me below and you’ll be notified every time I post a wire
Tim Kelley has retired from Montgomery Investment Management, effective 30 September 2021. Tim’s final project has been drafting our investment guidelines to integrate environmental, social and corporate governance (ESG) considerations into our investment process. Tim remains a shareholder of Montgomery Investment Management.

4 topics

Tim Kelley has retired from Montgomery Investment Management, effective 30 September 2021. Tim’s final project has been drafting our investment guidelines to integrate environmental, social and corporate governance (ESG) considerations into our...
Expertise
Tim Kelley has retired from Montgomery Investment Management, effective 30 September 2021. Tim’s final project has been drafting our investment guidelines to integrate environmental, social and corporate governance (ESG) considerations into our...
Expertise
Comments
Comments
Sign In or Join Free to comment
most popular
Equities
The Magnificent Seven can’t carry the market forever
Pzena Investment Management