Australian Equity Factor Performance During Stressed Markets
Foresight factor premium analysis focuses on the returns that are attached to generally accepted, systematic drivers of stock returns and risk: Market, Small-Large, Value-Growth, Momentum, Asset Growth and Quality. These factors are well backed and vetted by leading academics and practitioners around the globe. Empirical studies show them to be persistent, pronounced and pervasive across different markets.
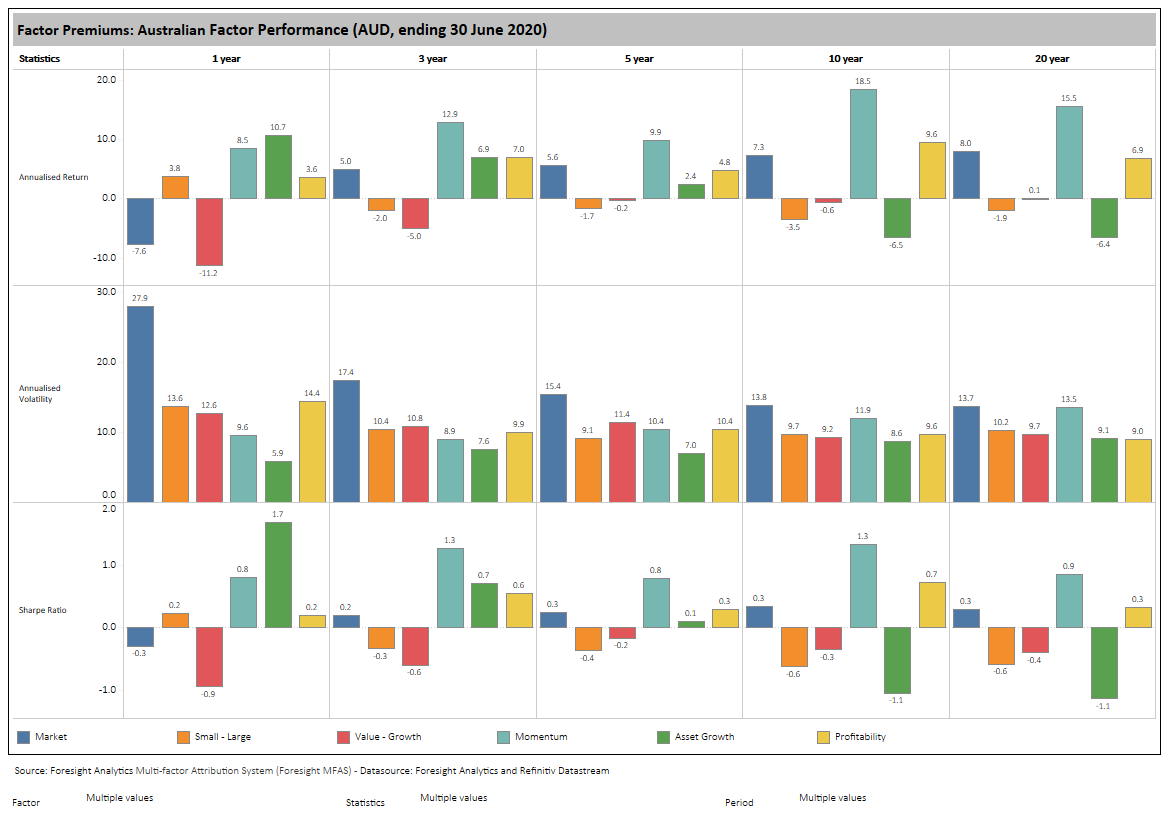
Our data shows that over the periods of 10 and 20 years, factors such as Momentum, Market (broad market) and Quality dominate with very strong positive premiums. These factors also delivered the best Sharpe Ratios over the past one and two decades. Value and Growth, also delivered similar Sharpe ratios while Large Caps beat Small Caps.
Our analysis of factor performance during stressed-market periods reveals some valuable insights for investors. The results show that Large Caps, Quality and Growth factors deliver positive premiums during stressed-market situations. Our analysis also shows that the impact of GVC has been much more severe in its first 30 days than previous crises, both in terms of speed and depth.
Longer-term perspective – Momentum, Market and Quality dominate
Our data shows that over the periods of 10 and 20 years, factor such as Momentum, Market (broad market) and Quality dominate, with very pronounced and positive premiums. These factors also delivered the best Sharpe Ratios over the past one and two decades. Value and Growth delivered similar returns (the Value-Growth factor Sharpe Ratio was -0.3 and -0.4 over 10 and 20 years, respectively). While Large Caps beat Small Caps, conservative Asset Growth beat aggressive Asset Growth over the past 10 and 20 years, which is consistent with asset pricing model expectations. In recent times though, aggressive Asset Growth has beaten conservative Asset Growth, while Growth has beaten Value by a significant margin.
The performance (quantum) of Momentum factor has surprised most investors. Its performance has been very strong over the longer term, since the GFC. Contrary to the conventional wisdom that Small Cap effect exists in Australia, Large Caps have beaten Small Caps over all time periods, except the past 12 months. Finally, while Value and Growth performance sits in balance over the 10- and 20-year periods, Growth outperformed Value over the past 10 years. This trend accelerated over the past year and continued over the current crisis period.
Exhibit 1: Momentum, Quality, and Market factors wins over the very long term
Global Virus Crisis – Large Cap, Quality and Growth outperform
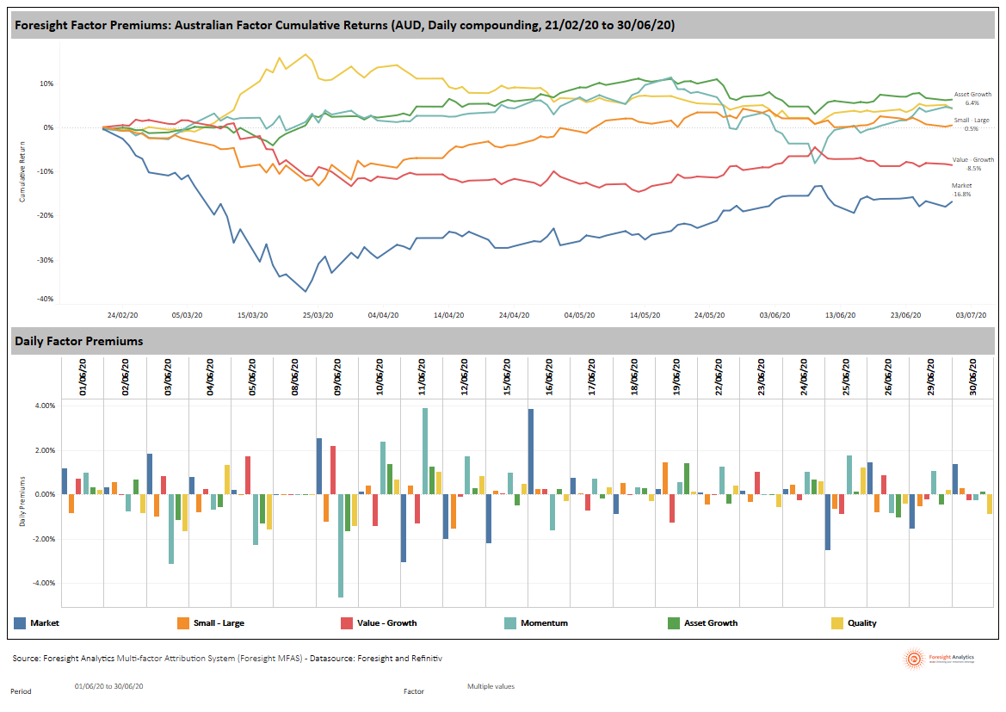
So how are the factors performing over the current crisis, which is creating one of the longest equity bull markets in history? Exhibit 2 shows the daily factor performance from 21 February 2020 to 30 June 2020.
The data shows that there is a large dispersion in factor premiums since the GVC started. We can see that Asset Growth, Momentum, Quality and Growth deliver strong positive premiums. Noticeably, the Quality factor delivered massive positive premium of almost 30%, compared to the loss of -35% by the Market factor during the first spike in the current crisis. In addition, and surprisingly, Small Caps beat Large Caps. Interestingly, the Momentum factor remained resilient over the crisis, reporting similar premiums to the Quality factor but second to the Asset Growth factor.
The bottom panel of Exhibit 2 shows the daily factor premiums. It is worth noting the largest fall in the Market premium occurred on the 16 March 2020 when major indices in Australia fell by almost 10%. This was the largest single-day fall since the 1987 market crash.
Exhibit 2: Asset Growth, Momentum, Quality, and Growth stocks provide downside protection
Global Virus Crisis – Foresight Factor Indices provide additional insights
Using the factor premium dataset, Foresight computes a series of Factor Indices for evaluating active and smart beta managers. The Foresight Factor Indices (FFI) provide a more granular perspective on the factor behaviors, not just long-short premiums. Exhibit 3 shows the performance of FFI over 1, 3, 5, 10 and 20 years. As one would expect, the FFI performance is generally consistent with factor premiums reported earlier.
The difference between Large Value and Large Growth was substantial over the year, with more than 23% outperformance by Large Growth. The performance between Small Value and Small Growth was less significant (-4%). Pro-Momentum Large Cap stocks significantly beat Contrarian (Low-Momentum) stocks. This pattern of outperformance was consistent in the Small Cap segment too.
Elsewhere, Large Aggressive Growth companies with high ROE (Quality) delivered strong outperformance. The difference between High-Growth and High-Quality (ROE) and Conservative-Growth and Low-Quality companies in the Large Cap segment was whopping 45%, thanks to a heavy influence of the A-REIT sector names in the Conservative-Growth, Low-Quality Index.
Over the longer period of 10 years, the top 3 index performers include the Small-Momentum Index, the Conservative-Growth and High-Quality Index, and the Large, Aggressive-Growth and High-Quality Index.
The significant dispersion in Foresight Index Performance at a granular level shows that the market and investors are fixated on different types of issues at different stages of the cycle. A good diversification to long term winning attributes such as Quality, Growth and Momentum can assist investors in achieving better risk-adjusted returns.
Exhibit 3: Performance Dispersion of Foresight Smart Beta Indices

Road testing factor performance during multiple crises – first 90 days
For context, every crisis is unique, and therefore one can expect to observe some differences in factor performance, notwithstanding long-term asset pricing model assumptions/expectations.
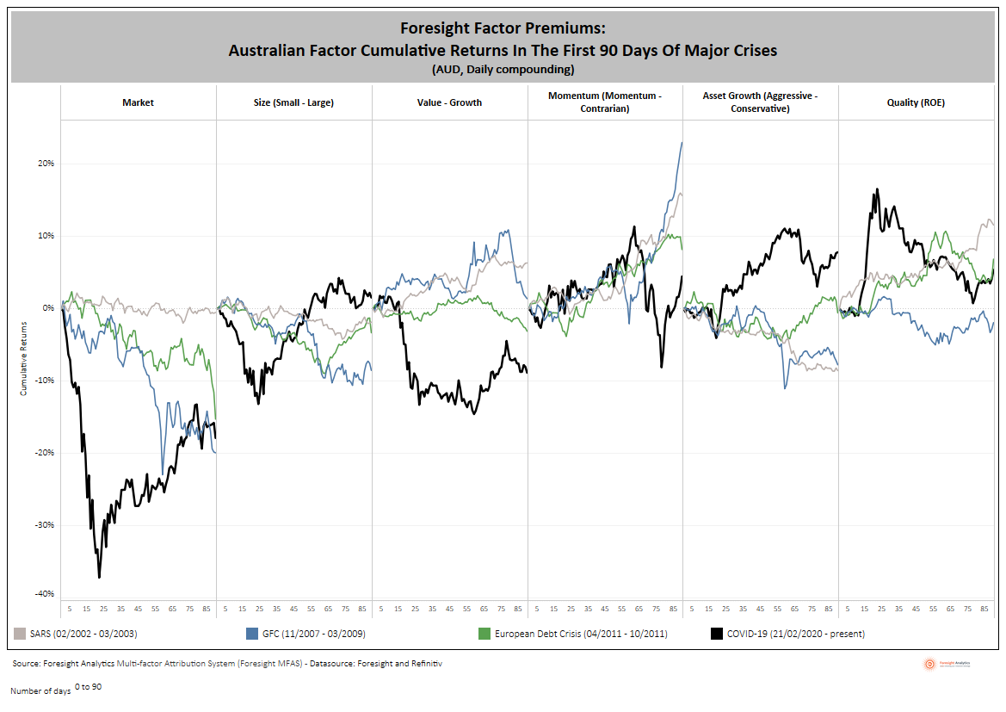
Exhibit 4 shows the cumulative returns of the Foresight Factors during previous market shocks such as SARS, the GFC and the European Financial Crisis. The analysis shows that the impact of the 2020 GVC on factor returns has been much more severe (in speed and depth) than the previous major crises, particularly during the first 30 days. The subsequent recovery across various factors has been mixed.
The GVC resulted in Large Cap, Quality and Growth factors delivering significant positive premiums. Noticeably, the Quality factor stands out, delivering a premium of 20% compared to the Market factor, which delivered -30% return since the beginning of the crisis. We show the longer-term impact of market shocks on the factors in Exhibit 5.
Further, it is worth noting the key differences between the GVC and other crises in Value performance and Asset Growth performance. Unlike previous crises, Value underperformed Growth, while aggressive Asset Growth beat conservative Asset Growth. In addition, after a significant underperformance from Small Caps, we witnessed a strong recovery after the first 30 days. Momentum and Quality premiums witnessed significant volatility after the first 30 days of the current crisis as well.
Exhibit 4: Initial impact of GVC has been much more severe compared to previous crises
Road testing factor performance during multiple crises
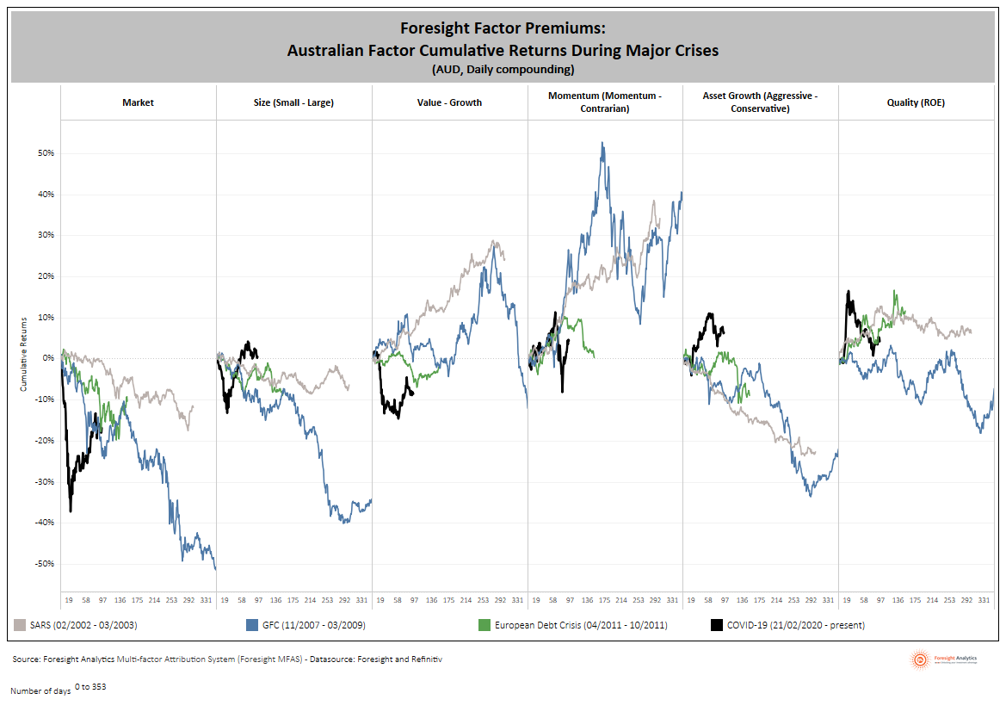
A significant level of volatility in factor premiums means the fortunes of a factor can change quite dramatically over the course of a major crisis that persists for months. Our analysis of the longer-term performance of factors, after the crisis starts, offers some enduring insights. This is presented in Exhibit 5.
The key points to note from this analysis include the following:
· Large Caps consistently outperformed Small Cap across all major crises.
· High Quality outperformed low Quality, although performance can be volatile.
· High Momentum outperformed low Momentum.
· The Market factor underperformed all other factors.
· Aggressive Asset Growth underperformed Conservative Asset Growth.
Given the initial trend observed in the first 30 days, and the pattern of factor performance behaviour during the previous 3 crises (full duration), one can reasonably expect the following factors to outperform over the course of a multi-month crisis:
· Large Caps
· Growth
· High Quality
· High Momentum
· Conservative Asset Growth
· Low Market Beta
Exhibit 5: Factor performance during major crises – full duration
What’s driving the Quality factor performance?
The performance of the Quality factor has been quite remarkable over the current crisis, but also in previous market shocks. In this section, we provide additional insights on the Quality factor that is proxied by the Return on Equity (ROE) measure of companies. The sector composition of Quality companies is shown in Exhibit 6.
The data shows that Large-Cap, High-Quality segment of the market is dominated by the Healthcare, Materials and Telecom sectors. It is interesting to see the increasing influence of Healthcare companies in this segment, largely at the expense of the Financial sector. The Small-High ROE segment of the market is dominated by Consumer Cyclicals, Technology, Materials and Financials.
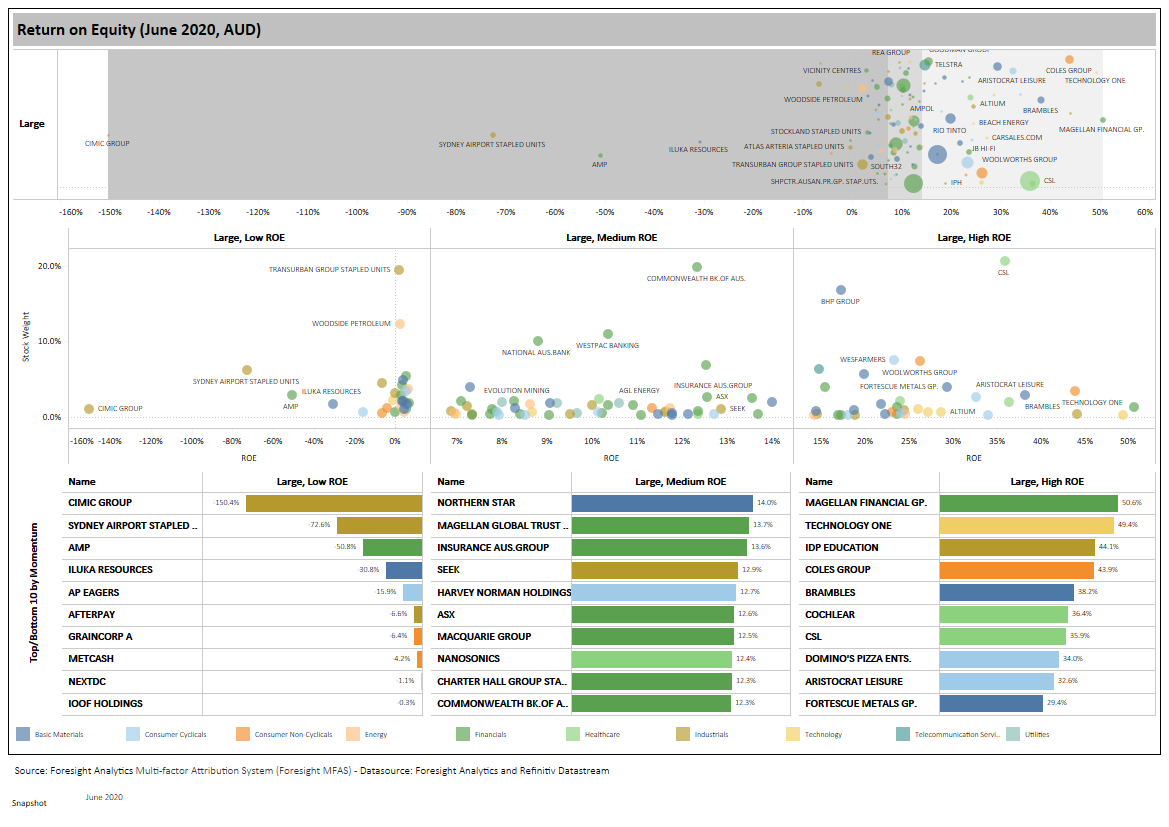
Exhibit 6: Quality factor portfolio – sector composition

By probing deeper into the stock composition of the High-Quality segment, some of the well-known businesses are revealed. Topping the Quality segments are Magellan Financial Group, Coles, Cochlear and CSL.
On the other hand, the Low-Quality names in the dataset include CIMIC, Sydney Airport, AMP and Iluka Resources.
Exhibit 7: Quality factor portfolio – stock composition
Factor correlations through time
While most investor portfolios have exposure to one or more of the factors noted in this paper, the reality is that some factors tend to deliver a better risk-reward than others over the short-, medium- and long-term. The obvious ones are Market, Quality, Large Caps, Growth and Momentum.
In reality, the correlations between the Market factor (the most dominant factor in most equity portfolios) and other factors drift through time. Hence, it’s important that investors keep an eye on the medium-to-long term correlations of these factors as well.
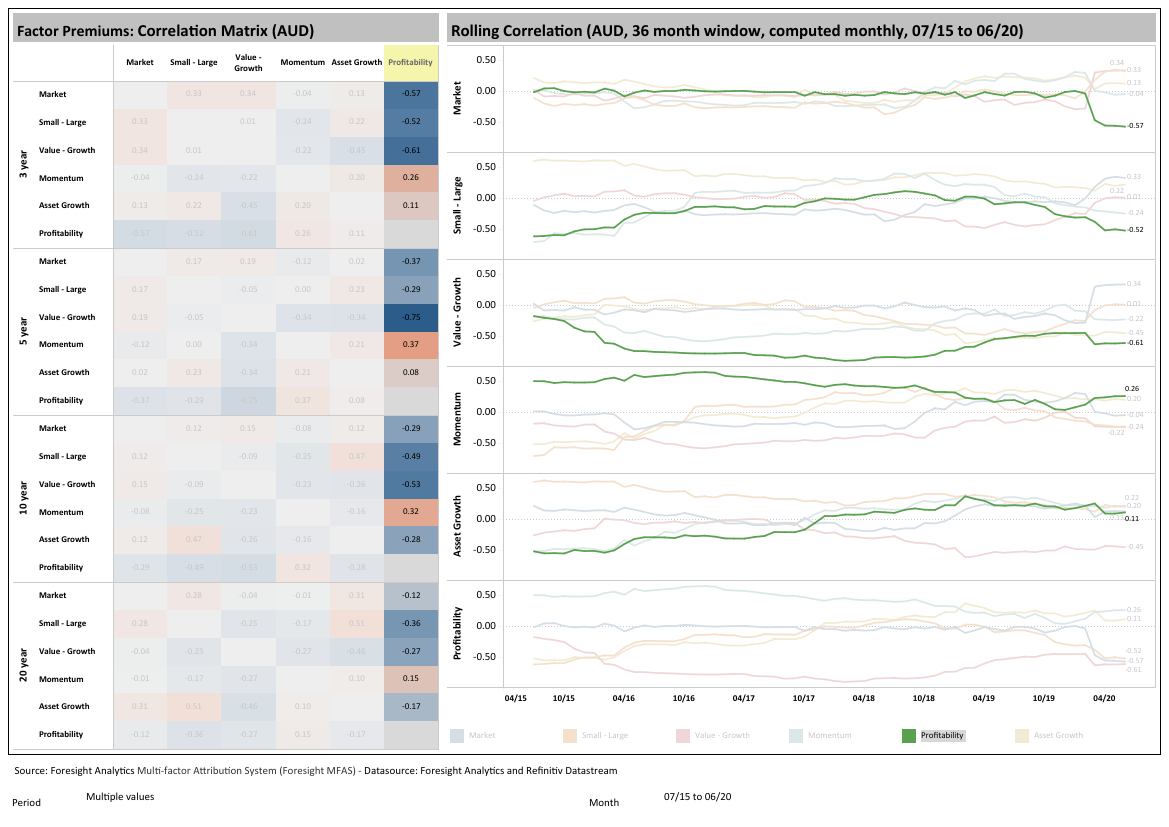
If we consider the Quality factor and its relationship with other factors, we note the following:
· The Quality factor premium is generally negatively correlated with other factors over the very long term (10 and 20 years).
· Over the medium term, our data shows that there is some positive correlation between Momentum and Asset Growth.
· The Quality factor premium is highly negatively correlated with the Value-Growth premium.
· The Quality factor is generally not correlated with the Market factor, but they are negatively correlated in times of crisis. This means the Quality factor is a good hedge for investors against risk and stress in markets, and one may consider having an allocation to this factor on a secular basis.
Exhibit 8: Quality Factor Correlation through time
Conclusions
Our analysis of the Australian share market, using the factor lens, unearthed some very interesting revelations. These insights are highly valuable for putting context around passive, smart-beta and active strategies. Based on the factor biases of your investment, various headwinds and tailwinds are imposed. It is important to have this context when evaluating your investment performance and making any decisions to hire or fire a manager.
The long-term performance analysis shows factors such as Momentum, Market and Quality, outperform others. In more recent periods, Growth has outperformed Value very strongly.
Within this long-term backdrop, it is important to understand the factor performance behaviour during stressed-market environments. The evidence suggests that Large Cap, Quality, Growth and Momentum tends to perform very well. Inversely, Market exposure, Value and Small Caps tend to do poorly.
Finally, our analysis shows that the correlation
between factors can drift over time. One factor that is generally negatively
correlated with most factors, and which offers a good hedge against market
turbulence, is Quality. Investors who have secular exposure to Quality in their
equity portfolios would find their portfolios more resilient to Covid-19 market
shocks which may continue for some time yet. Having an allocation to this
factor makes economic sense, as the profitable companies that are growing tend
to dominate their industry sectors in terms of share of profits and sales.
Never miss an update
Stay up to date with my content by hitting the 'follow' button below and you'll be notified every time I post a wire. Not already a Livewire member? Sign up today to get free access to investment ideas and strategies from Australia's leading investors.
Never miss an update
Enjoy this wire? Hit the ‘like’ button to let us know.
Stay up to date with my current content by
following me below and you’ll be notified every time I post a wire
Jay is the founder of Foresight Analytics, a leading provider of data driven research and consulting services to asset managers, asset owners and wealth groups. Jay has over 20 years of investment, research and portfolio management experience.
........
Disclaimer
The material contained in this document is for general information purposes only. It is not intended as an offer or a solicitation for the purchase and/or sale of any security, derivative, index, or financial instrument, nor is it advice or a recommendation to enter into any transaction. No allowance has been made for transaction costs or management fees, which would reduce investment performance. Actual results may differ from reported performance. Past performance is no guarantee for future performance.
Foresight Analytics has been paid a fee for strategic analysis and reporting; however, Foresight has drawn its conclusions independently and using its proprietary forensic based-process. Foresight staff involved in the production of this report do not hold any investments or interest in the strategy or the product provider. Foresight is not paid any success fee in association with the strategy.
This material is based on information that is considered to be reliable, but Foresight Analytics makes this information available on an “as is” basis without a duty to update, make warranties, express or implied, regarding the accuracy of the information contained herein. The information contained in this material should not be acted upon without obtaining advice from a licensed investment professional. Errors may exist in data acquired from third-party vendors, and in coding related to statistical analyses.
Foresight Analytics disclaims any and all expresses or implied warranties, including, but not limited to, any warranties of merchantability, suitability or fitness for a particular purpose or use. This communication reflects our quantitative insights as of the date of this communication and will not necessarily be updated as views or information change. All opinions expressed herein are subject to change without notice.

4 topics

Jay is the founder of Foresight Analytics, a leading provider of data driven research and consulting services to asset managers, asset owners and wealth groups. Jay has over 20 years of investment, research and portfolio management experience.
Jay is the founder of Foresight Analytics, a leading provider of data driven research and consulting services to asset managers, asset owners and wealth groups. Jay has over 20 years of investment, research and portfolio management experience.
Comments
Comments
Sign In or Join Free to comment