BetaShares Global Market Trends: April 2020
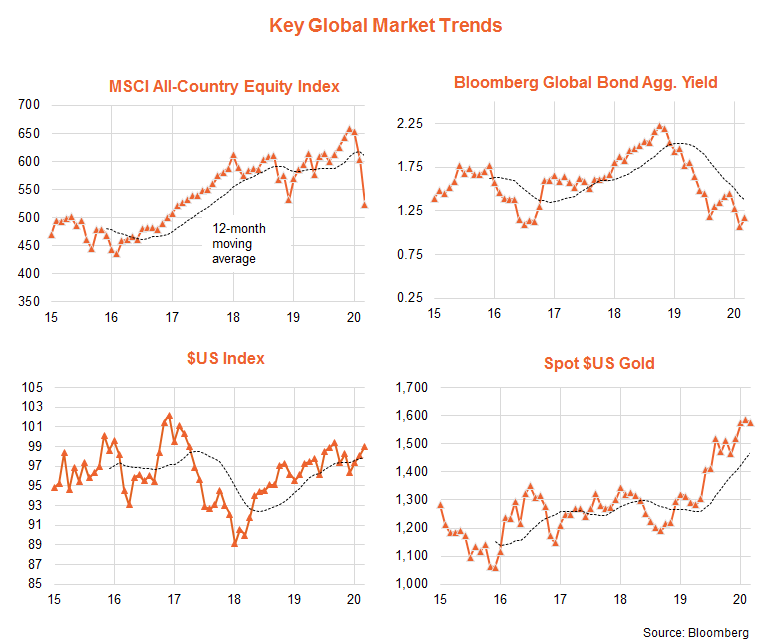
Key Global Trends – equities slump
The coronavirus-led ‘risk-off’ trade that started to build in late January continued into March, with the MSCI All-Country World Equity return index declining by 12.8% in local currency terms. Despite declining government bond yields, the yield on the Bloomberg Global Aggregate Bond Index actually edged up from 1.07% to 1.17% in the month – due to a major widening in credit spreads – resulting in this benchmark global bond index producing a negative 1.5% return. A global dash for cash caused the U.S. dollar to firm, while gold prices edged lower.
As seen in the chart set below, global equities and bond yields remain in a downtrend*, while both gold and the US$ remain in an uptrend.
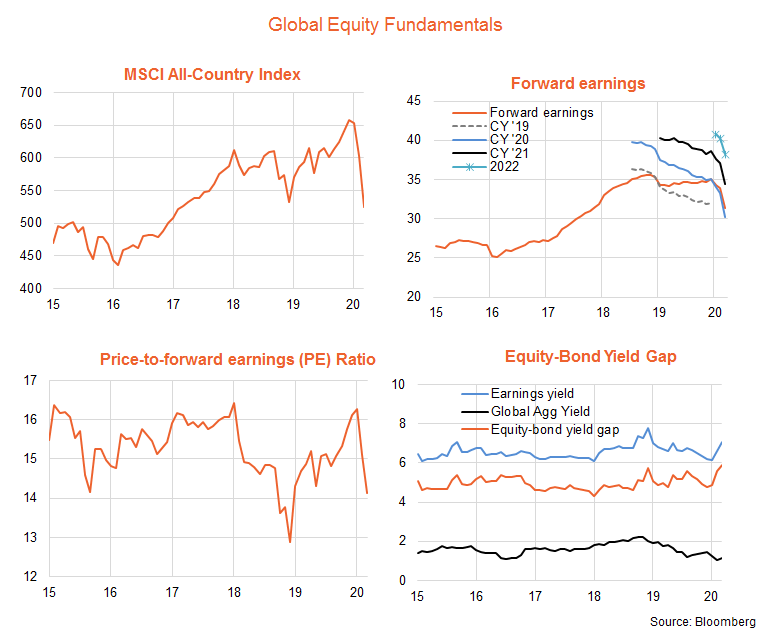
Global Equity Fundamentals – watch earnings
As seen in the chart pack below, the decline in global equities has pushed the price-to-forward earnings ratio from a high of 16.3 in January to near-average 14.1 by end March. The most notable development in the past month, however, has been the (understandable) slump in earnings expectations. Forward earnings have already declined by 10.6% since the start of the year. CY’20 earnings are now expected to fall 5.3% below CY’19 levels before rebounding by 14% in CY’21. However, these expectations are likely to drop substantially further in the weeks and months ahead (CY’20 earnings are predicted to fall by at least 20%) as the impact of global shutdowns on corporate earnings become evident.
Given the small increase in overall bond yields, the equity-to-bond yield gap (EBYG) (a measure of relative valuations) has pushed out to an above-average level of 5.9%. As noted last month, however, of concern is the likely continued downtrend in earnings expectations, which will tend to push up PE valuations unless equity prices also adjust downward to some degree.
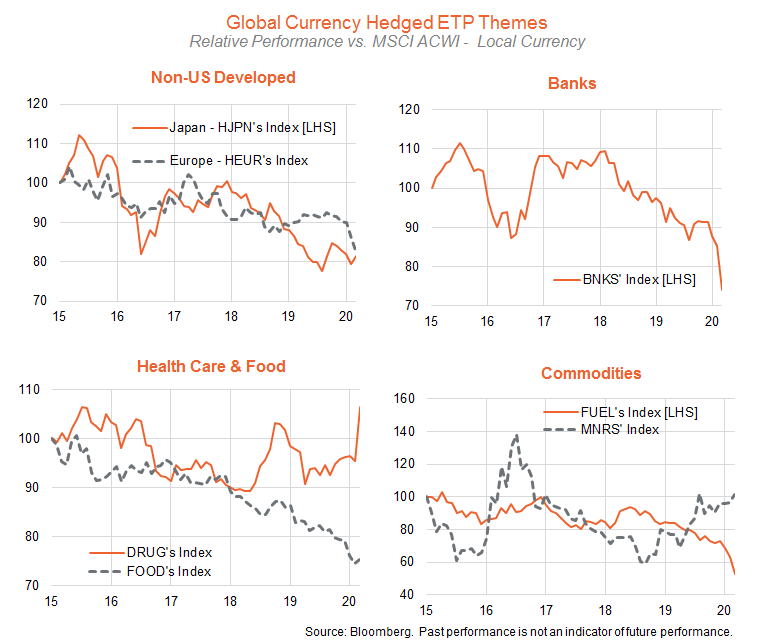
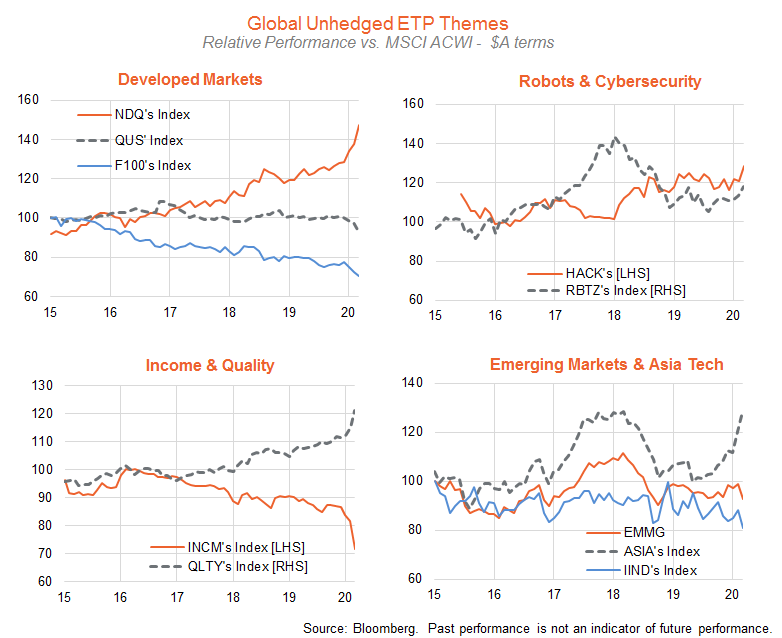
Global Equity Trends – health care, gold, technology & Asia
Across our ASX traded currency-hedged global ETFs, health care (DRUG) and global gold miners (MNRS) were the best performers in the month (though both still produced negative returns) and remain the strongest relative performers**. Financial and energy stocks are the worst performers, with each especially hurt by declining interest rates and oil prices respectively.
Among our ASX traded global ETFs, technology and Asia themes are holding up best, with the Asia technology ETF (ASIA), the tech-heavy NASDAQ-100 Index (NDQ) and global cyber-security (HACK) performing best in the month – though all still posted negative returns. ASIA, NDQ and global quality (QLYT) retain a positive overall trend* and have the strongest relative performance trends.
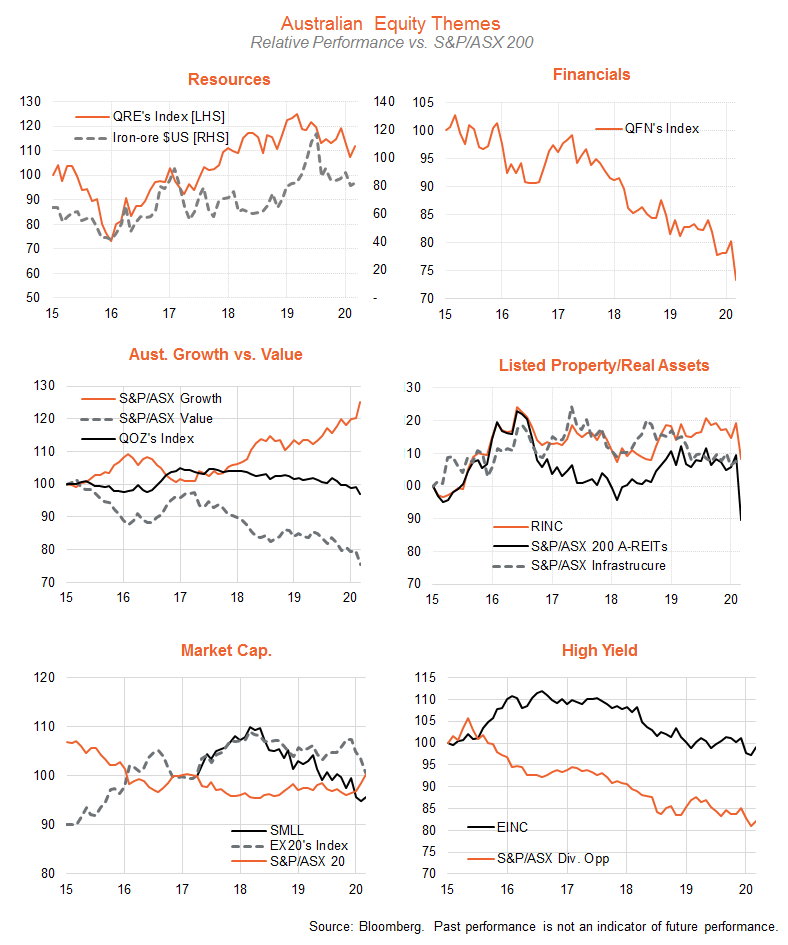
Australian Equity Trends – health care and consumer staples
Defensive sectors such as health care, consumer staples and telecommunications held up best last month, though all still suffered negative returns. Resources slightly outperformed, though along with financials remain in relative performance downtrends.
By factor, growth also continued to outperform value (the latter weighted down by banks), even though large cap stocks overall are holding up better than smaller/mid-cap stocks – as is to be expected in a “risk-off” environment. Even infrastructure and listed property have not been spared in last month’s sell-off, with the latter especially hurt by pressure on rents due to the shutdown of many businesses.
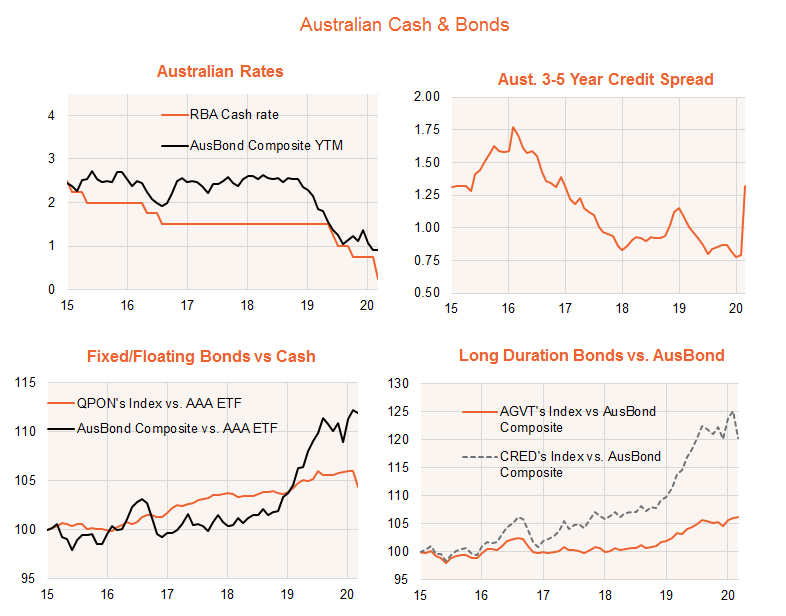
Cash & Bonds – government yields drop, credit spreads widen
As would be expected, government bond yields declined further in the month, helped by further RBA rate cuts and the central bank’s decision to explicitly target a 0.25% yield for 3-year government bonds. Credit spreads widened, however, reflecting concerns over the economy but also an element of market dislocation (caused by worldwide liquidation of both good and bad assets to build cash), which central banks are endeavouring to overcome through liquidity injections.
The net result was that the yield on the Bloomberg AusBond Composite Index (covering fixed-rate bonds issued by both governments and private corporations) edged only slightly lower in the month, from 0.92% to 0.90% – and this benchmark index of bonds slightly underperformed cash (as measured by the AAA ETF). Wider spreads saw senior bank floating rate bonds (QPON ETF) and long-duration corporate bonds (CRED ETF) under perform the AAA ETF and AusBond Composite respectively, while long-duration government bonds (AGVT ETF) outperformed the AusBond Composite.
Wider spreads also produced a negative return within the hybrids market during March, with the HBRD fund declining 4.6% (it’s performance benchmark declined by 6.3%) – which, nonetheless, again demonstrated hybrids have generally tended to fall less than equities in extreme risk-off environments.
Source: Bloomberg. Past performance is not indicative of future performance.
*Trend: Outright trend is up if the relevant NAV return index is above its 12-month moving average and the slope of the moving average is positive, and down if the index is below this moving average and the slope of the moving average is negative. No trend is displayed in all other cases. Relative trend is based on the ratio of the relevant return index to its broader Australian or global benchmark index.
**The ranking of performance is based on an equally-weighted average of 6 & 12 month return performance.
ETP Themes’ Charts – Source: Bloomberg. EINC and RINC commenced trading in February 2018; EMMG commenced trading in May 2019. For illustration purposes the performance information for the period prior to the inception date is based on the respective unlisted Legg Mason Martin Currie Equity Income Fund, Legg Mason Martin Currie Real Income Fund and Legg Mason Martin Currie Emerging Markets Fund, being comparable funds managed by Martin Currie Australia using the same strategy applied for EINC, RINC and EMMG. Performance is shown net of management fees. EINC, RINC and EMMG’s strategy is not constrained by a benchmark and is shown against the relevant benchmark purely for comparison purposes. Historic performance of EINC, RINC, EMMG or the unlisted funds, is not a reliable indicator of future performance.
Never miss an update
Enjoy this wire? Hit the ‘like’ button to let us know.
Stay up to date with my current content by
following me below and you’ll be notified every time I post a wire
Author, columnist, investment strategist and macro-economist. Previous roles at Federal Treasury, OECD, Macquarie Bank and AFR. I develop economic insights and portfolio construction strategies for BetaShares' retail and adviser clients.

1 topic

Author, columnist, investment strategist and macro-economist. Previous roles at Federal Treasury, OECD, Macquarie Bank and AFR. I develop economic insights and portfolio construction strategies for BetaShares' retail and adviser clients.
Author, columnist, investment strategist and macro-economist. Previous roles at Federal Treasury, OECD, Macquarie Bank and AFR. I develop economic insights and portfolio construction strategies for BetaShares' retail and adviser clients.
Comments
Comments
Sign In or Join Free to comment