Dow Drops -665pts; Our Take on Major Markets Now
Last week the ASX200 rallied an impressive +1.2% while other global markets sold off pretty aggressively e.g. US Dow -4.1%, UK FTSE -2.9%, German DAX -4.1% and the Japanese Nikkei -1.5%. Even if we include where the ASX200 is looking to open on Monday, following the 665-point / 2.5% plunge by the Dow on Friday night, we will be marginally positive. I have a spring in my step this morning as markets are following our anticipated path and opportunities look likely to present themselves in the relatively near future – this is a time to be excited not scarred, when holding ammunition (cash) as we are, to take advantage of weakness. It’s been far too long between periods of volatility for our liking!
I think this period of outperformance by the Australian market will continue while global stock markets are experiencing some weakness, especially if its driven by fears around bond yields / interest rates – the main focus of todays note will be around bond yields and where / why they appear to be rattling this almost 9-year old equity bull market.
It’s amazing how cyclical both markets and investor psychology are on a regular basis - since the start of the year I have been reading regular articles that a pullback for stocks will be healthy considering both the magnitude and duration of this bull market, however now one has begun people are suddenly concerned that it may be the end for stocks i.e. Investors believe corrections are healthy until they actually happen, people hate losing paper profits!
At this stage simply remember that since the GFC when the ASX200 drifts in January the quarterly low has occurred 80% of the time in early February i.e. fairly soon. Our ideal buy level for the ASX200 remains around 5950, 2.8% below Fridays close, it was easy to feel like we were missing out (FOMO) on Friday as the market roared through 6100 but following the latest tumble on global markets our patience looks likely to be rewarded..
ASX200 Daily Chart
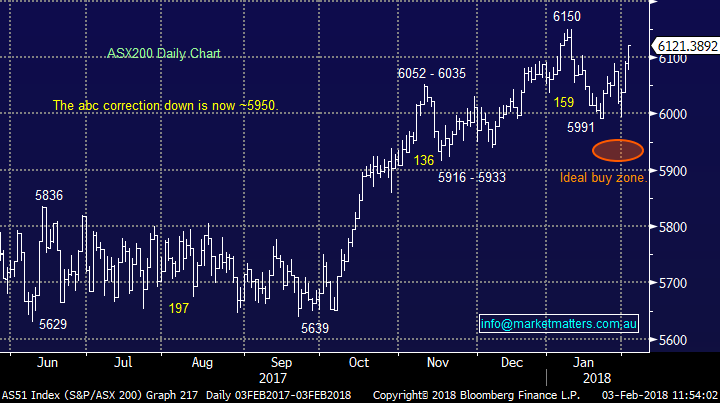
Due to the common February low since the GFC we have been comfortable sitting on ~17.5% cash in the MM Platinum Portfolio and 8% in the Income Portfolio / plus 35% in floating rate income securities seeing no reason to chase market strength at this point in time – although as I said we were beginning to feel pretty uncomfortable on Thursday / Friday!
Let’s reiterate what we said last week around corrections using 2 powerful statistics:
1. The ASX200 only experienced a 5% pullback last year but only ~once every 12-years has the index experienced such a small pullback.
2. The average annual pullback for the local market is well in excess of 10% e.g. In 2016 the ASX200 corrected 10%, following a classic early May high.
Thus, it would be very unusual to only see a 300-point correction in 2018, with a pullback of over 600-points far more likely – MM is highly likely to hold high levels of cash in its portfolios on a regular basis during 2018/9 with April / May the classic time to significantly reduce equity exposure.
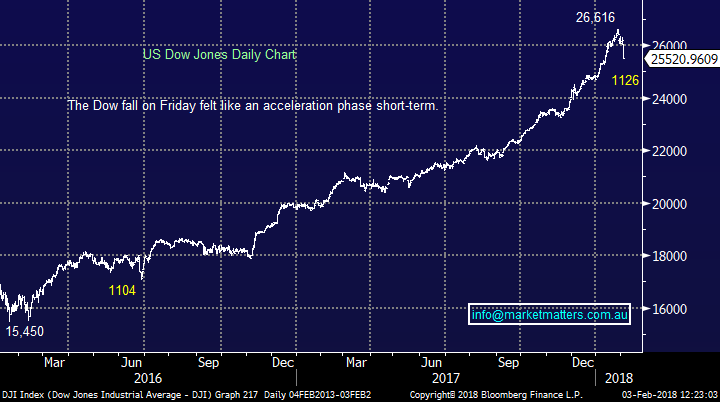
Last week US stocks had their worst week since January 2016. The standout of this pullback was the breadth with decent weakness essentially across the board which implies to us it has further to unfold.
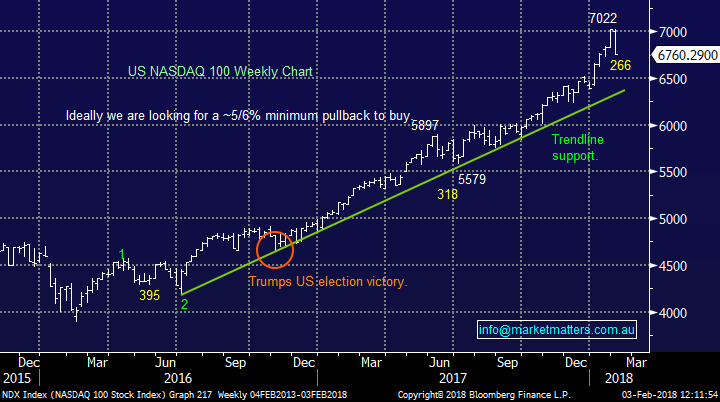
The S&P500 has corrected -3.9% in-line with the NASDAQ at -3.8%. We believe that the longest run in history for US stocks without a 5% correction is about to end but that’s hardly a big call now. Our ideal target for the NASDAQ is ~6450, another 4% lower which would simply challenge the long-term uptrend since mid-2016.
Our preferred scenario for US stocks is ongoing weakness towards the end of February, erasing most of Januarys gains, however importantly we expect local stocks to fair better and potentially bottom out earlier.
US NASDAQ Weekly Chart
Our view moving forward remains consistent with our 2018 Outlook Report:
1. Equity markets will rally in 2018 but with increasing volatility i.e. a warning of a pending much larger correction.
2. This initial sharp pullback is a buying opportunity, especially while the economic backdrop remains very supportive for stocks.
3. Investors who adopt a more active approach will enjoy 2018/9 the most.
US Dow Jones Daily Chart
At MM we have been calling interest rates higher for over a year and while this trend has been acknowledged by the market which is illustrated by the outperformance of say banks over real estate its only now that it’s causing some concern for equities in general.
A very important relationship to watch is that between US 2-year and 10-year bond yields, history tells us that equities may be in serious trouble when short term rates go above their longer term cousins. While we have been heading in that direction there still remains a large 0.7% gap.
US Bond yields Monthly Chart
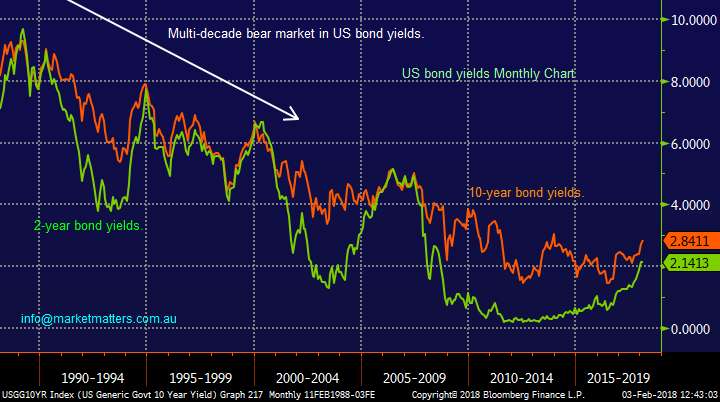
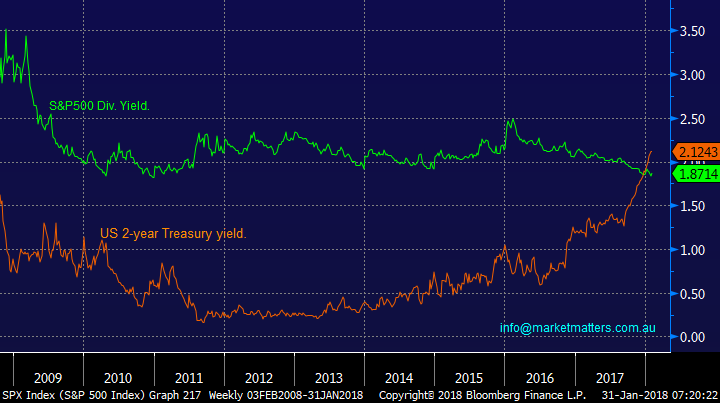
Last Wednesday we highlighted the below chart pointing out that risk free 2-year treasury bonds were now yielding more than equities which were trading on “rich / dangerous” valuations. As you can see from the above chart US 2-year bond yields have continued rising, probably being the catalyst for Fridays aggressive sell-off in stocks.
When stock markets rally on improved global economic factors rising interest rates are inevitable and we still believe interest rates in both the US and Australia remain artificially low compared to the health of their respective economies.
At MM we are bullish both interest rates and volatility.
US S&P500 Div. yield v US 2-year Bond yields Weekly Chart
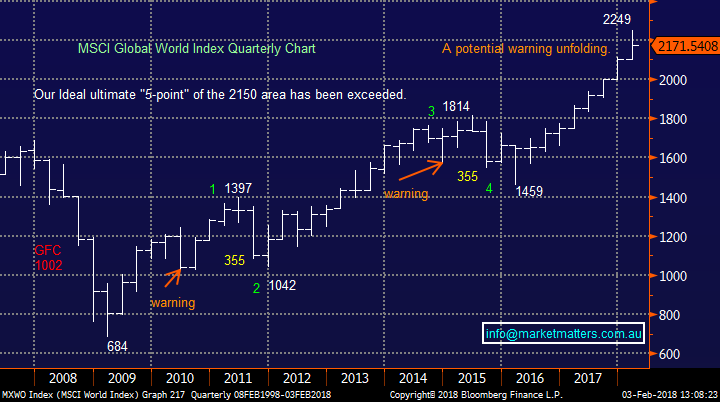
Global equities had become very extended into last week with the MSCI global World Index up +6.9% for the month and 54% since early 2016 i.e. the market was feeling like a tinder box waiting for a match.
MSCI Global World Index Quarterly Chart
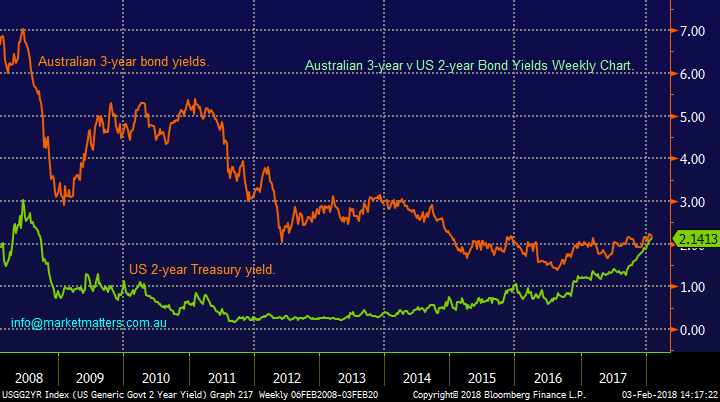
Many are probably wondering why our market escaped last week’s aggressive global stock market sell-off and the answer is fairly simple i.e. relative interest rates.
Over the last few years US 2-year Treasury yields have rallied strongly from 0.14% to reach yesterday 2.14%, actually accelerating up from ~0.5% since just mid-2016.
Conversely Australian 3-year bond yields are still treading water at 2.126%, up from the lows of 1.36% but below the levels of late 2015.
Unfortunately it's pretty clear that our economy, although chugging along reasonably well, in a relative sense has not experienced the level of improvement that has played out in the US, therefore bond yields have not moved up like their US counterparts which has triggered the selling that hit the US market last week.
Australian v US Bond yields Weekly Chart
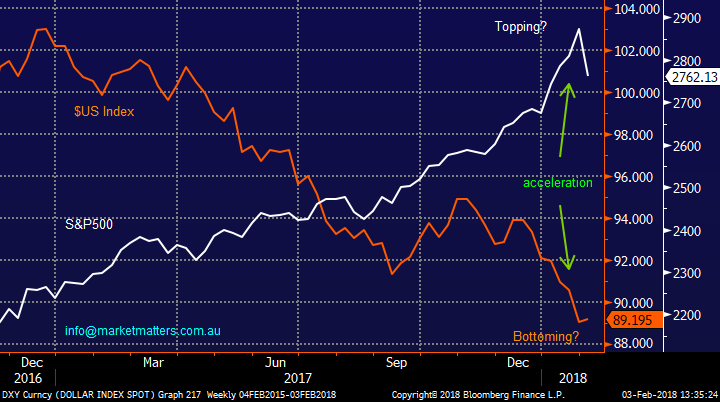
Those familiar with the recent MM Outlook Piece for 2018 understand one of our main calls for this year was in 2 parts:
1. The $US Index would make fresh multi-year lows down towards the 88 region – currently a big tick!
2. Following this weakness we are targeting a significant bottom and a rally of around 10% minimum.
Assuming we are on the money again with our $US fundamental / technical analysis there are potentially huge ramifications for equities in 2018 who have been moving in a perfect inverse manner to the $US.
1. If US interest rates / bond yields continue to surge then the $US should find some love on purely an interest rate differential basis.
2 Rising interest rates / $US implies more of last week i.e. increased volatility / pullbacks for stocks as they potentially climb an ever steepening wall of worry.
The speculative long position for the $US has been at multi-year lows adding significant weight / confidence to our $US higher opinion over 2018.
We continue to think the combination of bond yields and the $US is the key to successful investing in 2018/9.
The $US Index v S&P500 Weekly Chart
So how does this play into our view for Australian stocks / sectors?
Resources
While we remain bullish the resources into 2018/9 considering the sectors bull market is now 2-years old and we are looking for a $US low / interest rates higher we could easily see some pain short-term e.g. like Friday night.
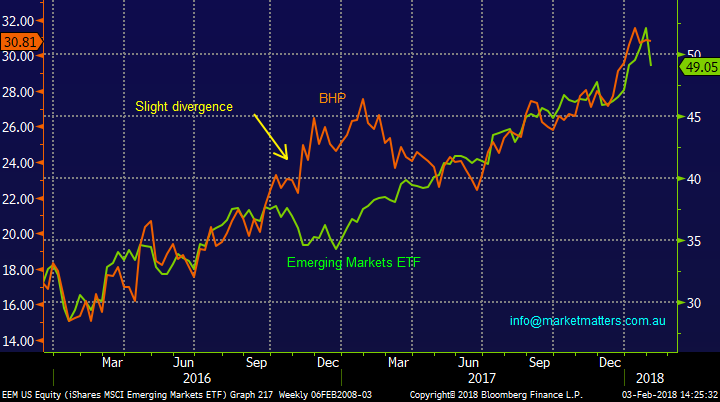
The following chart illustrates the strong correlation between BHP and the Emerging Markets (EEM) – the EEM fell 2.6% on Friday night and BHP is set to open down -2.1% on Monday morning. We believe there’s a 50-50 chance that the EEM can correct another ~3-5% hence we are unlikely to “chase” resource stocks early next week but we will still accumulate weakness if any of our “Shopping List” falls into our respective buy zones.
Resource stocks still look good but after a strong 2-year rally investors must expect / be prepared for some decent pullbacks in 2018.
BHP Billiton (BHP) v Emerging Markets ETF Weekly Chart
Banks
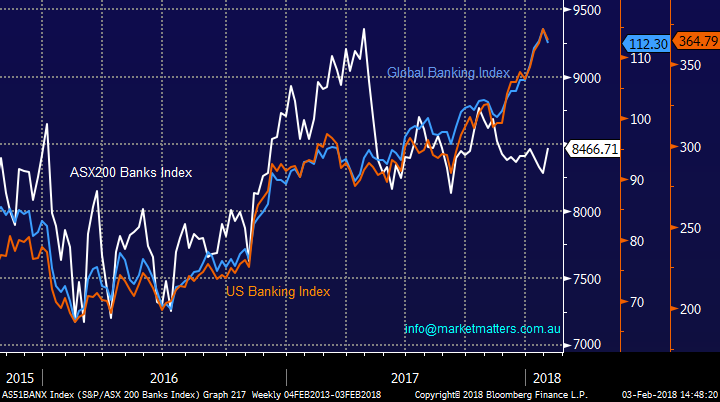
As we pointed out last week the Australian Banking sector had simply not participated in the global banking party which has embraced rising interest rates in an extremely positive manner. In fact our banking sector had been declining while others continue to make multi-year highs but finally last week we saw glimmers of optimism return to the sector as we rallied +1.94% while the US Banks slipped -1.9%.
Banking Indices Weekly Chart
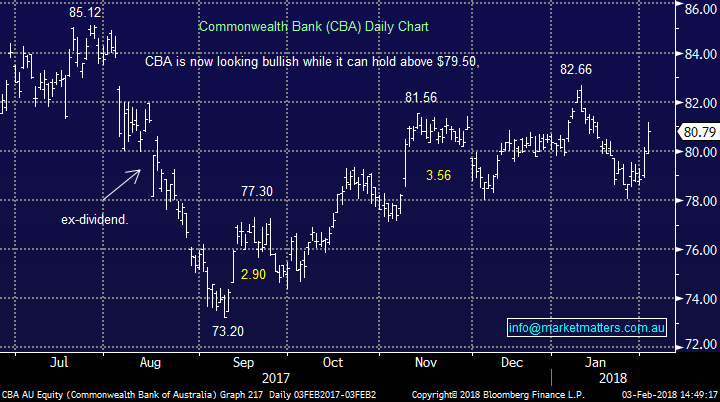
While the local banks may not offer significant growth over the coming years their yield should remain pretty solid, being active around these holdings / dividend periods will remain key.
We will likely add to one of our bank holdings on Monday.
Commonwealth Bank (CBA) Daily Chart
Energy
No change, we remain bullish crude oil and an extension towards ~$US70/barrel would not surprise, especially as many pundits have been targeting the $US60/barrel area – Fridays +$US65.45/barrel close remains encouraging.
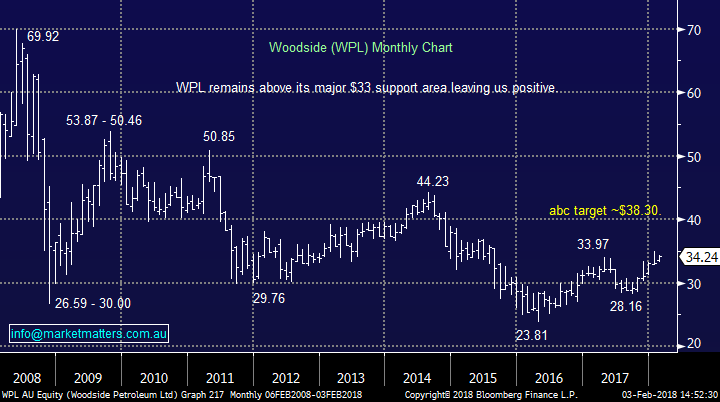
We still remain relatively comfortable with our exposure via Woodside Petroleum (WPL) ideally targeting the $38 area i.e. ~10% higher.
Woodside Petroleum (WPL) Weekly Chart
Gold
As discussed the $US has been very weak which has helped gold rally. However, if we are correct and the $US is close to a decent low then gold may be ready to underperform, especially as traders have been going long the most liquid ETF’s implying a short-term bullish view which could subsequently see some selling hit the sector very easily moving forward.
Bond yields / interest rates
It’s near impossible to find an analyst who doesn’t think bonds are going down / interest rates higher – we’ve actually been preaching this for many, many months!
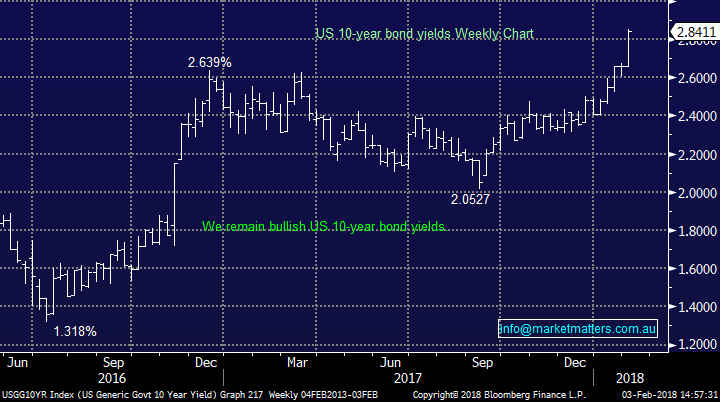
We believe fund managers have been scarred of missing out on the move from bonds to stocks, classic “Fear of missing out (FOMO)” which so often ends in disaster. Our warning is simple, watch US 10-year bond yields closely as they breakout to 3-year highs.If we see these yields fall back under say 2.55% MM advises caution as sentiment may change rapidly – not what we expect to unfold.
US 10-year bond yields Weekly Chart
Diversified Financials
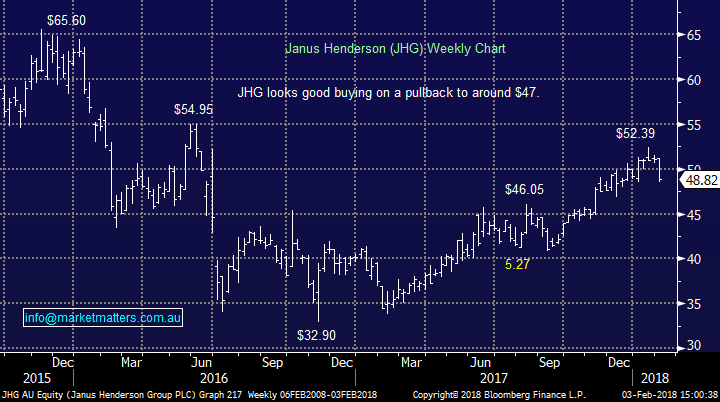
We remain bullish the Diversified Financials with an eventual target ~15% higher but this feels miles away at present!
We are considering adding to our JHG position around the $47 area / -3.7% lower.
Janus Henderson (JHG) Weekly Monthly Chart
Retail incl. Coles & Woolworths
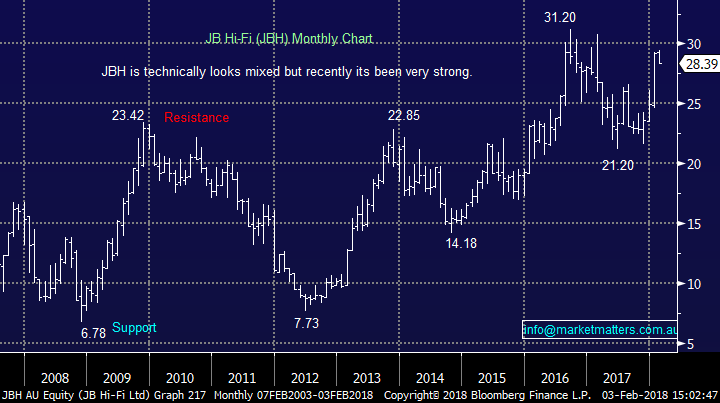
No change, we are cautious the sector but would consider buying panic weakness in some select stocks if the opportunity arises, especially those not heavily exposed to on-line threats. The recent rally in the likes of JB Hi-Fi may unfortunately indicate this horse has bolted.
JB Hi-Fi (JBH) Monthly Chart
Healthcare sector
We remain neutral the US Healthcare Sector, looking for potential sell signals, as interest rates rise – the US and Australian Healthcare Sectors are highly correlated.
However, conversely we are conscious that the Australian Healthcare Sector has excellent exposure to $US earnings which we believe will be a positive over 2018.
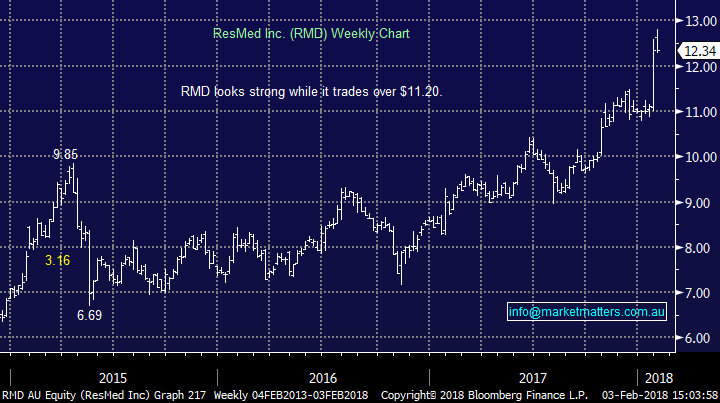
We continue to like RMD for both its $US earnings and very strong recent update – statistically stocks that perform well following a strong report continue to outperform the market.
ResMed (RMD) Weekly Chart
Global Indices
We probably all now know that the US market has enjoyed the longest streak in history without a 5% correction which will obviously come to an end one day i.e. The S&P500 has not experienced a 5% correction for 2-years / since Brexit!
It feels highly likely that that these bullish statistics will end next week with the big question if / when should we buy the pullback. The only clue we have at present is Fridays acceleration may have been a short-term washout but looking back to 2016 the likelihood is at best we see a few more weeks sideways to down before a clear bottom emerges.
US S&P500 Weekly Chart

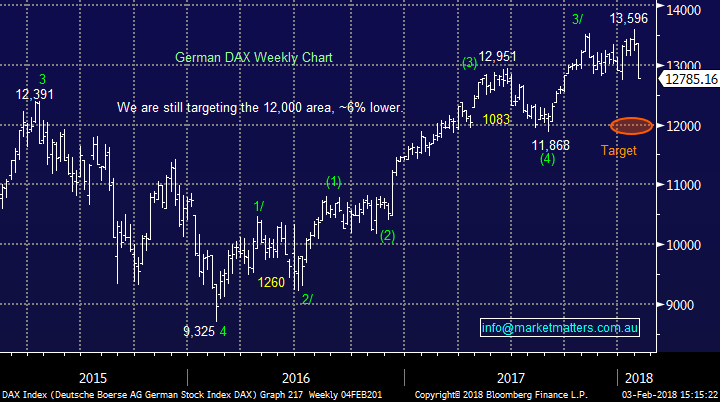
The European markets actually look clearer than the US at present and we still feel the DAX is headed towards 12,000 / another 6% lower.
German DAX Weekly Chart
Volatility
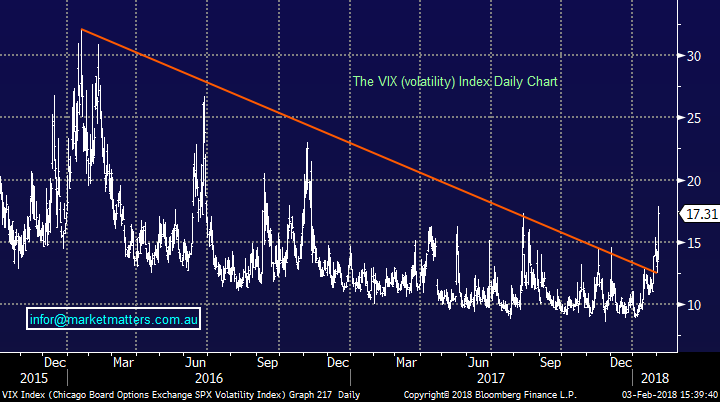
Volatility has clearly rallied strongly following Fridays 665-point plunge by the Dow. We have been expecting 2018 to be far more volatile than 2017 and this is playing out so far.
We expect the VIX to break above the psychological 20 area before this correction is complete.
Volatility / Fear Index (VIX) Daily Chart
Summary
We believe that bond yields / the $US are the key to stocks in 2018. Ideally we are looking for a short-term buying opportunity in coming weeks to increase our exposure to local stocks.
Our view is the rising bond yields currently creating havoc in global indices will have a noticeably reduced impact on the ASX200 as our bonds yields remain below their 2015 levels..
Also, commodities usually struggle when the $US / interest rates rises which should produce some good buying opportunities for the patient.
Have a great Sunday
James & the Market Matters Team
The above is a small extract from the Market Matters Weekend Report. To gain access to all reports for the next 14 days, including our picks into the impending market drop, CLICK HERE
Never miss an update
Enjoy this wire? Hit the ‘like’ button to let us know.
Stay up to date with my current content by
following me below and you’ll be notified every time I post a wire
James is Director & Lead Portfolio Manager at Market Partners - a collective of highly experienced investment professionals, operating independently, managing discretionary portfolios for wholesale investors.
James is also Portfolio Manager & primary author at Market Matters, a digital advice & investment platform with over 2500 members that offers real market intel & six portfolios open for investment.


James is Director & Lead Portfolio Manager at Market Partners - a collective of highly experienced investment professionals, operating independently, managing discretionary portfolios for wholesale investors. James is also Portfolio Manager &...
Expertise
James is Director & Lead Portfolio Manager at Market Partners - a collective of highly experienced investment professionals, operating independently, managing discretionary portfolios for wholesale investors. James is also Portfolio Manager &...
Expertise
Comments
Comments
Sign In or Join Free to comment