The momentum “bubble”
Charlie Aitken
Aitken Investment Management
What an extraordinary period in markets this is. I haven’t seen anything like this since the peak of the .COM bubble. When prices are moving irrespective or even inverse to fundamentals it remains very hard to remain disciplined in the investment process. It becomes easy to give in to FOMO (fear of missing out) and buy whatever stock or group of stocks are rising and buy into the “it’s different this time“ or “new normal” argument.
Trust me, it’s not different this time and there is no new normal. They are convenient phrases for completely losing investment discipline. I prefer no pain no gain which reflects my last six months of fund underperformance driven by adhering to an investment process that weights valuation and structural growth over pure momentum.
It’s a tough time to be disciplined and somewhat contrarian, but it will prove the right medium-term strategy as it always has.
Developed markets, particularly US equities have crushed returns in emerging markets but particularly China. Momentum stocks have crushed value stocks, with P/E being added way beyond earnings revisions. This is exactly what happened at the peak of the .COM boom where the “have’s” and “have nots” P/E divergence went off the charts, only to revert 2 years later completely the other way.
This has been the same in Australia where mid and small-cap industrials have crushed broader value stocks.
Credit Suisse did some interesting work on P/E additions/subtractions post the August Australian reporting season. Using the ASX, the team looked at the 4 weeks of EPS changes over August and compared them to share price changes to get an implied PE re-rate / de-rate. While the average PE re-rate was +3.8% (with EPS downgrades of -2.5% v. share price moves of +1.3%) the moves at both ends of the sample were extreme.
Top 20 PE re-rates
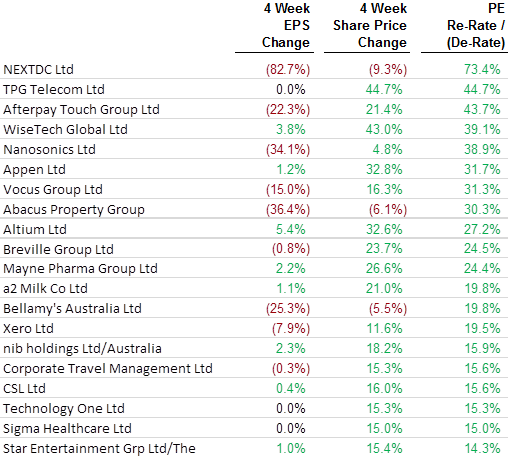
Source: Credit Suisse
The table above shows some huge share price moves with small corresponding EPS changes which have led to large PE re-ratings. A number of the stocks on the list are tech companies, and while EPS upgrades are probably not the key driver for the market, CS notes the revenue upgrades were still nowhere near the share price reactions.
Top 20 P/E de-rates
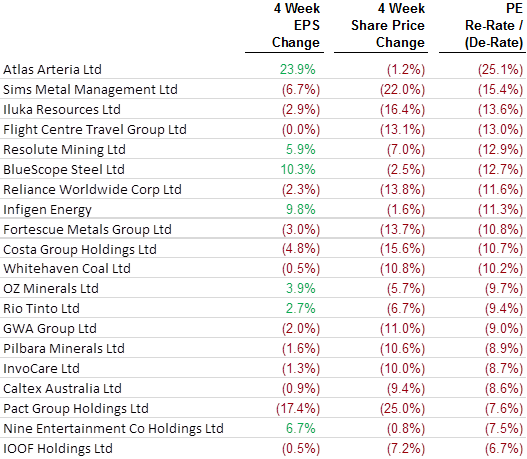
Source: Credit Suisse
August globally saw more of the same. Positive returns for global equities (+1.2%) masked stark divergences between the US and Rest of World. The S&P 500 gained +3.3% in August, while stocks in Europe, Japan and EM were down on the month. EM assets saw a particularly sharp decline, with Brazilian equities down 11.4% (in USD), EM $ credit spreads widening 58bp and the EM FX index falling 3.7%. Within global equities, the spread between ‘Growth’ and ‘Value’ performance in August was at 2.9% and US tech was the best-performing global sector. Trade-weighted USD was stronger in August (+1.2%), with USD appreciating against most of the G10 (except JPY and CHF) and EM currencies.
US Dollar strength and “trade war” rhetoric ahead of the US mid-term elections have driven unprecedented outperformance of US equities over all other developed and emerging markets. In fact, it’s clear that fund managers have been rotating to US equities from all other developed and emerging markets due to short-term uncertainty. The outperformance of US equities is broadly unprecedented, but particularly US technology shares. The NASDAQ 100 Index has outperformed the Shanghai Composite Index by +39% this year.
We believe this underperformance is being driven by an unsustainable rotation.
Asia facing structural growth stocks have become value due to the unprecedented rotation from emerging markets ETF’s to developed markets. The world’s largest Emerging Markets ETF (EEM.US) now has 17% of its free float shorted. That degree of short interest has historically proved a contrarian signal.
I remain strongly of the view that despite short-term underperformance the investment case for our key structural growth stock investments remains compelling. This is particularly so after the recent Hong Kong reporting season broadly exceeded our estimates. While HK stocks fell in August, driven by rotation to developed markets (DM), we simply believe we are buying structural earnings growth at cheaper multiples than previously. Later in this note, we will look specifically at Ping An Insurance (2318.HK) as an example of a high conviction investment case.
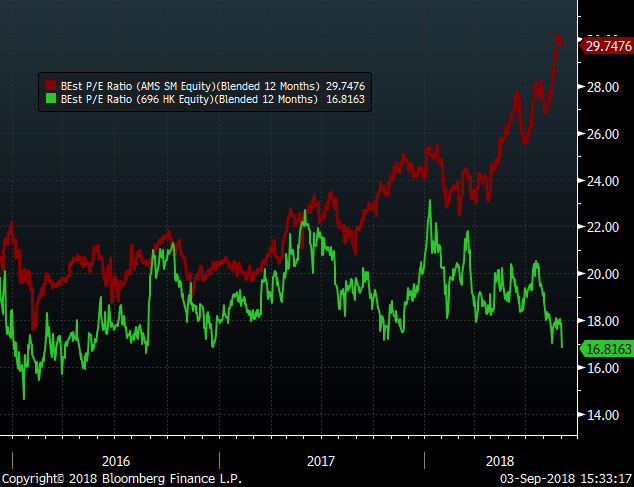
The reason is for my Asian biased positioning is valuation. Below is a P/E chart of Travelsky vs Amadeus IT Group (AMS.SP). Both are GDS airline looking systems. The blended forward P/E of Travelsky is 16.8x vs 29.7x for Amadeus. Travelsky offers prospective EPS growth of +16% vs +4.5% for Amadeus. Travelsky has 20% of its market cap in cash vs AMS with $2.5b in debt. We believe Travelsky is unquestionably cheap on all investment criteria.
The Ping An Insurance Company remains in the funds top 5 holdings. Today we thought it would be useful to update you on our investment thesis on Ping An. It is a classic example of a structural growth stock on a value multiple.
During the month Ping An reported a solid first half result which exceeded market expectations. Key highlights of the result as follows:
- Group operating profit of RMB59.3bn (+23% yoy) with strong performance at each key divisional level, particularly the core Life & Health insurance division and the Fintech & Healthtech businesses.
- Declared an Interim dividend of RMB 0.62 per shares (+ 24% yoy). Whilst the current dividend yield is a relatively modest 2.9%, Ping An has grown its dividends at a compound rate of over 50% per annum over the past 4 years and full year dividends are likely to be up another 25-30% this year
- EPS of RMB 3.25 per share (+34% yoy) versus consensus expectations of RMB 3.06. First-half EPS has contributed around 59% of the current full-year consensus earnings, suggesting further earnings upgrade potential
Ping An made solid progress in adding customers to the company’s eco-system of businesses and is continuing to have success in cross-selling multiple products into its client base. As at 30 June the company had 179m retail customers (up from 143m in June 2017) and each customer held on average 2.39 contracts with the group (up from 2.28 in June 2017). This cross-selling opportunity is a key advantage of Ping An over its competitors and a major motivating factor for its agent-based sales force. As cross-selling penetration increases, so does the agent commission pool, in turn driving growth in the number of agents in a virtuous cycle.

At current prices, Ping An trades at around 11.8x consensus CY18 EPS and around 9.8x CY19 EPS. Believe it or not, that’s a cheaper multiple than the structurally challenged AMP in Australia.
While it was another frustrating month of performance for the those of us adhering to a disciplined investment process, I take comfort that we have worn a lot of pain in an unprecedented rotation yet we will come out the other side owning the best structural growth businesses in the world at what I believe will prove cheap multiples.
Quality and duration are rarely on sale. I have used this period to increase both the quality and duration of the portfolio at fire-sale multiples in a genuine Asian capitulation.
I think the BATS (Baidu, Alibaba, Tencent and Samsung) will prove excellent medium-term investments at current prices. I also think PING AN and Travelsky are structural growth stocks trading on value multiples. JD.COM has also been grossly oversold in recent weeks.
On the other side of the equation, I think its time to be very, very cautious on pure momentum stocks that have simply added P/E over the last six months. That includes Australian industrial small and mid-caps.
When China and EM bottoms, the rotation will go the other way and P/E added by popularity in a narrow band of “have” stocks will reverse. Falls could be 25% to 50% and the stocks would still be expensive.
Price is what you pay, value is what you get. I’m happy to buy the best of Asia and avoid stocks that can't in any way be justified by conventional valuations approaches.
Small and mid-cap Australian industrials do look a classic bubble to me as do vast parts of the “next generation” technology sector globally. I wonder whether the recent Afterpay (APT) placement was the bell ringing. Investment discipline will be rewarded.
Further insights
For more analysis from the team at Aitken Investment Management, please visit our website
Never miss an update
Enjoy this wire? Hit the ‘like’ button to let us know.
Stay up to date with my current content by
following me below and you’ll be notified every time I post a wire