TOL - 1st Jul, 2025
The US dollar is tanking! What it means for gold, copper, Bitcoin, and the global economy
A sliding US dollar could reshape global markets – here’s what it means for commodities, Bitcoin, and the investing landscape ahead.
President Trump’s “Make America Great Again” (MAGA) agenda has often included protectionist trade policies, tariff impositions, and efforts to boost US manufacturing competitiveness – all of which can exert downward pressure on the US dollar.
During his first term, Trump repeatedly criticised a strong dollar, arguing it put American exporters at a disadvantage. His administration has hinted at direct intervention in currency markets and pushed for lower interest rates to keep the dollar subdued.
Well, direct intervention or not, it looks like the President is about to get his wish. The US dollar is flirting with its lowest levels in nearly two years, and my charts suggest it could go substantially lower. It’s a development that could carry sweeping ramifications – not just for the American economy – but for global markets as a whole.
As the world’s primary reserve currency and the benchmark pricing unit for most commodities and cryptocurrencies, shifts in the dollar's value reverberate far and wide.
%20ICE%20chart%2025%20Jun%202025.png)
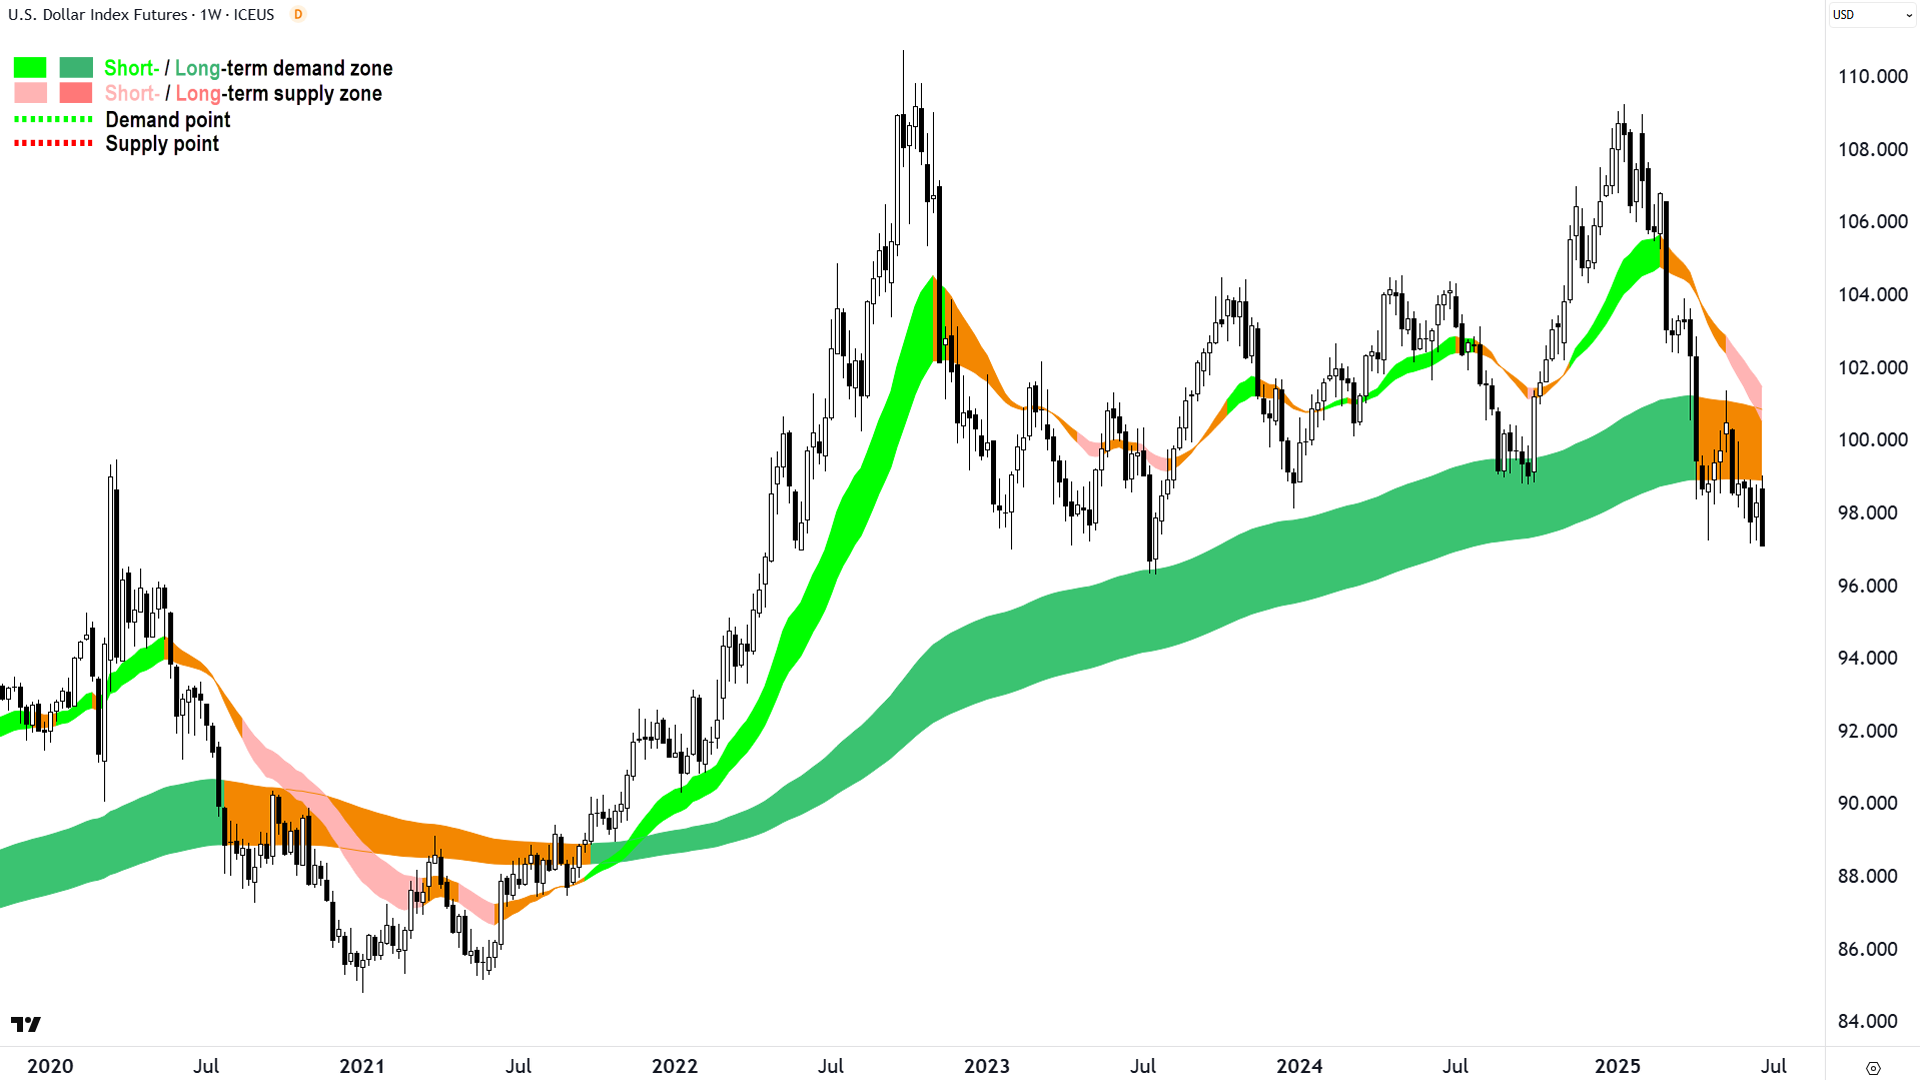
The chart above shows the US Dollar Index (DXY) on a weekly periodicity. The DXY measures the value of the US dollar against a basket of six major currencies, reflecting its overall strength in global foreign exchange markets.
My technical model shows the DXY has broken below its long term trend, with a strengthening short-to-medium term trend in place. Only the July 2023 low of 96.28 stands in the way of a potential break to substantially lower levels – possibly as low as the Jan-Jul 2021 trading range between 84.79-89.10.
This article examines the forces currently dragging on the US dollar and outlines the likely outcomes if this trajectory continues. I’ll also includes charts highlighting how gold, copper, and Bitcoin performed during prior episodes of dollar depreciation, to help illustrate what may lie ahead.
What’s driving the dollar lower?
Several powerful macroeconomic and geopolitical forces are converging to put pressure on the US dollar. While none are new, their cumulative effect is becoming difficult to ignore.
De-dollarisation
- A growing number of nations, particularly in the BRICS bloc, are actively reducing their reliance on the US dollar in trade settlements.
- Bilateral deals between China and Russia, India and the UAE, and others to use local currencies are eroding US dollar's dominance.
Trump’s Trade War
The Trump administration's trade policies, of which sweeping tariffs are the mainstay, threaten to damage US-rest of the world trade flows and weaken confidence in the US dollar as a stable global medium.
Slowing US economic growth
- Recent data suggest cooling consumer demand, a softening labour market, and sluggish manufacturing activity.
- Slower US economy growth usually results in lower investment demand for US assets and investments in businesses leveraged to the US economy, a negative for the US dollar.
Expectations of lower US interest rates
- As a result of the last item, and with inflation now considered largely under control, markets are pricing in several more rate cuts by the Federal Reserve.
- This tends to lower the yields on US risk-free assets, making them less attractive to foreign capital, pressuring the US dollar.
Ballooning US fiscal deficits
The US Treasury continues to issue debt at a historic pace, raising concerns about long-term sustainability, a structurally weak fiscal backdrop reduces confidence in the US dollar over the long term.
Deteriorating geopolitical positioning
- Increasing global tensions / sanctions on perceived aggressors (e.g. Russia) has led some countries to hedge currency risk by diversifying their reserves away from US dollars.
- A multipolar geopolitical landscape is undermining US monetary hegemony.
How a weaker US dollar affects dollar denominated assets
A falling US dollar doesn’t operate in a vacuum. It directly alters the dynamics of markets where the US currency serves as the unit of account, most notably in commodities and digital assets like Bitcoin.
As the US dollar depreciates, the purchasing power of other currencies rises, potentially increasing demand for hard assets like commodities and alternative stores of value like Bitcoin. This feedback loop can materially reprice key benchmarks and trigger capital flows across sectors.
Commodities tend to rise
- Most global commodities, e.g. oil, base and precious metals, agricultural commodities etc., are priced in US dollars.
- When the US dollar weakens, foreign buyers effectively get a discount, potentially increasing global demand and driving prices higher.
Precious metals shine
Gold and silver are historically viewed as hedges against fiat currency debasement, a falling US dollar typically sees investors rotate into these “hard” assets to preserve real purchasing power.
Base metals benefit
Industrial commodities like aluminium, copper, nickel, tin, and zinc tend to gain as a weaker US dollar spurs global infrastructure spending as it effectively lowers import costs for emerging markets.
Bitcoin gains appeal as ‘Digital Gold’
- Bitcoin is often perceived as a hedge against inflation and currency debasement.
- In prior cycles, most notably 2020–2021, Bitcoin surged amid US dollar weakness, abundant liquidity, and low interest rates.
- A falling US dollar could renew institutional interest in Bitcoin as a macro asset.
Lessons from History: Charting the correlation
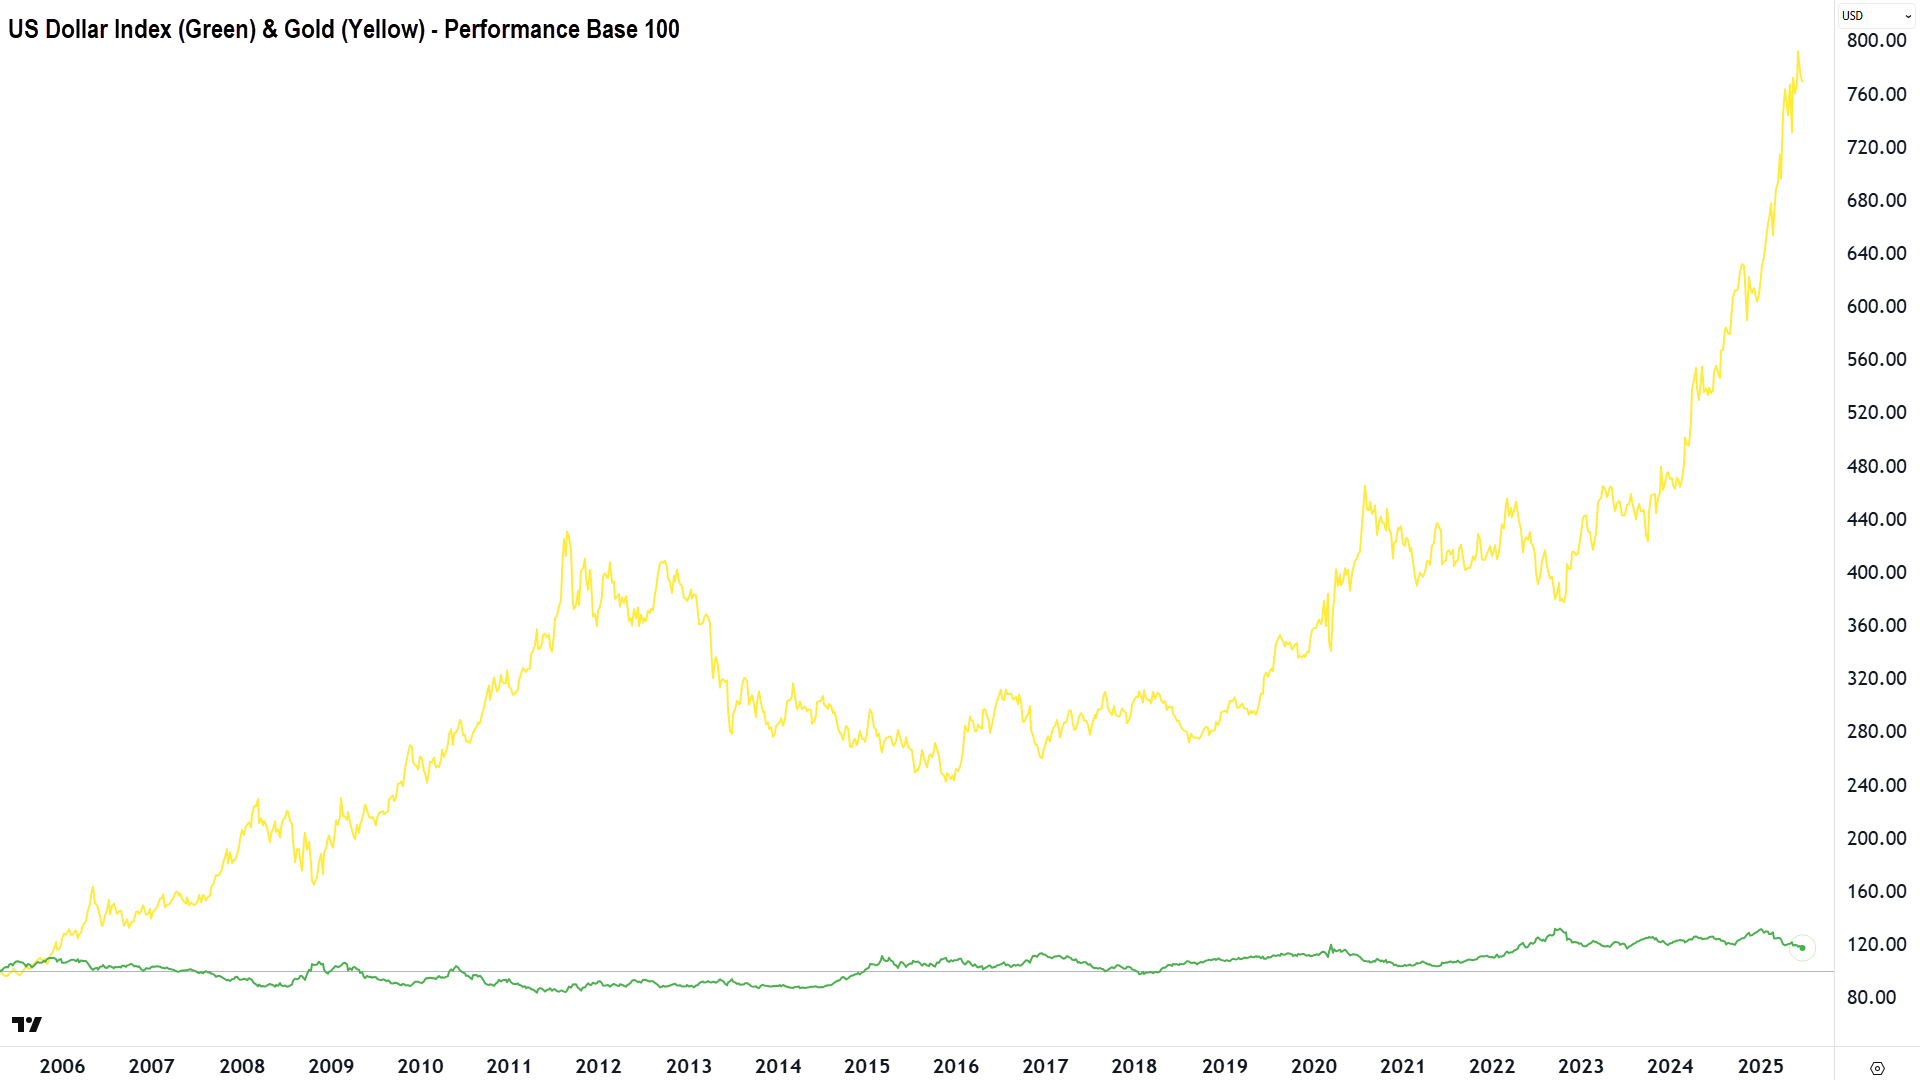
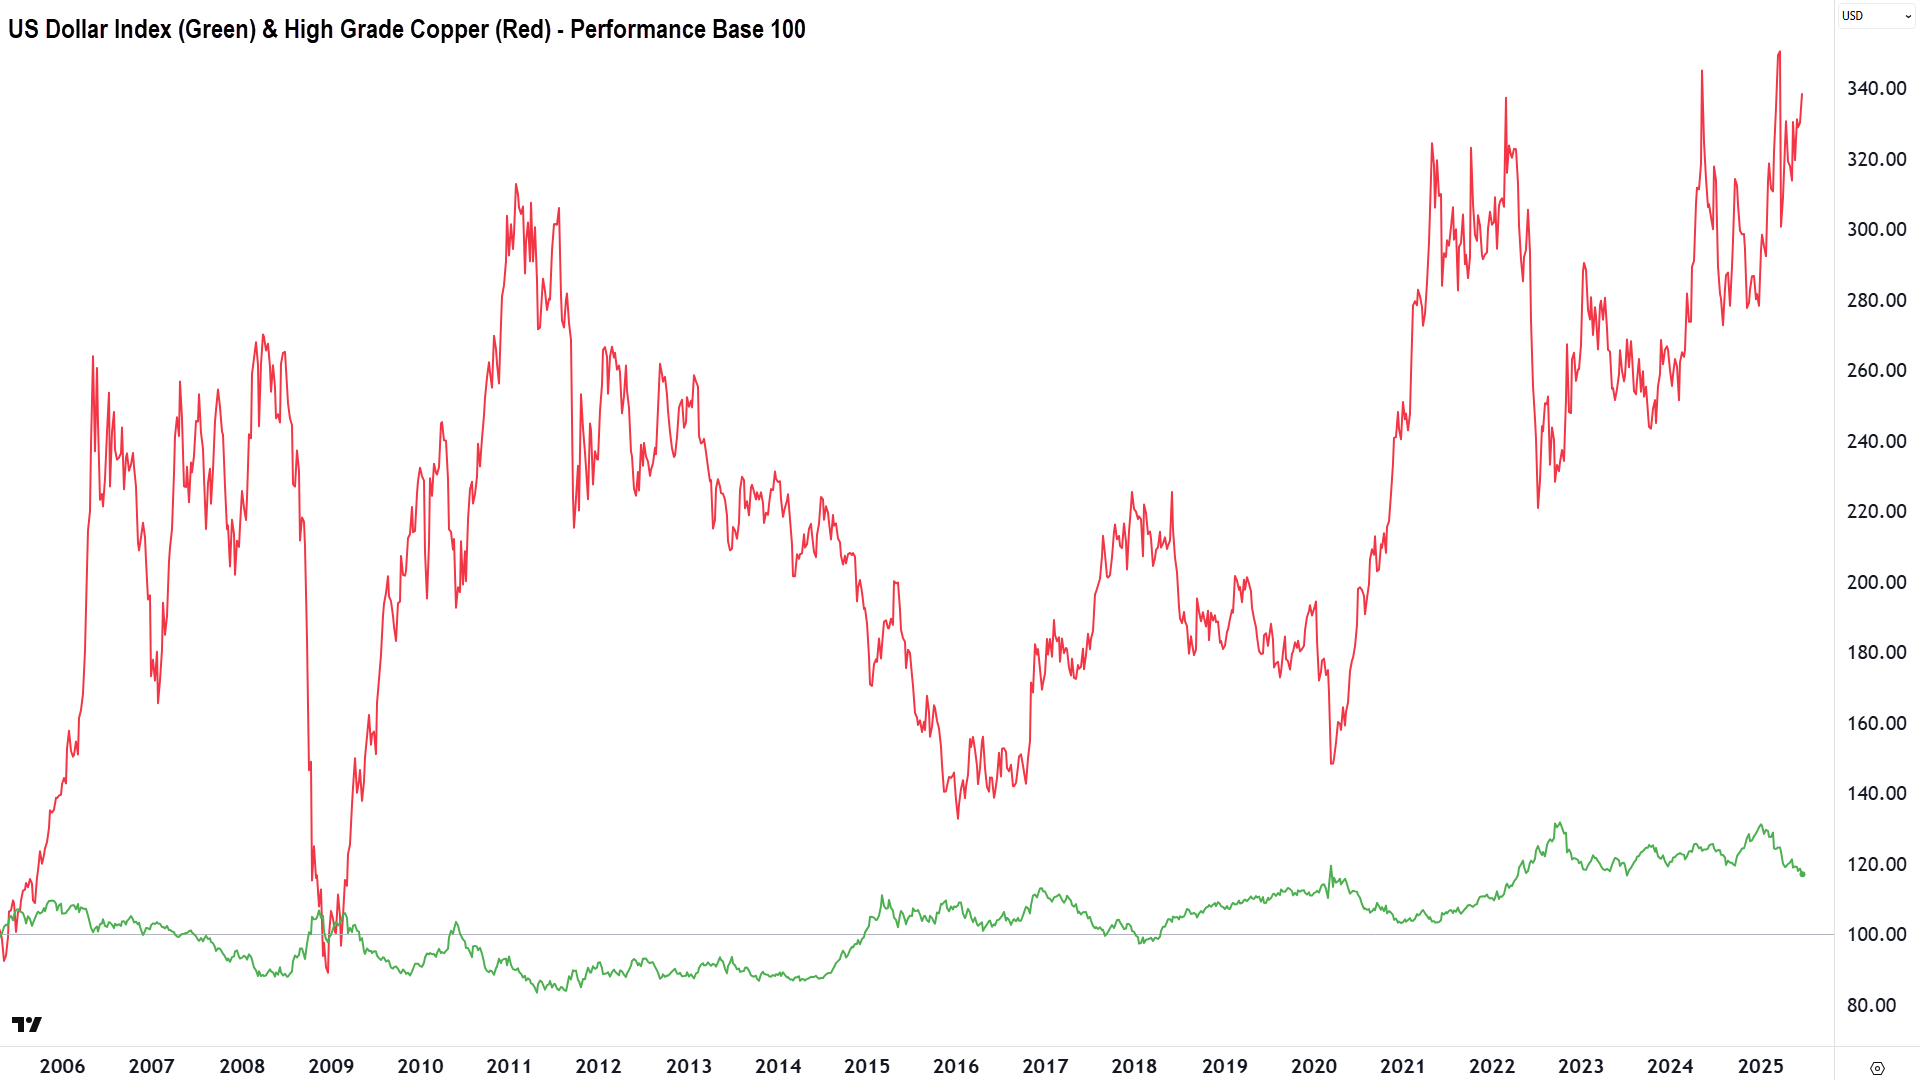
Let’s investigate the historical impacts of the US dollar on gold, base metals, and Bitcoin. We’ll use copper as a proxy for base metals. Below, I have three charts showing the relative performance of the DXY against gold, copper, and Bitcoin.


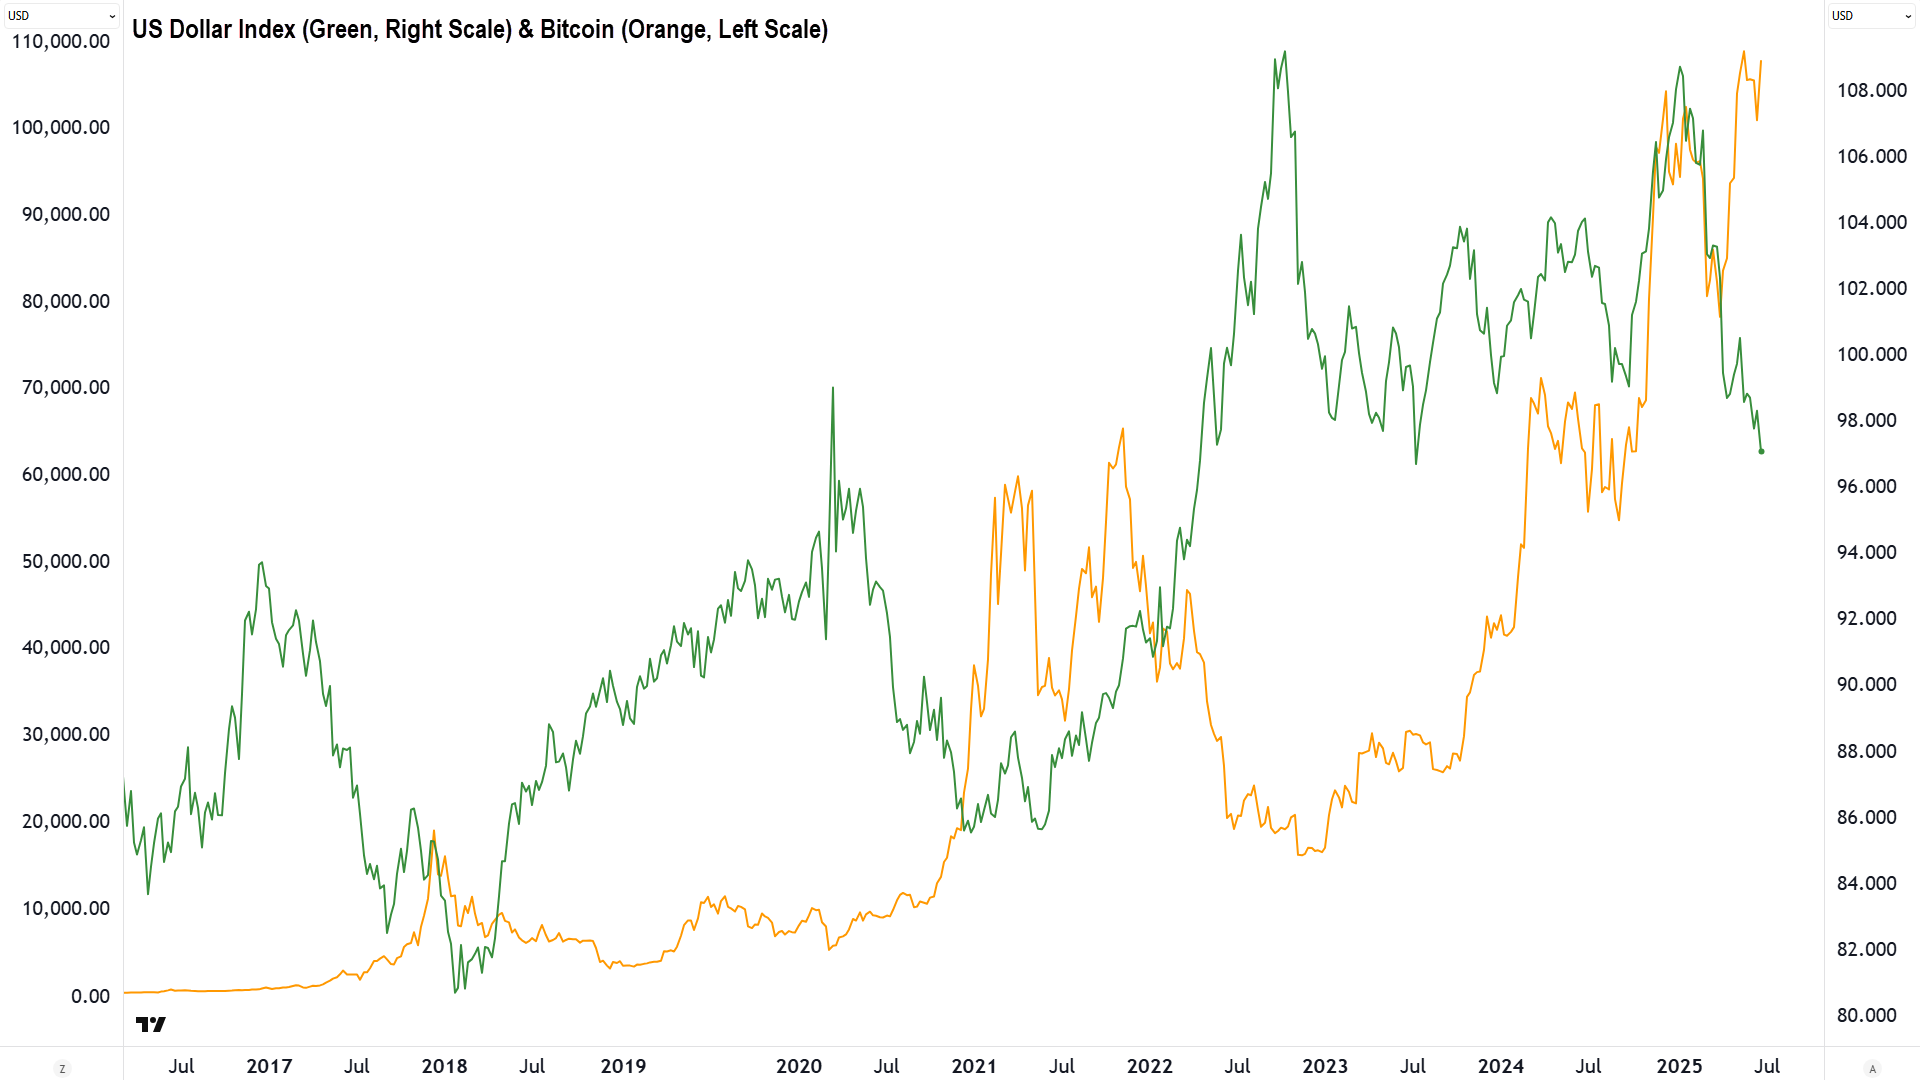
For the first two, I have used 20 years of data and started the DXY and its respective counterpart at a base of 100. For Bitcoin, this is impractical given Bitcoin’s massive gains over the period (DXY appears as a flat line!). For this reason, I’ve scaled the lookback period down to 10 years, and whilst I know it’s far from ideal, I had no choice but to plot the DXY and Bitcoin on separate scales.
The goal in all cases, is to see if we can visually identify periods where the DXY and its counterpart tended to show similar relative trends (for example, when the DXY rises/falls, did the other tend to rise/fall?). There are at least some warm visual cues in each chart to suggest there's a negative correlation between the DXY and gold, copper, and Bitcoin – i.e., when the DXY rises/falls the other asset tends to fall/rise.
A picture tells a thousand words, but to take the guesswork out of simply eyeballing charts, I also calculated the correlation coefficient for the DXY versus gold, copper, and Bitcoin respectively. A quick refresher for those who haven’t thought about correlation coefficients since high school!
This correlation coefficient is a value between -1 and 1, where:
- +1 = perfectly positively correlated
- 0 = no correlation
- –1 = perfectly negatively correlated
The correlation coefficients were:
- DXY-Gold (over the last 20 years): -0.49
- DXY-Copper (over the last 20 years): -0.37
- DXY-Bitcoin (over the last 10 years): -0.07
The correlations reveal distinct relationships between the US dollar and these three key assets. Gold shows a moderately strong negative correlation, reinforcing its role as a traditional hedge against dollar weakness and fiat currency debasement. Copper also shows a moderately strong negative correlation, reflecting its status as a globally traded commodity sensitive to both industrial demand and exchange rate shifts. Bitcoin, however, shows a much weaker inverse relationship, suggesting its price is less likely influenced by the US dollar.
Conclusion: The dollar’s next move matters
The technical trend in the US dollar is clearly down, and arguably the macroeconomic forces behind this trend show little sign of reversing. From the US’s structural deficits, slowing economy and expectations of lower interest rates, to de-dollarisation trends, the drivers of possible further US dollar weakness are now broad and entrenched.
The data suggests that if the US dollar continues to fall, hard assets like gold and base metals, like copper, are likely to be beneficiaries should historical trends persist. Bitcoin’s response may be more muted, but it may also be supported by a weaker US dollar.
The situation remains dynamic. A surprise uptick in inflation due to US trade policies, or a geopolitical flashpoint could halt or reverse the dollar’s decline (as historically, the US dollar has been seen as a safe haven asset). Investors must therefore continue to watch the data and the trends closely. Hopefully this article will serve as an ongoing reference point for this topic, because as always, to be forewarned is to be forearmed.
This article first appeared on Market Index on Thursday 26 June 2025.
Never miss an update
Enjoy this wire? Hit the ‘like’ button to let us know.
Stay up to date with my current content by
following me below and you’ll be notified every time I post a wire
Carl has over 30-years investing experience and has helped investors navigate several bull and bear markets over this time. He is a well respected markets commentator who specialises in how the global macro impacts Australian and US equities. Carl has a passion for technical analysis and has taught his unique brand of price-action trend following to thousands of Aussie investors.
........
Investing is risky. Inevitably you will endure losses. If you can't cope with losing, don't invest.

%20ICE%20chart%2025%20Jun%202025.png)
5 topics
9 stocks mentioned

Carl has over 30-years investing experience and has helped investors navigate several bull and bear markets over this time. He is a well respected markets commentator who specialises in how the global macro impacts Australian and US equities. Carl...
Carl has over 30-years investing experience and has helped investors navigate several bull and bear markets over this time. He is a well respected markets commentator who specialises in how the global macro impacts Australian and US equities. Carl...
Comments
Comments
Sign In or Join Free to comment