Why is a correction looming?
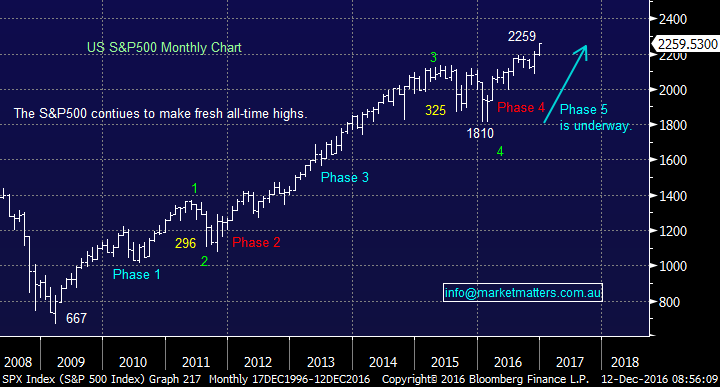
We look at markets in a number of ways combining fundamentals, seasonality, statistics and technical analysis - we never understand somebody that does not use all the information at their fingertips! Firstly, over the last 2 years we have regularly referred to the monthly US S&P500 chart illustrating the "5 Phases" that historically make up a bull market, we are now finally in the theoretical final Phase 5.
US S&P500 Monthly Chart
Secondly, we like the technical analysis method called Elliott Wave, when and only when, it's very clear. We believe too many people try and curve fit with technical analysis as opposed to utilising it when it adds the most value.
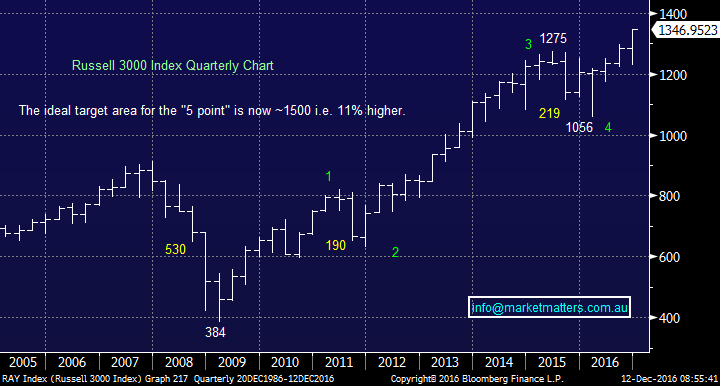
We have used the Russell 3000 as it's a broad index for the Elliott Wave count. This methodology has the market in the final 5th wave on the longer term basis, ideally targeting ~1500. After reaching a top the market should correct back towards 1050 i.e. around 22% and will be 30% if the Russell 3000 reaches the 1500 area.
This Elliott Wave count has been working perfectly for the last 2 years allowing us to aggressively buy stocks in both October 2014 and early 2016 when many investors ran away.
US Russell 3000 Quarterly Chart
Thirdly, we like a technical method called Symmetry Waves i.e. markets have a habit of retracing by similar amounts.
- The Russell on a Quarterly basis corrected 190 and 219 points respectively. We believe the next pullback will be similar to the 530 point GFC fall.
- As expected the pullbacks on the S&P500 are of similar magnitude i.e. 296 and 325-points respectively.
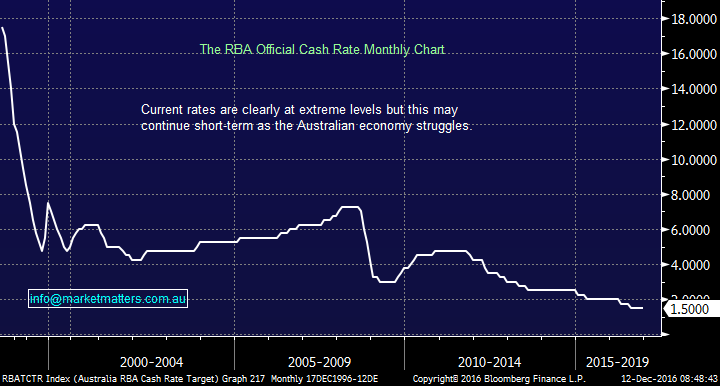
Fourthly, markets are trading on stretched valuations which are currently being sustained by historically low interest rates and optimism around economic growth in the years ahead. We remain committed to our view that interest rates have bottomed for this 30-year bear cycle - the RBA cash rate is 1.5% today but it was 18% back in 1990. Unfortunately, we also know that economic growth has continually failed to live up to expectations since the GFC; will Donald Trump make the difference?
RBA Cash Rate Monthly Chart
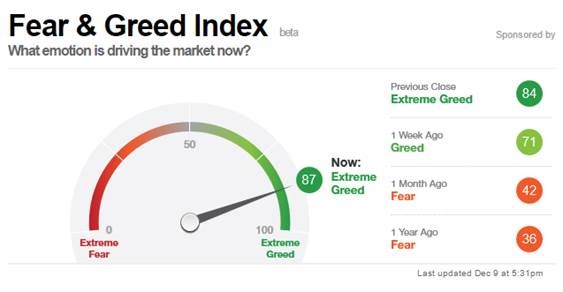
Lastly, the simple market psychology has finally turned positive after years of being negative. This has been the most unloved bull market in history but we need optimism for a major top and its definitely slowly manifesting itself. As we have mentioned at length in recent months the market was far too "cashed up" and negative for stocks to fall far and this has proven very accurate.
The short-term "Fear & Greed" Index is definitely in dangerous territory.
Hence, we stick with our strong opinion that when this mature bull market runs out of puff we are in for a ~25% correction over 2-years - this will provide excellent and exciting opportunities for the informed!
Livewire readers can receive 14 days’ free access to our Platinum level membership by registering here: (VIEW LINK)
Never miss an update
Enjoy this wire? Hit the ‘like’ button to let us know.
Stay up to date with my current content by
following me below and you’ll be notified every time I post a wire
James is Director & Lead Portfolio Manager at Market Partners - a collective of highly experienced investment professionals, operating independently, managing discretionary portfolios for wholesale investors.
James is also Portfolio Manager & primary author at Market Matters, a digital advice & investment platform with over 2500 members that offers real market intel & six portfolios open for investment.

3 topics

James is Director & Lead Portfolio Manager at Market Partners - a collective of highly experienced investment professionals, operating independently, managing discretionary portfolios for wholesale investors. James is also Portfolio Manager &...
Expertise
James is Director & Lead Portfolio Manager at Market Partners - a collective of highly experienced investment professionals, operating independently, managing discretionary portfolios for wholesale investors. James is also Portfolio Manager &...
Expertise
Comments
Comments
Sign In or Join Free to comment