Why our soaring market still looks ok to me
Are share markets cheap or expensive right now? Well, it depends who you ask. And there are plenty of people happy to offer their opinion. But at the risk of adding to this largely irrelevant discussion (after all, we buy shares in companies, not ‘the market’) here’s my take. Please feel free to comment – I’d love to read your views as well.
The pandemic remains out of control in the northern hemisphere and Sweden’s attempt at herd immunity has failed. Despite this, equity markets have recorded their best month in three decades. Notwithstanding a seemingly out of control global pandemic, an unresolved presidential election, and some signs of a loss of momentum in the economy, equity prices in November soared to all-time highs yet again.
The November market gains, however, were not led by the FAANGS or FAAMGS. It was small companies that surged 16 per cent, outstripping the Dow and S&P 500.
As we have noted previously, the market may remain elevated while the leadership of the market changes from high priced, long-duration (profitless) companies to more boring, annuity income-driven, reopening and dare we suggest ‘value’ stocks.
Here are some of the arguments for and against an expensive market. I’ll leave it for you to decide.
Robert Shiller’s CAPE Ratio
The Shiller CAPE ratio (CAPE stands for cyclically adjusted price-to-earnings) is a PE ratio based on average inflation-adjusted earnings from the previous 10 years. As at 3:11 PM EST, Mon Nov 30 the Shiller S&P500 PE Ratio stood at 33.04 times cyclically adjusted earnings. This places it at the second highest level it has been since 1870 and well above its average of 16.76 times earnings. The ratio has only been higher during the DotCom bubble of 1999 and early 2000.
Figure 1. Shiller CAPE Ratio as at November 30, 2020
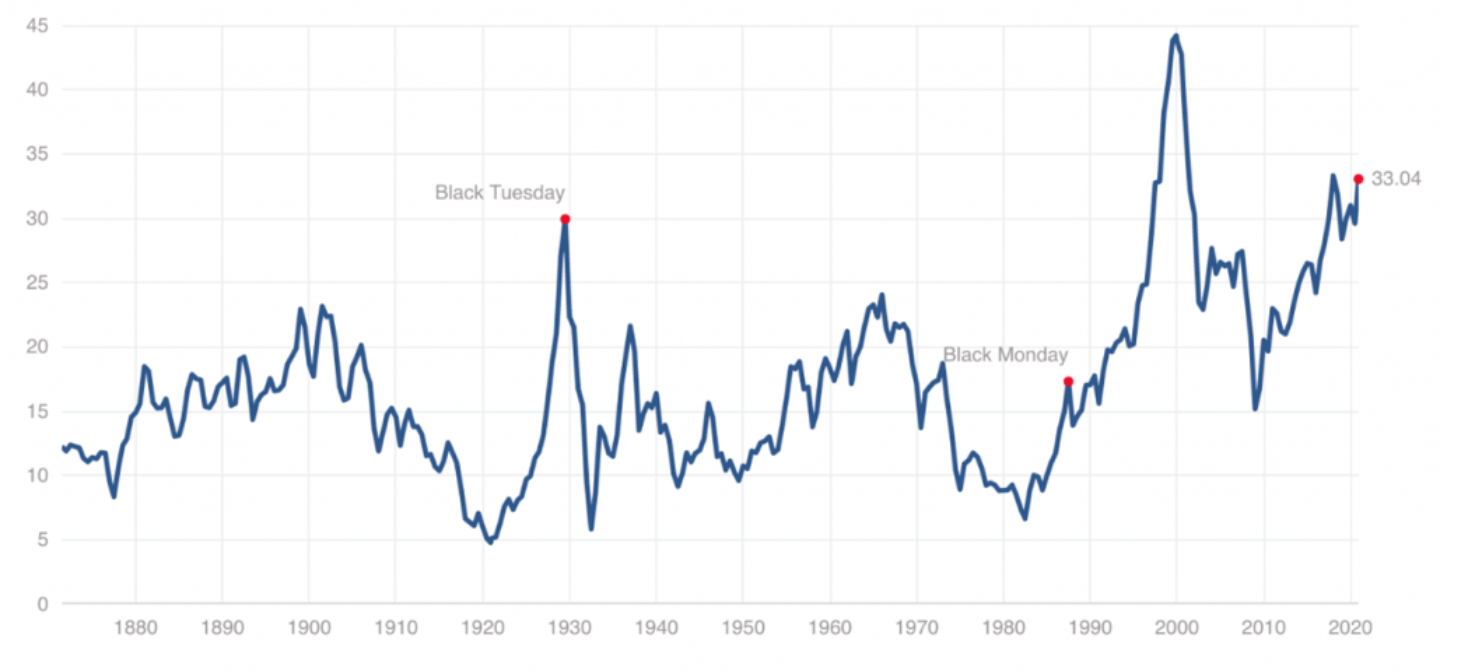
While many observers suggest the extreme level indicates risk of a market crash, Robert Shiller himself explained the ratio is not a robust predictor of market disruptions. Instead, he proffered, it was a reliable indicator of the average return for the next ten years. The higher the ratio, the lower the implied future return. Indeed, when the ratio is above 20 times earnings, the market has generated average returns that are lower than when the ratio is below 20. Also, when the ratio is below 20, double-digit returns, over the course of the ensuing decade, are more frequent than when the ratio is above 20.
The current extreme level relative to history suggests the average annual return an investor will receive from investing in the S&P500 index today will be in the lower single digits over the next decade.
This of course is not a concern to investors who focus on individual and rationally priced high-quality companies with bright prospects.
Buffett’s Market Cap to GDP ratio
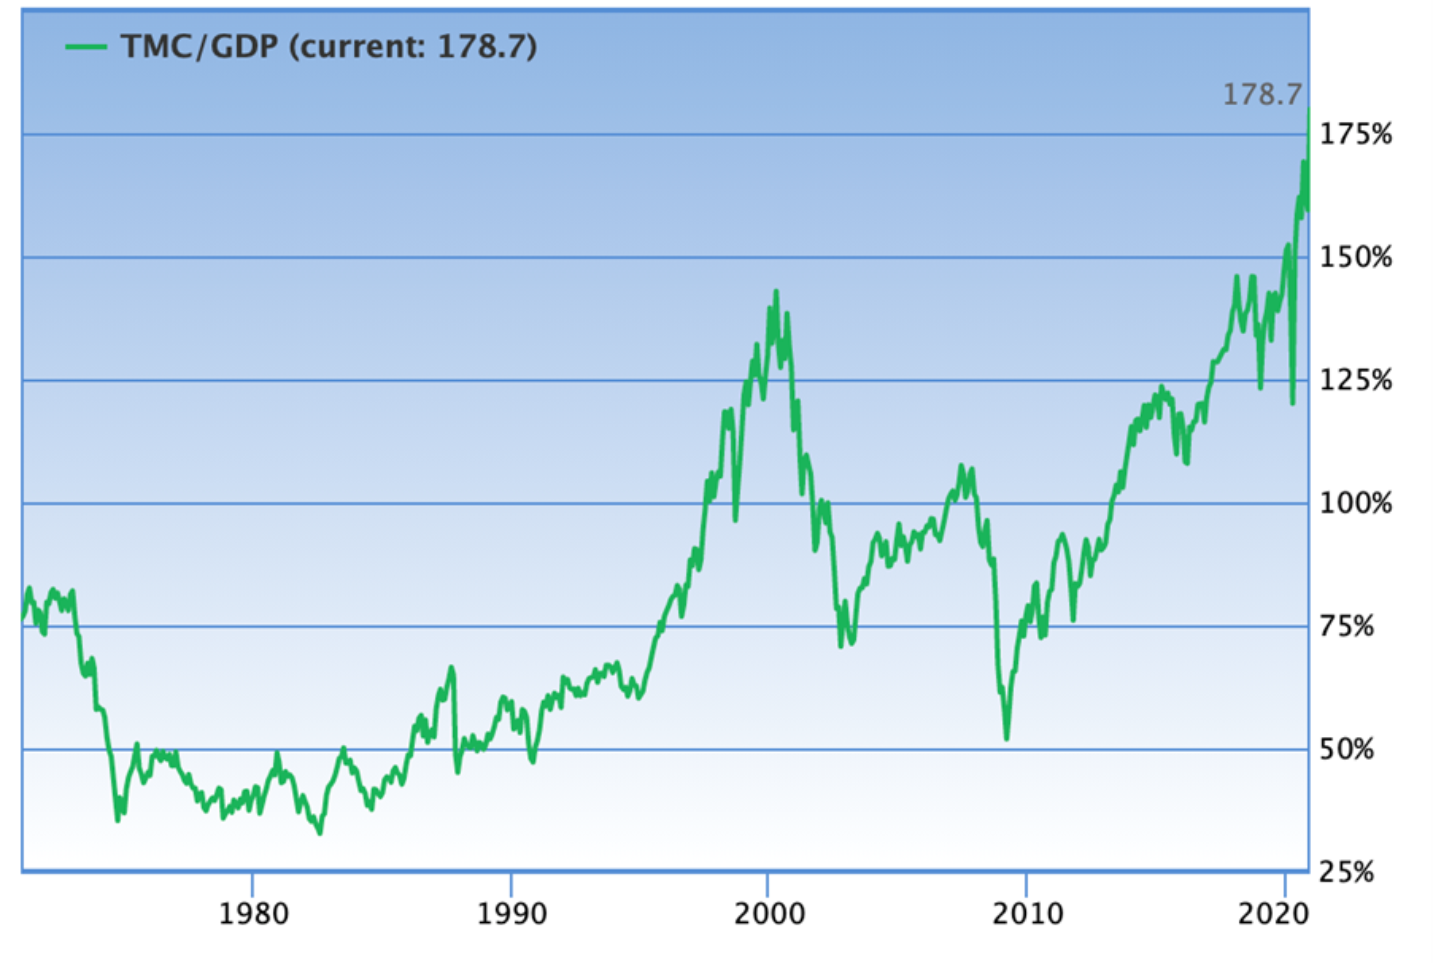
Another ratio investors may employ to reinforce the argument that the market is expensive is Warren Buffett’s Market Capitalisation to GDP ratio. This ratio compares the total market capitalisation of the US stock market to the annual output of the US economy.
Figure 2. Ratio of Total Market Cap to US GDP
The ratio’s popularity stems from a handful of rare market calls Buffett has made while referring to the ratio. In November 1999 – just a few months before the DotCom crash, Warren Buffett presented at the Allen & Company Sun Valley conference, to a bunch of tech entrepreneurs and their backers, Bill Gates, and a phalanx of old-world media moguls, billionaires and Hollywood producers.
This was Warren Buffett’s first slide:
Dow Jones
Industrial Average
December 31, 1964 874.12
December 31, 1981 875.00
He noted that during the 17 years highlighted, the size of the economy grew fivefold and the sales of the Fortune 500 companies grew more than fivefold, yet the stock market went nowhere. He contrasted that period to the 1990s “baloney” bull market (the Dow Jones index was at 11,000 and had risen an average 13 per cent per year for the prior 18 years). Profits had grown much less than in the previous period and yet stocks were expensive because interest rates were low.
Buffett then revealed the Market Cap-to-GDP slide noting that, for several years, the market’s growth had been outstripping the rate of growth of the economy. Buffett suggested the next 17 years’ market performance may look no better than the period from 1964 to 1981. “If I had to pick the most probable return over that period, it would probably be six per cent.”
Two years later, after the Dow had fallen to 9,000, Warren Buffett said, “I would expect now to see long-term returns run somewhat higher, in the neighbourhood of seven per cent after costs.”
Finally, Warren Buffett wrote in October 2008 just before the bottom of the Global Financial Crisis: “Equities will almost certainly outperform cash over the next decade, probably by a substantial degree.”
The ratio today is at an extreme level of 178.7 per cent, indicating a substantially overvalued market. You will note that the ratio has been extreme for some time and yet the market continues higher. Nevertheless, the ratio reinforces the message offered by the Shiller CAPE Ratio: that low future returns are implied.
A bullish argument – or a less bearish one
At the Sun Valley Conference in 1999 Buffett also discussed interest rates, noting, “What you’re doing when you invest is deferring consumption and laying money out now to get more money back at a later time. And there are really only two questions. One is how much you’re going to get back, and the other is when.
“Now, Aesop was not much of a finance major, because he said something like, ‘A bird in the hand is worth two in the bush.’ But he doesn’t say when. Interest rates – the cost of borrowing – are the price of ‘when’. They are to finance as gravity is to physics. As interest rates vary, the value of all financial assets – houses, stocks, bonds – changes, as if the price of birds had fluctuated. And that’s why sometimes a bird in the hand is better than two birds in the bush and sometimes two in the bush are better than one in the hand.”
Referring to the 1990s bull market, Buffett noted birds in the bush were expensive because interest rates were low. In other words, nobody wanted the bird in the hand (cash), so they had gradually migrated towards more attractive relative returns.
After declining for 38 years, interest rates today are lower than they have ever been. Consequently, the gravitational force on asset prices has been very light and asset prices have risen.
Whether or not the market is expensive however can be determined by comparing the stock market’s earnings yield to the yield available on bonds, after adjusting for the risk of being in equities.
Australian 10-year bonds currently yield just 0.955 per cent. The equity market risk premium is estimated at about 3.5 per cent. Adding these two together, we arrive at an implied ‘fair value’ earnings yield of 4.45 per cent. The earnings yield is the inverse of the price earnings ratio, so by dividing 4.45 per cent into 100 we arrive at an estimated fair value PE of 22.4 times earnings.
The S&P/ASX 200 one year forward PE is 18.7 times as at 1 December 2020 and the PE for ASX200 companies with positive earnings is 23 times. Comparing the current ratios with that implied by bonds adjusted for risk, and given interest rates are not expected to rise until inflation is sustainably in the target inflation band, the market appears to be fair value or even slightly cheap.
Not already a Livewire member? Sign up today to get free access to investment ideas and strategies from Australia’s leading investors.
Enjoy this wire? Hit the like button to let us know.
Never miss an update
Enjoy this wire? Hit the ‘like’ button to let us know.
Stay up to date with my current content by
following me below and you’ll be notified every time I post a wire
Roger Montgomery founded Montgomery Investment Management in 2010. Roger has more than three decades of experience in investing, financial markets and analysis. Roger also authored the best-selling investment book, Value.able.

3 topics

Roger Montgomery founded Montgomery Investment Management in 2010. Roger has more than three decades of experience in investing, financial markets and analysis. Roger also authored the best-selling investment book, Value.able.
Expertise
Roger Montgomery founded Montgomery Investment Management in 2010. Roger has more than three decades of experience in investing, financial markets and analysis. Roger also authored the best-selling investment book, Value.able.
Expertise
Comments
Comments
Sign In or Join Free to comment
most popular
Equities
The Magnificent Seven can’t carry the market forever
Pzena Investment Management