Will the Yield Curve save a “Dying” Gold Market?
The gold price in USD fell by 3% in the first half of August, declining below critical support at USD $1200oz, though it has since bounced back above this level. The savage sell off represented the culmination of a four month drawdown for the yellow metal, with the gold price declining from near USD $1350oz over this period.
The decline has seen sentiment toward precious metals hit record lows, with some financial market commentators openly questioning if gold will “die out with the boomer generation”, and that going forward, one needs to question whether or not society will continue to see gold as a store of value.
Whilst the contrarian in me sees that kind of commentary as a bullish signal, there is no doubt that pessimism better represents the current market mood, as we are experiencing record short positioning in the futures market (see chart below from ANZ), and outflows from gold ETFs have been almost constant over this period, with holdings declining by almost 100 tonnes since the end of May 2018.
 Source: ANZ
The last time speculators were this bearish gold was 2001, when gold was sub USD $300oz and about to commence a decade long bull market.
The key driver of the recent weakness has of course been the United States Dollar – which has rallied almost uninterrupted since late April of this year, causing not only gold to fall, but a range of emerging market currencies, most notably the Turkish Lira.
Over the long run, there are of course a multitude of factors that drive the gold price, but in this instance, there really should be no doubt that it has been a case of dollar strength, gold price weakness, as the chart below makes clear.
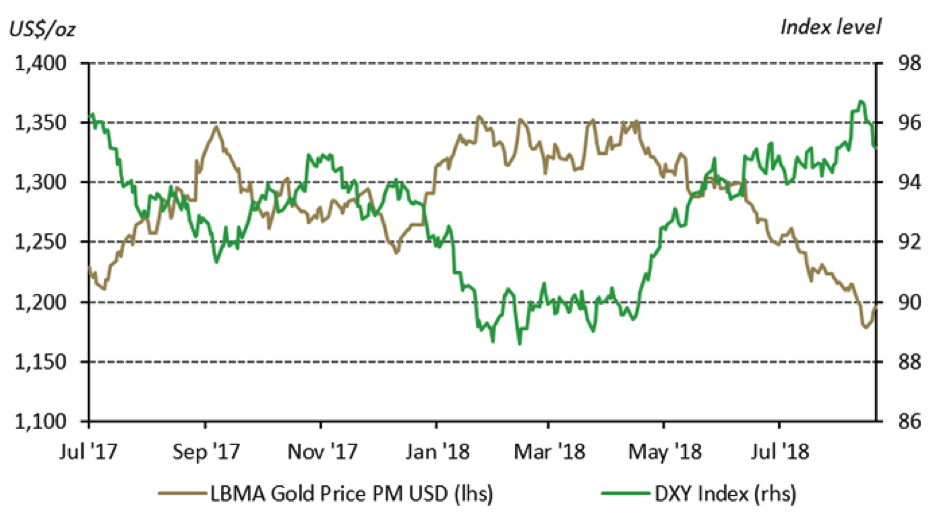 Source: World Gold Council
For Australian dollar investors, the pullback in gold prices hasn’t been quite so significant in the last few months, owing to a decline in the value of the AUD, which has fallen to just USD $0.7245, as weakness in commodity prices, uncertainty caused by the Royal Commission, and the recent bout of political chaos in Canberra dampen demand for the local currency.
Compounding the impact of the strong USD on the gold price has been the almost complete abandonment of “safe haven” investments over the past few months.
This can be seen best seen in the chart below, which plots net non-commercial positioning in not only gold, but also US 10 years and the VIX.
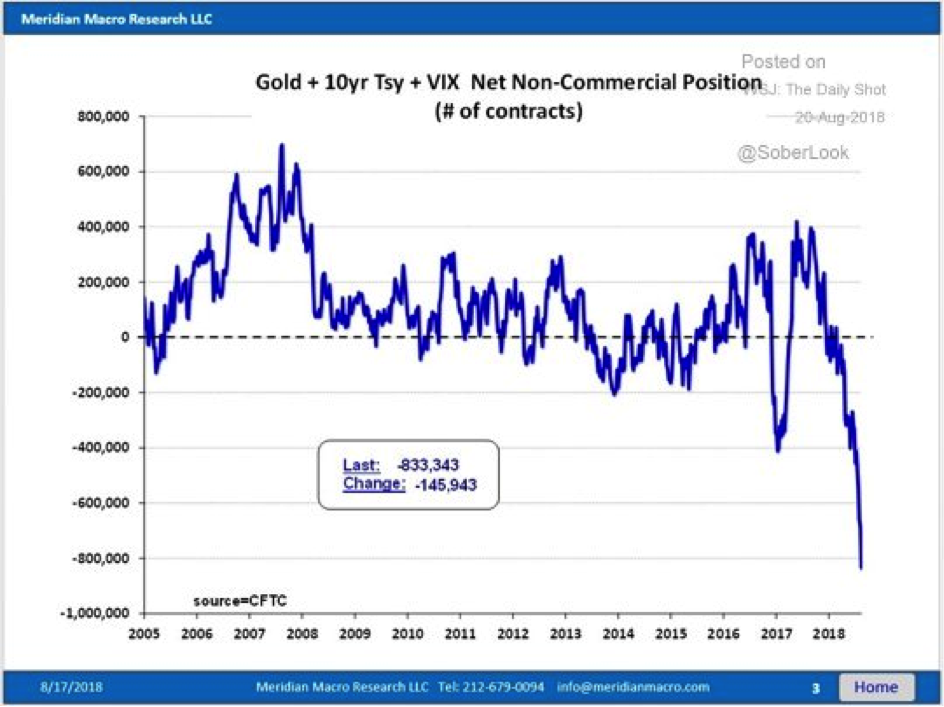 Source: Meridien Macro Research
Markets haven’t seen anything like this in the past decade and a half, not only in terms of how stretched positioning now is, but also how fast positioning changed.
No one seems worried about risk, which is amazing considering the volatility we are witnessing in emerging markets, a US stock market boom that is now the longest on record, a Fed that has been tightening policy, and of course, the continued flattening of the US yield curve.
Gold vs. Stocks when the Yield Curve Inverts!
Over the past few weeks, we’ve read a lot of commentary surrounding the potential implications of an inverting US yield curve, with the spread between US 10 year and 2 year government bonds now below 20 basis points, its lowest level in approximately a decade.
Most articles have focused on whether or not the pending inversion implies a recession in the United States is likely in the next year or so, with previous inversions in the yield curve often pre-dating recessionary periods for the US economy.
This can be seen on the chart below, which plots the yield curve since 1976, with recessions marked in grey.
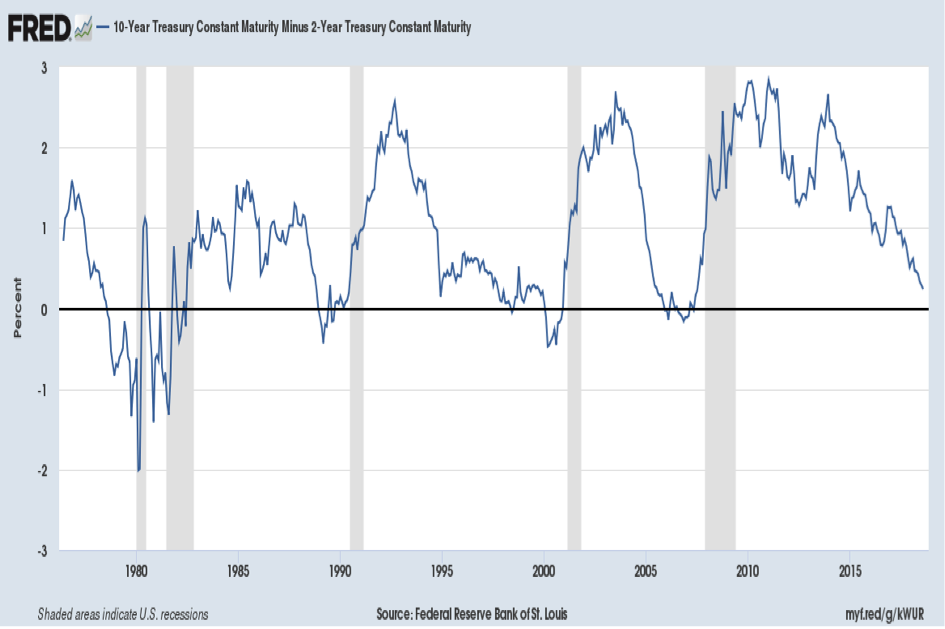 Source: FRED database
Other analysis has focused on the implications for the stock market, and whether or not a yield curve inversion should be seen as either an outright sell signal for stocks, or at the very least a warning that investors should begin to lighten exposures, and seek out defensive alternatives.
To help answer that question, we’ve looked at the four major yield curve inversions of the last 40 years, which took place in September 1978, January 1989, February 2000 and February 2006, using monthly data from the FRED database of the St Louis Federal Reserve.
Below, we’ve highlighted the 1-year, 3-year and 5-year returns for both stocks (S&P 500), and gold, priced in USD, following on from those yield curve inversions. We’ve also included an average 1-year, 3-year and 5-year return for both asset classes across all four occasions when the curve inverted, as well as highlighted the performance differential between the two.
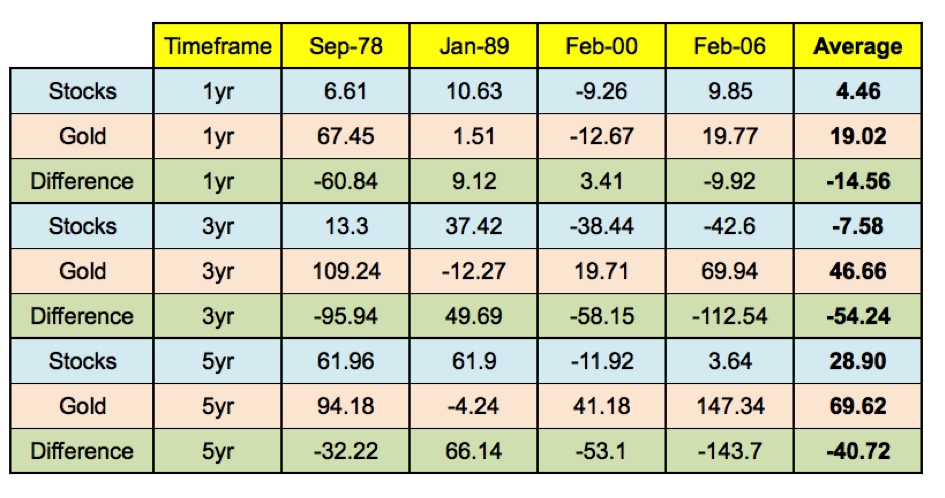 Source: FRED database, ABC Bullion
As you can see from the above, the most notable finding is that gold has on average outperformed stocks quite strongly on all three timeframes following on from previous yield curve inversions.
The strongest average outperformance, of almost 55%, has occurred over three year time period following on from the inversion of the yield curve, with gold averaging a gain of 46.66%, whilst stocks have on average declined by 7.58%.
Over a 1 year time period, the picture isn’t quite as clear, with stocks outperforming gold after the 1989 and early 2000 yield curve inversions, even though stocks also fell over 9% in the latter scenario.
The 5 year picture, which would take us to the mid 2020’s if history were to repeat, is also very favourable for gold on both an absolute, and relative basis, with the yellow metal outperforming stocks on three of four occasions, with an average outperformance of over 40%.
Indeed based on the above data, unless one assumes we are back in a late 1980’s style market environment, which is a subject for another day, then gold would seem to be the better bet going forward.
Apart from that late 1980’s example, gold outperformed stocks over every other timeframe following inversions of the yield curve, with the exception of the 1 year period in the early 2000s, which saw stocks fall -9.26%, whilst gold fell -12.67%.
This is of course not a suggestion that investors should immediately go and pile into physical bullion, but for those looking to hedge equity market risk, the more than 10% pullback in the yellow metal over the past few months provides an opportunity worth paying attention too.
Never miss an update
Enjoy this wire? Hit the ‘like’ button to let us know.
Stay up to date with my current content by
following me below and you’ll be notified every time I post a wire
Gold and precious metal bull since early 2000. Have spent +25yrs working in investment analytics, research & portfolio construction, with a primary focus on the role of precious metals in investor portfolios. Author of two books on investing in gold and the causes of the GFC. Lover of markets, competition & technology
.jpg)
6 topics
.jpg)
Gold and precious metal bull since early 2000. Have spent +25yrs working in investment analytics, research & portfolio construction, with a primary focus on the role of precious metals in investor portfolios. Author of two books on investing in...
Expertise
Gold and precious metal bull since early 2000. Have spent +25yrs working in investment analytics, research & portfolio construction, with a primary focus on the role of precious metals in investor portfolios. Author of two books on investing in...
Expertise
Comments
Comments
Sign In or Join Free to comment
most popular
Investment Theme
If 24 LICs ran the Melbourne Cup, which ones would we back?
Affluence Funds Management