This bull market isn't spent yet

Marcus Tuck
Mason Stevens
Three key indicators we focus on for a health check of the US equity market are: 1) The direction of US leading economic indicators (as a guide to future earnings); 2) The slope of the US yield curve (as an early warning of recession risk), and 3) The US equity risk premium (as a measure of equity valuation relative to bonds). What are they telling us right now?
We periodically update these measures to see what condition the market is in. Recent headlines have been dominated by political events, such as tensions with North Korea and President Trump's domestic woes. However, the US reporting season was stronger than expected, not only for earnings but especially for revenues. Barring a disaster scenario, political dislocations tend to be temporary. The fundamentals of earnings and interest rates usually return to the fore.
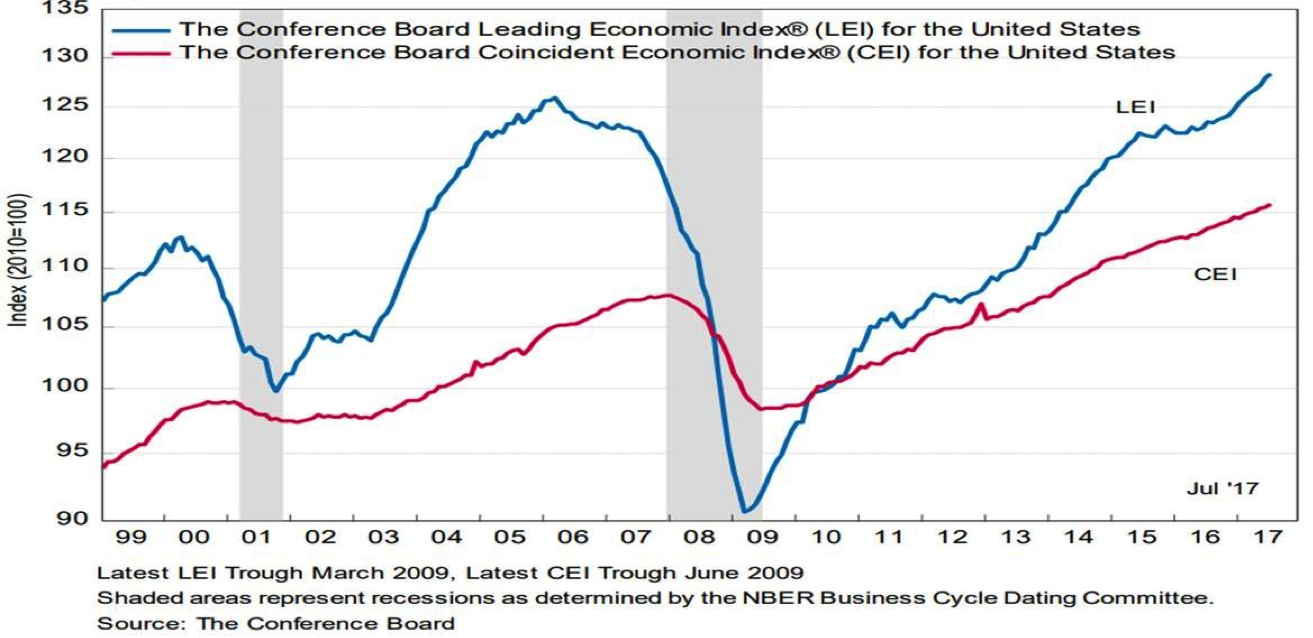
Leading economic indicators are positive
However, a good reporting season in the US is no help if the economy is headed towards recession. Fortunately, that is not being signaled by the Conference Board's Leading Economic Index for the US. The latest reading increased 0.3% in July, after a 0.6% increase in June and a 0.3% increase in May (see first chart). Three consecutive falls are normally needed to signal an impending recession. Three consecutive rises is a healthy sign.
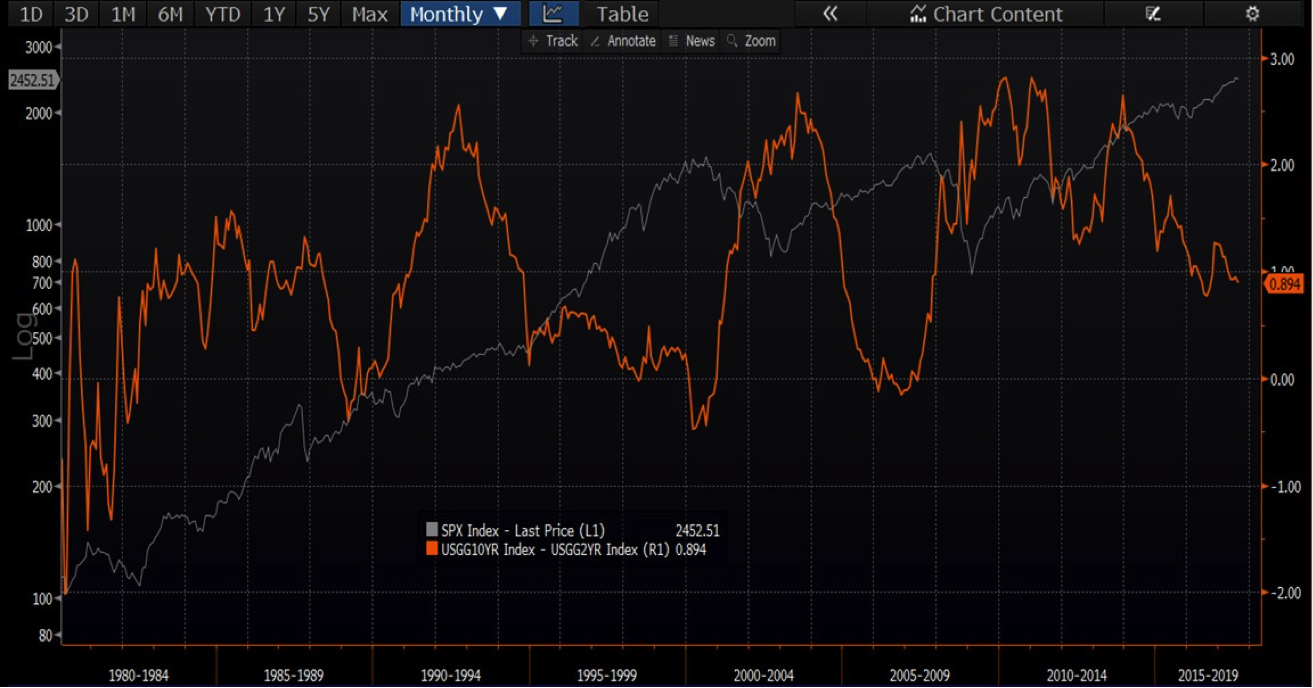
US yield curve positively sloped
The slope of the US yield curve is particularly important. When short rates are higher than long rates the yield curve becomes inverted. That is a sign that monetary policy has become so restrictive that the economy is in danger of recession.
We use the difference between the US 10-year and 2-year Treasury yields as the measure of yield curve slope. Although the yield curve has flattened, it is still positively sloped with a reading of +0.89% (see the second chart, which overlays the S&P 500 Index on a log scale).
ERP not flashing red yet
Another danger sign would be a very low equity risk premium (ERP), defined as the difference between the 12-month forward Earnings Yield (100/PER) for the S&P 500 Index minus the 10-year Treasury yield.
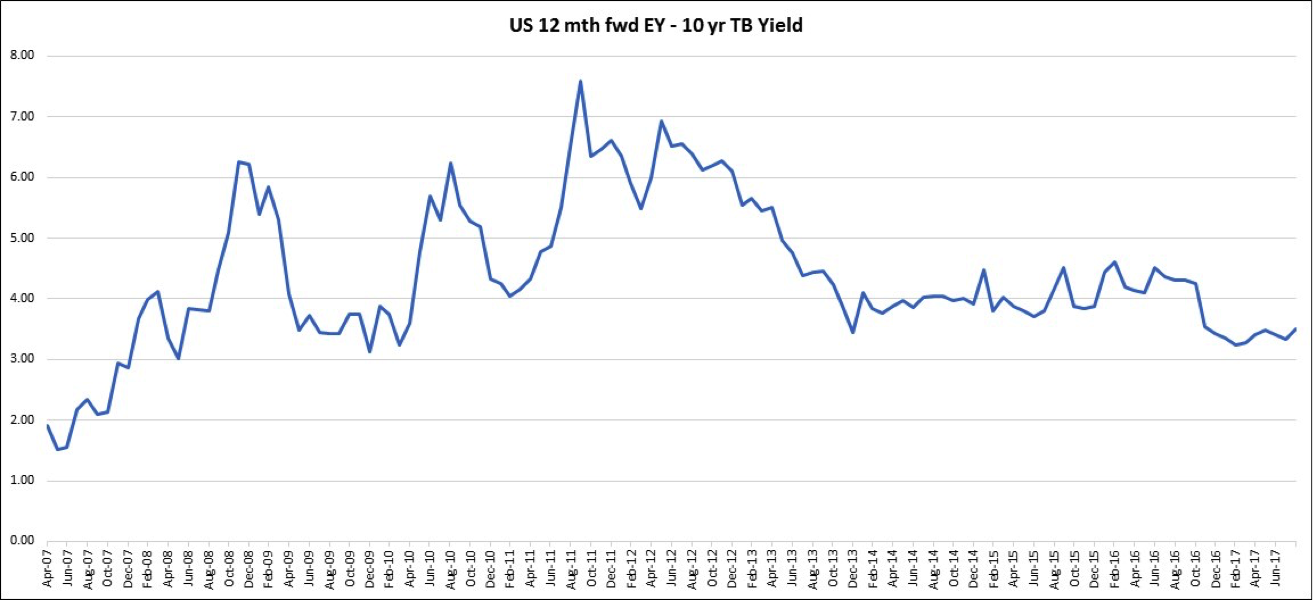
Although the 12-month forward PE ratio for the S&P 500 is high in absolute terms at 17.5x, it is not unreasonable in the context of a 2.21% US 10-year Treasury yield.
The current reading of the ERP is 3.50% (100/17.5 - 2.21), still above the 3% level that starts to become more concerning. In the lead-up to the GFC sell-off the ERP was below 2% (see the chart above).
What does this all tell us?
Overall, the three indicators point to a mature bull market that is not fully spent yet.
Never miss an update
Enjoy this wire? Hit the ‘like’ button to let us know.
Stay up to date with my current content by
following me below and you’ll be notified every time I post a wire
Responsible for identifying domestic and international equity investment opportunities. 25 years of financial markets experience as an equity strategist, economist, analyst, portfolio manager and consultant.

2 topics
Marcus Tuck
Head of Equities
Mason Stevens
Responsible for identifying domestic and international equity investment opportunities. 25 years of financial markets experience as an equity strategist, economist, analyst, portfolio manager and consultant.
Expertise
Marcus Tuck
Head of Equities
Mason Stevens
Responsible for identifying domestic and international equity investment opportunities. 25 years of financial markets experience as an equity strategist, economist, analyst, portfolio manager and consultant.
Expertise
Comments
Comments
Sign In or Join Free to comment