5 charts driving house prices
A year ago, the property boom was showing signs of fading and we expected property prices to fall in Sydney and Melbourne by around 5-10%. Home prices were overvalued, affordability was very poor and tightening bank lending standards in response to pressure from the bank regulator APRA was expected to turn the property cycle down. At the same time, we thought a crash was unlikely. Since then average prices are down about 5% in Melbourne and 8% in Sydney. Nationally, prices are off about 5%.
Outlook
Going forward, we expect more weakness based on a range of factors. You can see these factors in a wire I wrote last month here. In short, we now expect prices to fall around 20% top to bottom in Sydney and Melbourne and by 10% for the national capital city average.
With prices now falling naturally, the calls for a property crash are getting louder. Our assessment remains that a crash – where national average prices fall by 20% or more over a year are unlikely unless we see much higher interest rates or unemployment (neither of which are expected) or a continuation of recent high construction for several years (which is unlikely as approvals are falling) and a collapse in immigration.
However, the risk of a crash cannot be ignored given the danger banks may overreact to the Royal Commission and become too tight making investors decide to exit in the face of falling returns.
The bottom line is that now remains a time for caution regarding housing as an investment destination – particularly in Sydney and Melbourne where it remains expensive, prices are likely to fall further, and rental yields are low. Best to look at other cities and regional areas that offer much better value
“The bottom line is that now remains a time for caution regarding housing as an investment destination – particularly in Sydney and Melbourne”
Below are 5 charts that provide context on my views and highlight some of the key drivers I’ve identified for house prices.
Chart 1 & 2: Sydney and Melbourne – what auction clearance rates foreshadow
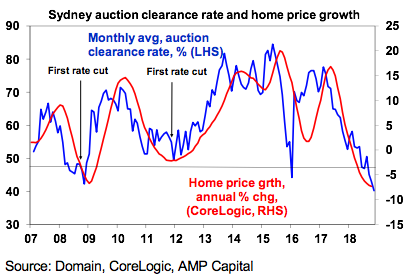
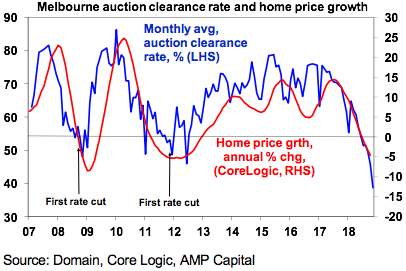
My favourite charts are the auction clearance rates because they are timely and have a good cyclical relationship with property prices in Sydney and Melbourne. Both are pointing towards more downside in property prices.
Chart 3: Housing-related credit slowing to record lows?
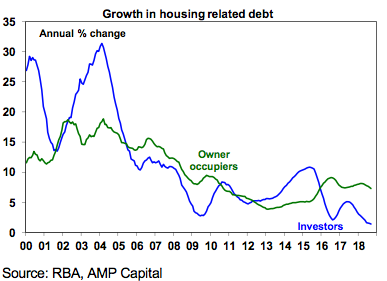
Growth in housing-related credit is critical to keep an eye on given the tightening in lending conditions. It has already slowed to record lows for investors and is looking weaker for owner occupiers too.
Chart 4: Supply looks to still be very high
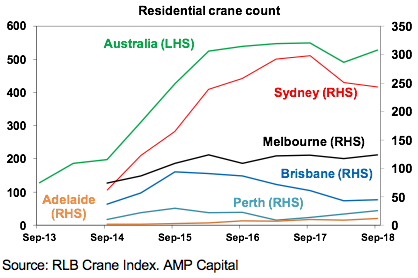
The residential crane count is worth watching as a guide to how much unit supply is yet to hit the market. It’s down from last year’s record high in Sydney but it remains very high as it does in Melbourne.
Chart 5: Increasing risks of forced sales?
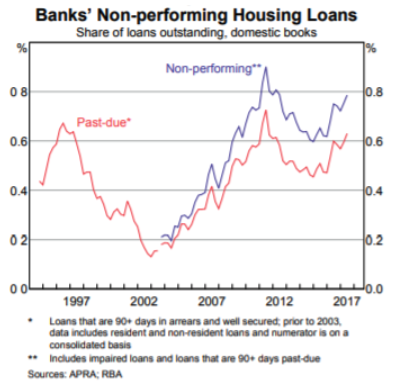
Finally, the bank’s non-performing housing loans are worth watching. If they increase more significantly it would point to an increasing risk of forced sales which would accentuate the weakness in house prices.
Never miss an update
Enjoy this wire? Hit the ‘like’ button to let us know.
Stay up to date with my current content by
following me below and you’ll be notified every time I post a wire
Shane joined AMP in 1984 and is Chief Economist and Head of Investment Strategy. Shane has extensive experience analysing economic and investment cycles and what current positioning means for the return potential for different asset classes.

3 topics

Shane joined AMP in 1984 and is Chief Economist and Head of Investment Strategy. Shane has extensive experience analysing economic and investment cycles and what current positioning means for the return potential for different asset classes.
Expertise
Shane joined AMP in 1984 and is Chief Economist and Head of Investment Strategy. Shane has extensive experience analysing economic and investment cycles and what current positioning means for the return potential for different asset classes.
Expertise
Comments
Comments
Sign In or Join Free to comment