5 key charts on the housing market

Matthew Coleman
Dexus
The problem with the entire residential narrative is that it is based on short-term perspectives. Taking a long-term view, house price growth over the last six years is still exceptionally strong.
After five years of continued house price growth in Sydney and Melbourne, where average prices rose by 75% and 55% respectively to mid-2017, a pullback of some sort was almost inevitable.
We have no special knowledge about when short-term corrections may occur, preferring to think of the matter in terms of probabilities. As house prices rocketed, the chances of a pullback increased. We’re not in the business of making predictions but the recent house price falls haven’t surprised us.
Outlook
We have no idea where prices will go in the short term and nor does anyone else. However, the balance of probabilities would suggest further price weakness.
The correction is a useful reminder to property investors that prices don’t always appreciate and that the market should be approached with a long-term investment horizon. On that basis, residential property has a number of factors in its favour. Here are five charts that give us confidence in the sector over the long-term.
Chart 1: Population growth will drive strong demand for housing
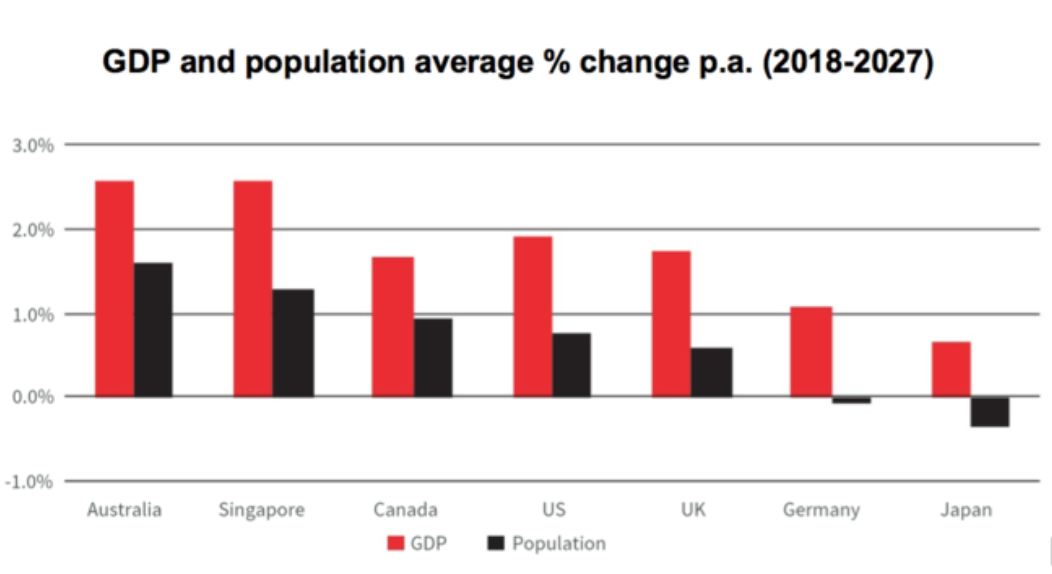
Source: JLL
Over the next ten years, JLL contends that Australia’s population is likely to be one of the fastest growing among advanced economies, rising by an expected average of 1.6% a year between now and 2027. Continued strength in population growth will drive strong underlying demand for housing.
There has also been a recent decline in residential building approvals, which is arresting the growth in supply. Less supply of a product normally results in higher prices.
Chart 2: But isn't there an oversupply of residential property?
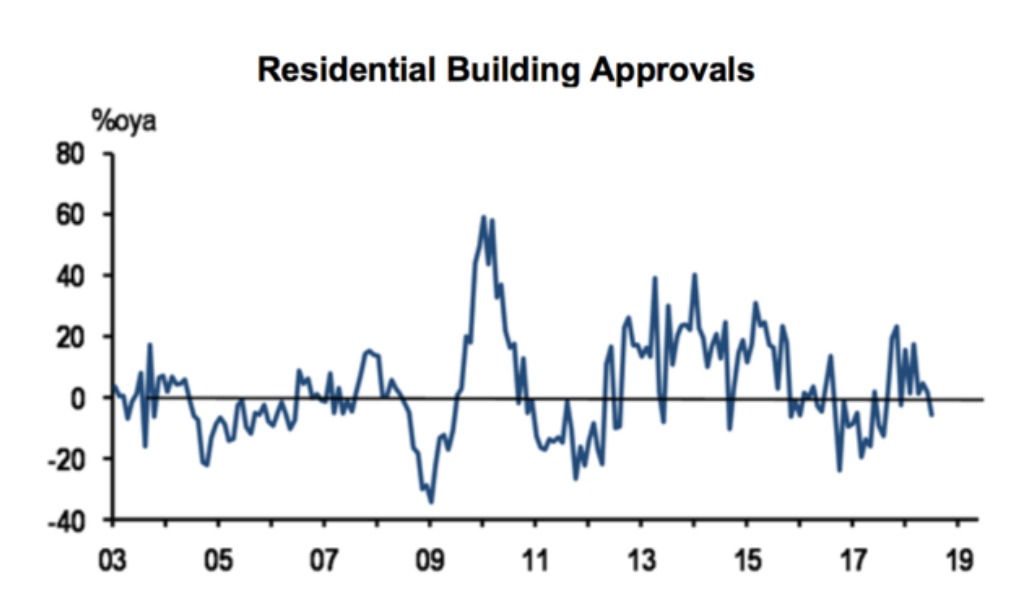
Source: ABS, JP Morgan
With a growing population and the requirement for an extra 50,000 new homes per year, Australia faces a structural undersupply of residential property. If this trend continues it makes the prospect of further, significant price reductions less likely.
Chart 3: More people working, means more people with income
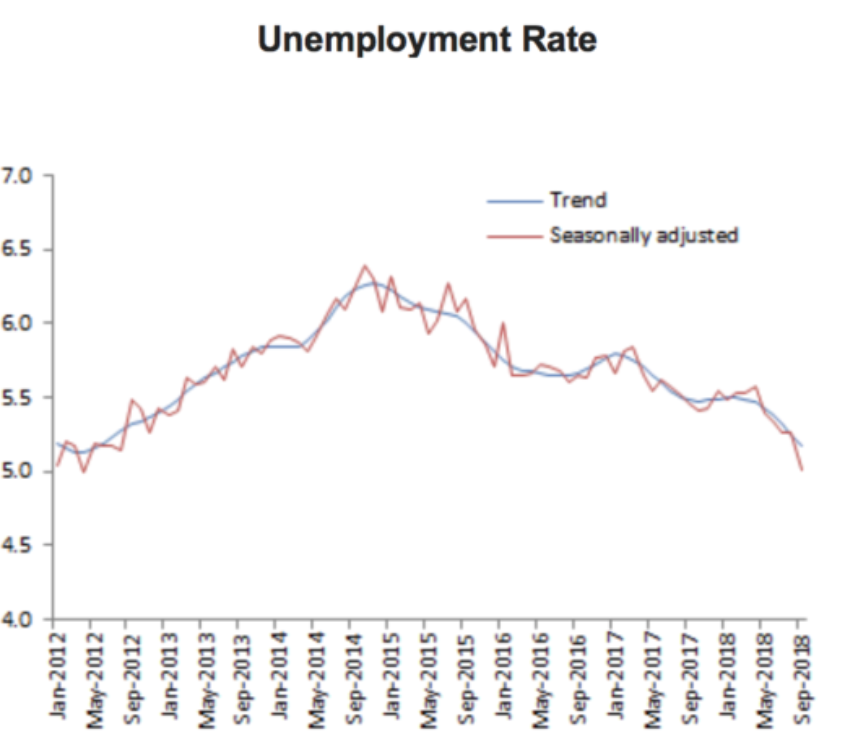
Source: ABS, October 2018
As for unemployment, it remains at a historic low of 5.0%, the lowest level since mid-2012. And whilst wage growth is modest at 2.1% p.a., these are not the conditions usually associated with a property crash.
Chart 4: Isn't the mortgage market stressed?
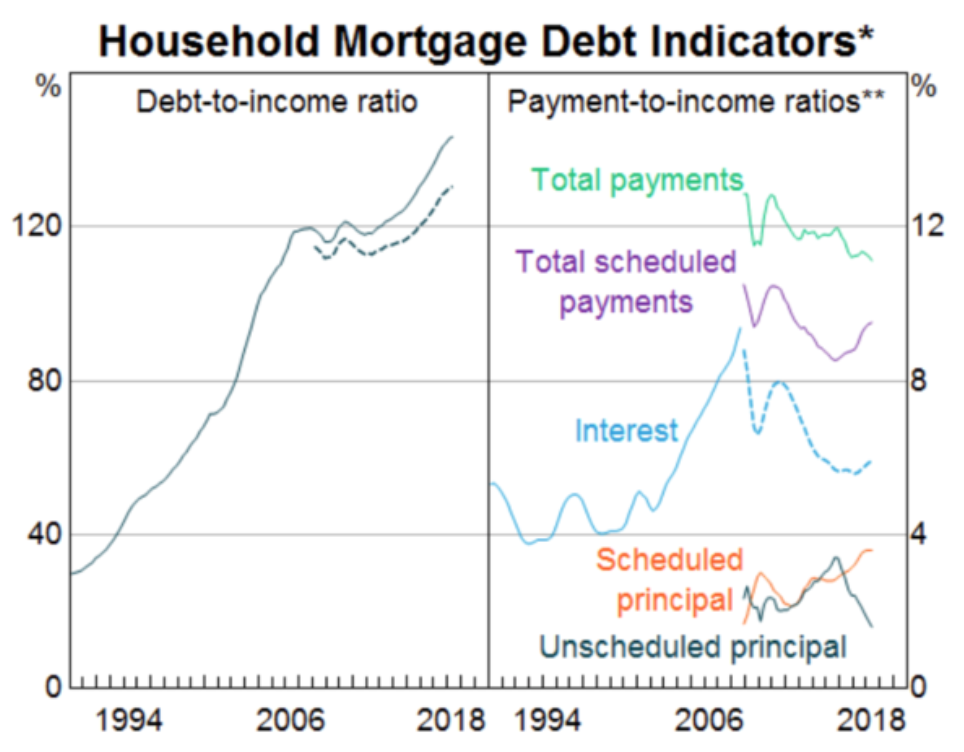
Source: ABS, APRA, RBA
Loan serviceability remains a clear focus for regulators, banks and investors. Whilst household debt remains at record levels since the mid-2000s interest payments as a share of disposable income have declined because falling interest rates have more than offset higher levels of debt.
The dashed line on the left-hand side of the chart shows the difference between mortgage debt and balances in ‘offset’ accounts and redraw facilities. Over the last decade, a significant number of householders have got ahead of their scheduled repayments. This is an effective ‘buffer’ that will likely help households to absorb increased repayments and manage their debt obligations when interest rates start to rise.
Chart 5: Credit growth has slowed significantly
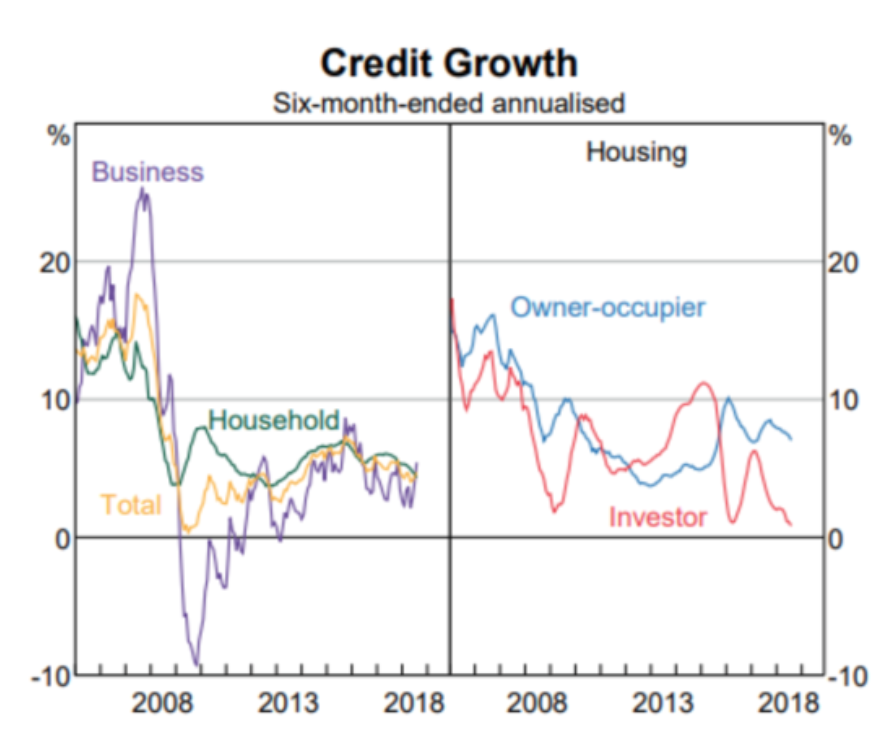
Source: APRA, RBA
A tightening in lending standards brought about by increased regulatory pressure from APRA and the banking royal commission will continue to impact credit availability and house prices.
Credit growth to the investor segment has already slowed significantly while a declining share of interest-only and high loan-to-value loans have reduced the riskiness of new lending.
With APRA’s focus on stabilising household debt to income, we expect Australian underwriting standards to tighten gradually which will weigh on new lending and overall credit growth. The fact that house prices have declined in an orderly fashion suggests that groundwork is paying off. Even so, property investors carrying heavy debt might want to rethink their overall exposure.
Again, it’s impossible to forecast where things go next but at this stage, the recent price weakness in residential property is characteristic of a normal cycle after such a period of significant growth.
Want to learn more?
here.
This article has been prepared by APN Funds Management Limited (ACN 080 674 479, AFSL No. 237500) for general information purposes only and without taking your objectives, financial situation or needs into account.
Never miss an update
Enjoy this wire? Hit the ‘like’ button to let us know.
Stay up to date with my current content by
following me below and you’ll be notified every time I post a wire
Matthew is tasked with analysing and investing in Australian property trusts.
He brings fundamental property knowledge, experience across a number of property sectors and a genuine interest in the AREIT sector.

4 topics
Matthew Coleman
Analyst, Real Estate Securities
Dexus
Matthew is tasked with analysing and investing in Australian property trusts. He brings fundamental property knowledge, experience across a number of property sectors and a genuine interest in the AREIT sector.
Expertise
Matthew Coleman
Analyst, Real Estate Securities
Dexus
Matthew is tasked with analysing and investing in Australian property trusts. He brings fundamental property knowledge, experience across a number of property sectors and a genuine interest in the AREIT sector.
Expertise
Comments
Comments
Sign In or Join Free to comment