TOL - 3rd Sep, 2025
ASX 200 has date with destiny in September as records look set to tumble
September’s the worst month of the year for the ASX 200, but this indicator suggests this year could buck the trend and deliver new records.
This is Part 2 of our series on seasonality in the Australian share market. In Part 1 we showed why the All Ordinaries Total Return Index (XAOA) is the only sensible target for seasonal analysis of Australian shares because it takes into account both capital gains and dividends – the latter of which are themselves highly seasonal in nature.
We set out the long-run tendency for September to be the weakest month in the ASX investing calendar. September also typically kicks off a 12-week period of extreme volatility that has seen some of the biggest swings in local stock prices over the last four decades.
Today, we’ll extend our seasonal analysis to include shorter lookback periods 30, 20, 10 and 5-years, and then we’ll test a key conditional: Does the strength or weakness of July–August set the tone for September? Consider that these two months are typically one of the strongest periods of the year for Australian shares, and this year, they’ve seen the benchmark ASX 200 rally over 5% – around half its typical average annual return.
Our goal is to determine what the seasonal statistics suggest we’re in store for this September – seasonal weakness as per the 40-year lookback period implied – or is there something in the data that suggests we may buck the trend? Let’s dive in!
Key findings from September Seasonality Part 1
1. Use total return in your analysis – or don’t bother!
Dividends cluster around reporting periods, and ex-dividend dates depress price-only indices while leaving total return indices unchanged. Any seasonal analysis that ignores dividends confuses mechanical price drops with “weakness” and leads to bad inferences. That’s why we use XAOA, not price-only series like the benchmark S&P/ASX 200.
2. September is the outlier
Over 40 years, the average September return is slightly negative – the only month that fails to post a positive long-run average – while most other months are at least modestly positive. It also has the lowest gain reliability (i.e., share of years with a positive return) of any month, reinforcing its problem-child status.
3. October’s reputation is worse than its statistics
Despite famous market upsets (1987, 2008/09), October’s long-run average is slightly positive – as strength in its first two to three weeks offset a calamitous final week.
4. Why does September suck!?
A range of options here, from post-reporting indigestion, dividend harvesting strategies, global calendar effects (e.g., northern-hemisphere fund managers returning from summer vacation), and simple mean reversion after strong July–August stretches, all likely all contribute. None is decisive alone, but together they may create a headwind for stocks in September.
September Swoon: More recent experience
This time, we’re going to investigate seasonal trends over shorter lookback periods, 30, 20, 10 and 5 years. See below the Average Monthly Return charts for each lookback period, as well as their Monthly Gain Reliability.
Australian share market Seasonality - 30 years

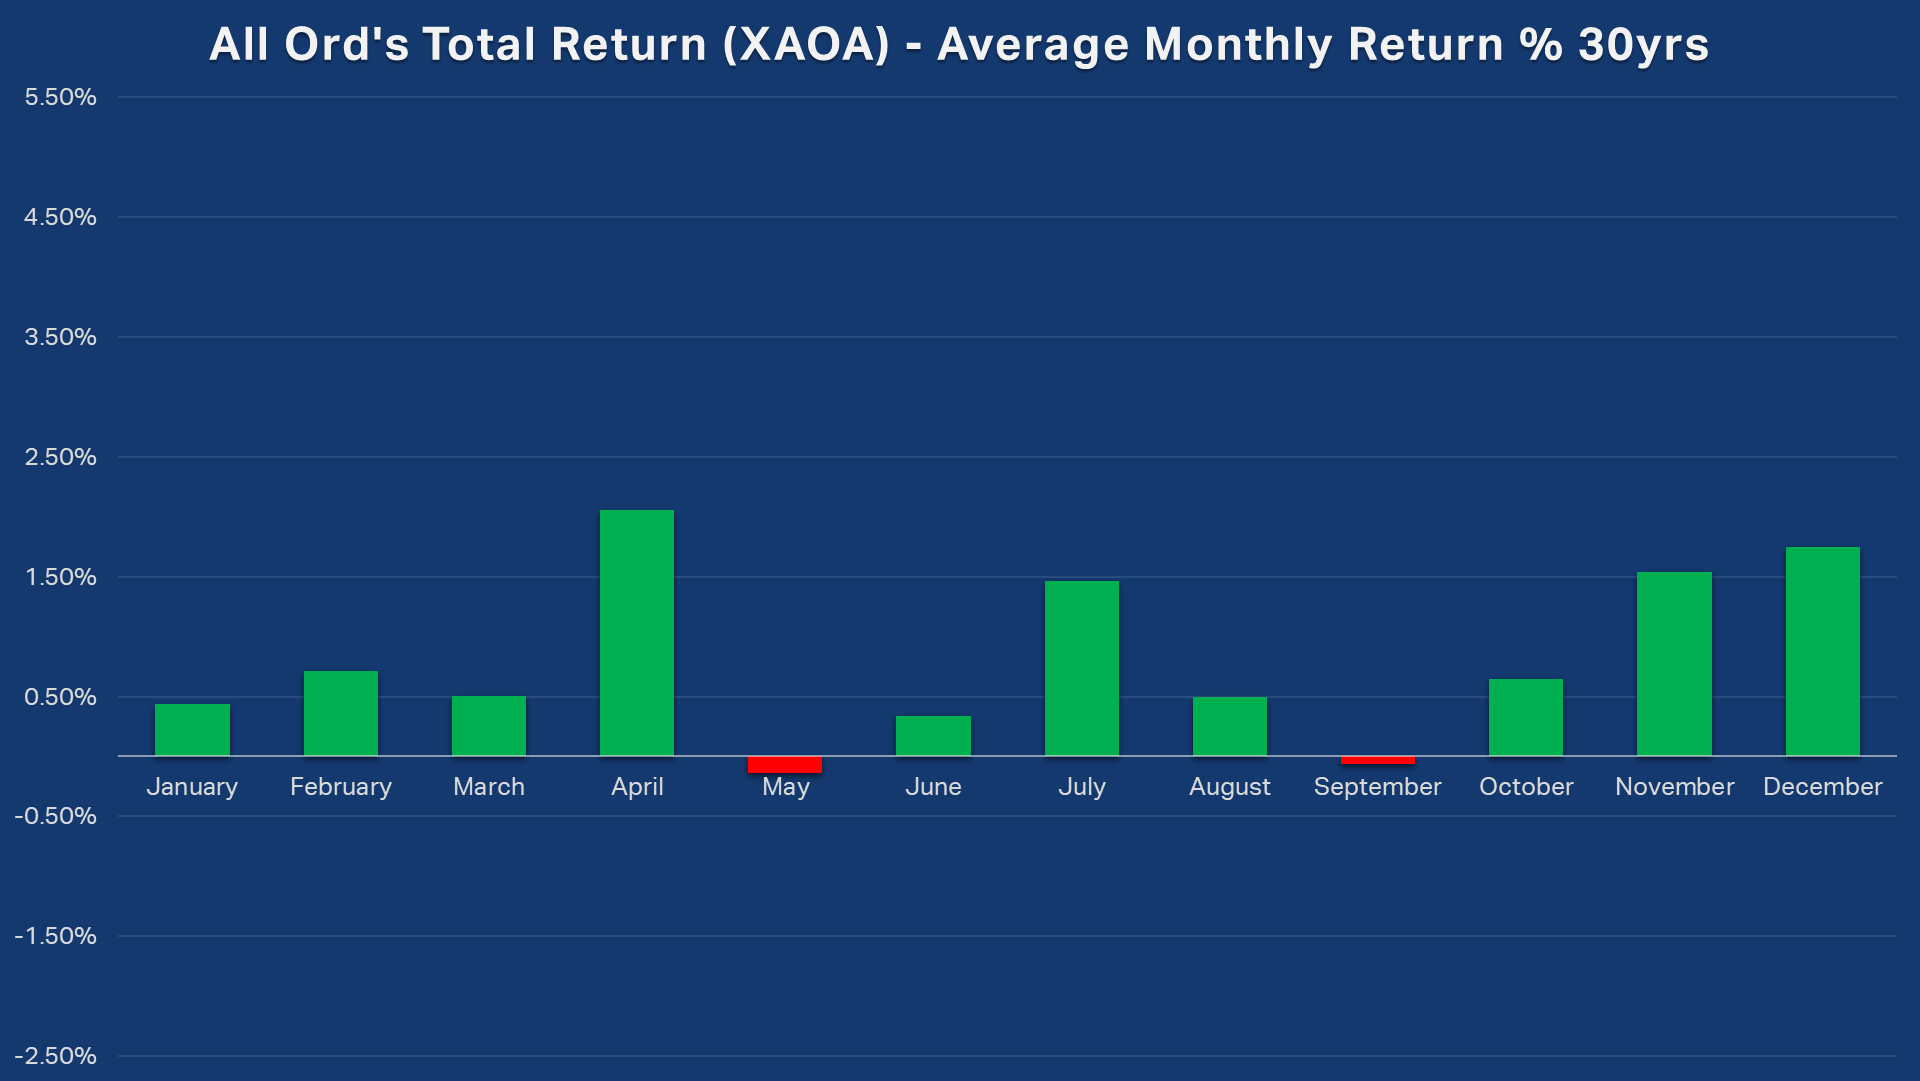
All Ordinaries Total Return XAOA Average Monthly Return 30 years (click here for full size image)

Returns: September is still slightly negative on average, but it’s now joined by May as the only two down months on average. There are some other slight changes, but the broad pattern remains a strong end/start of the year, a strong July-August, with seasonal weakness in May-June and September-October.
We’re really only focusing on September in this research, but May’s flip from positive to negative can’t be ignored! We’re seeing, and will continue to see as we progress through the shorter lookback periods, growing evidence backing the “Sell in May and go away” adage... or as it should more accurately be put: "Sell in April and go away" (but that doesn’t rhyme!).
Also note that versus the 40-year lookback period from Part 1, October is now more positive.
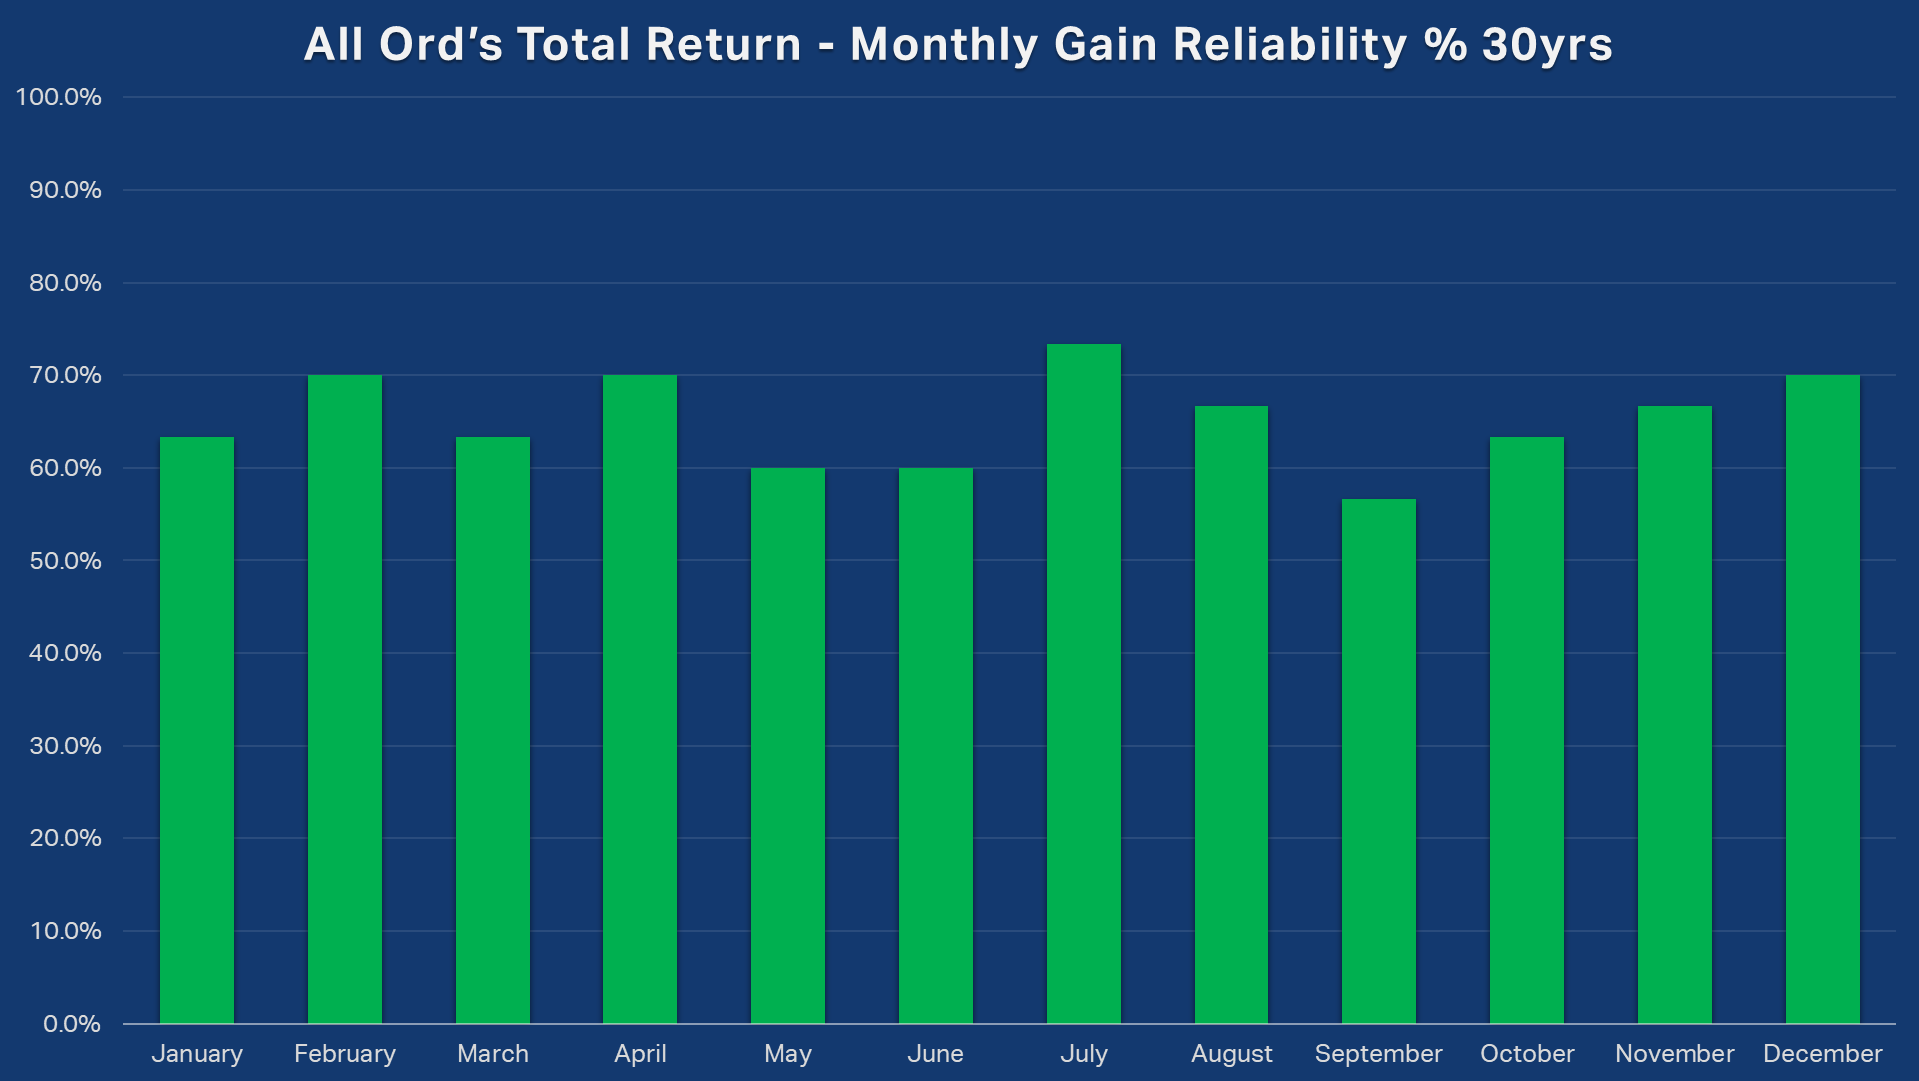
Reliability: September’s gain reliability has improved slightly from 52.5% over 40-years to 56.7% – but it’s still the least reliable month of the year; October is about the same versus the 40-year lookback period at ~63%.
Takeaway: Still the classic script – September is generally a soft and unreliable month for the Australian share market. The concept of the “September Swoon” remains intact!
Australian share market Seasonality - 20 years

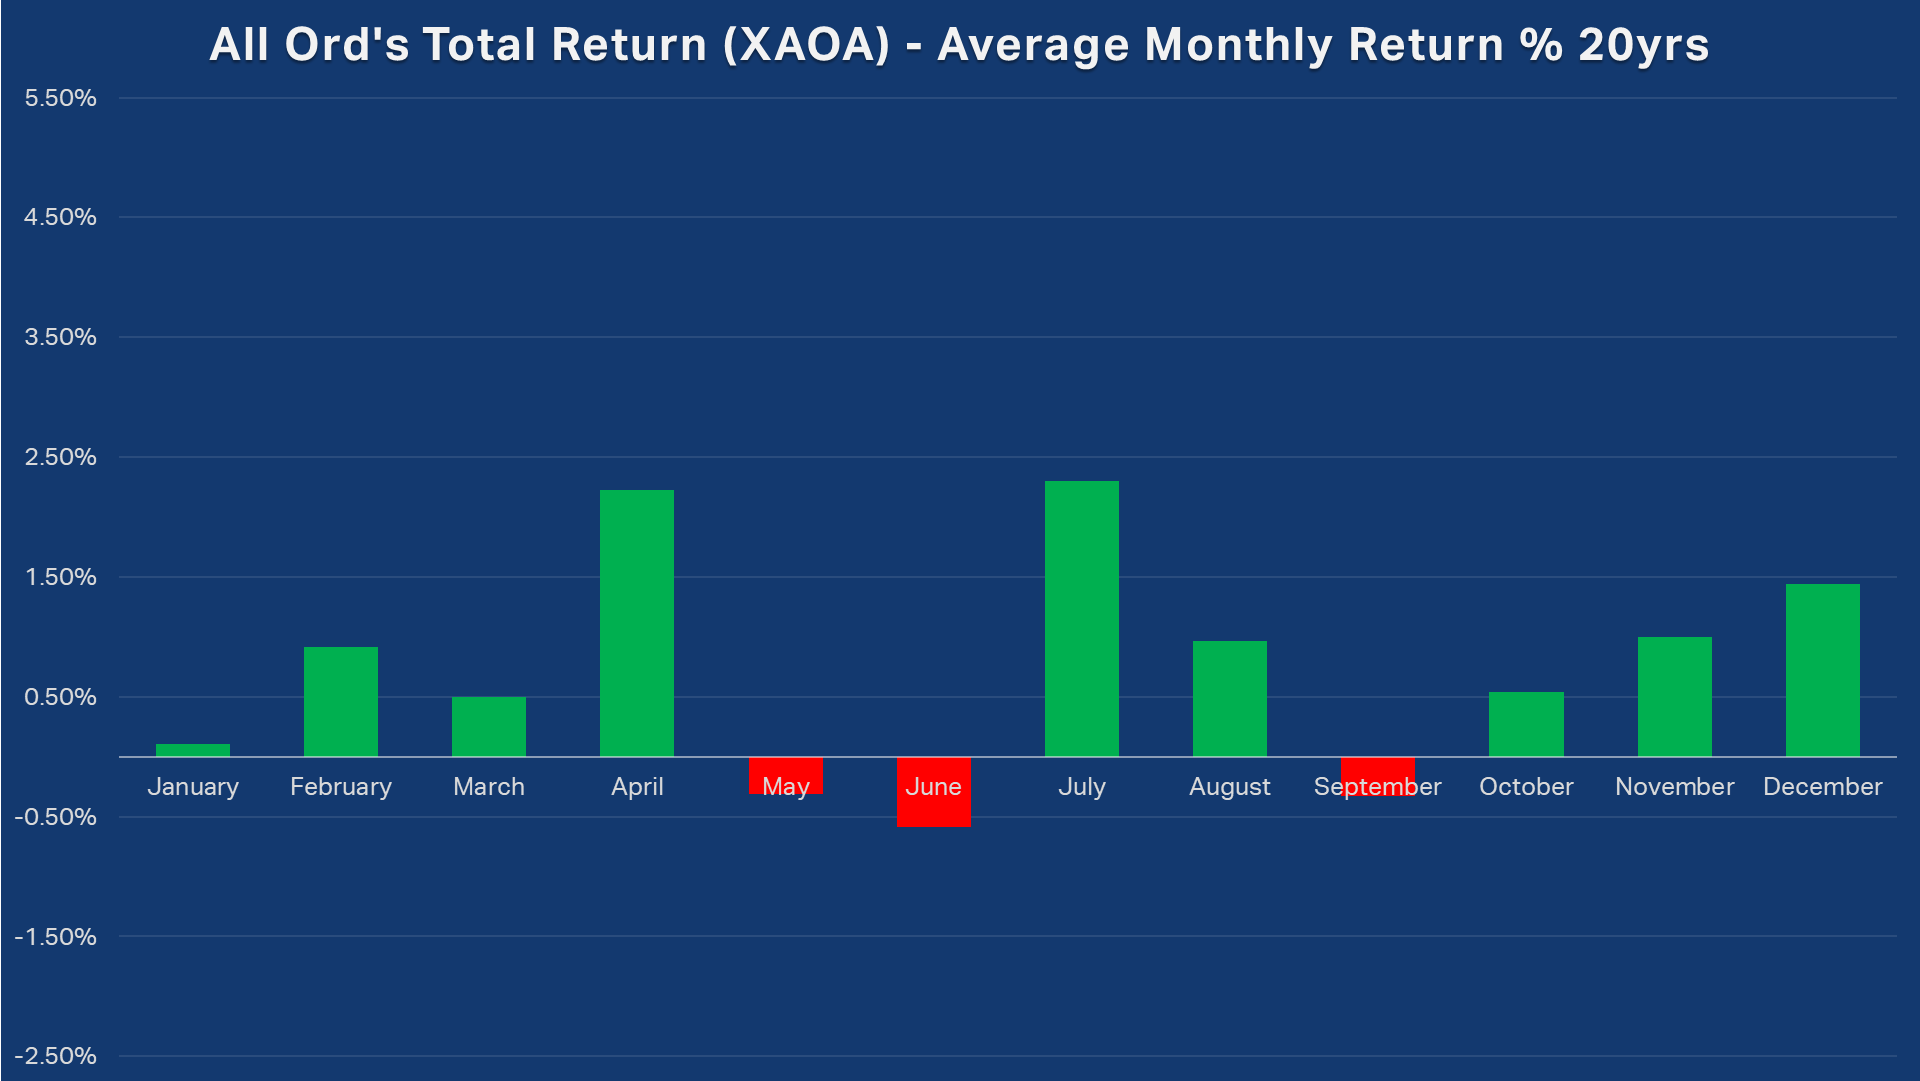
All Ordinaries Total Return XAOA Average Monthly Return 20 years (click here for full size image)

Returns: The September Swoon is more pronounced. The average XAOA September loss over the last 20 years -0.33%, down from -0.11% measured in the 40-year lookback period. May-June seasonal weakness is also more pronounced, with July-August’s returns improving (possibly to compensate).
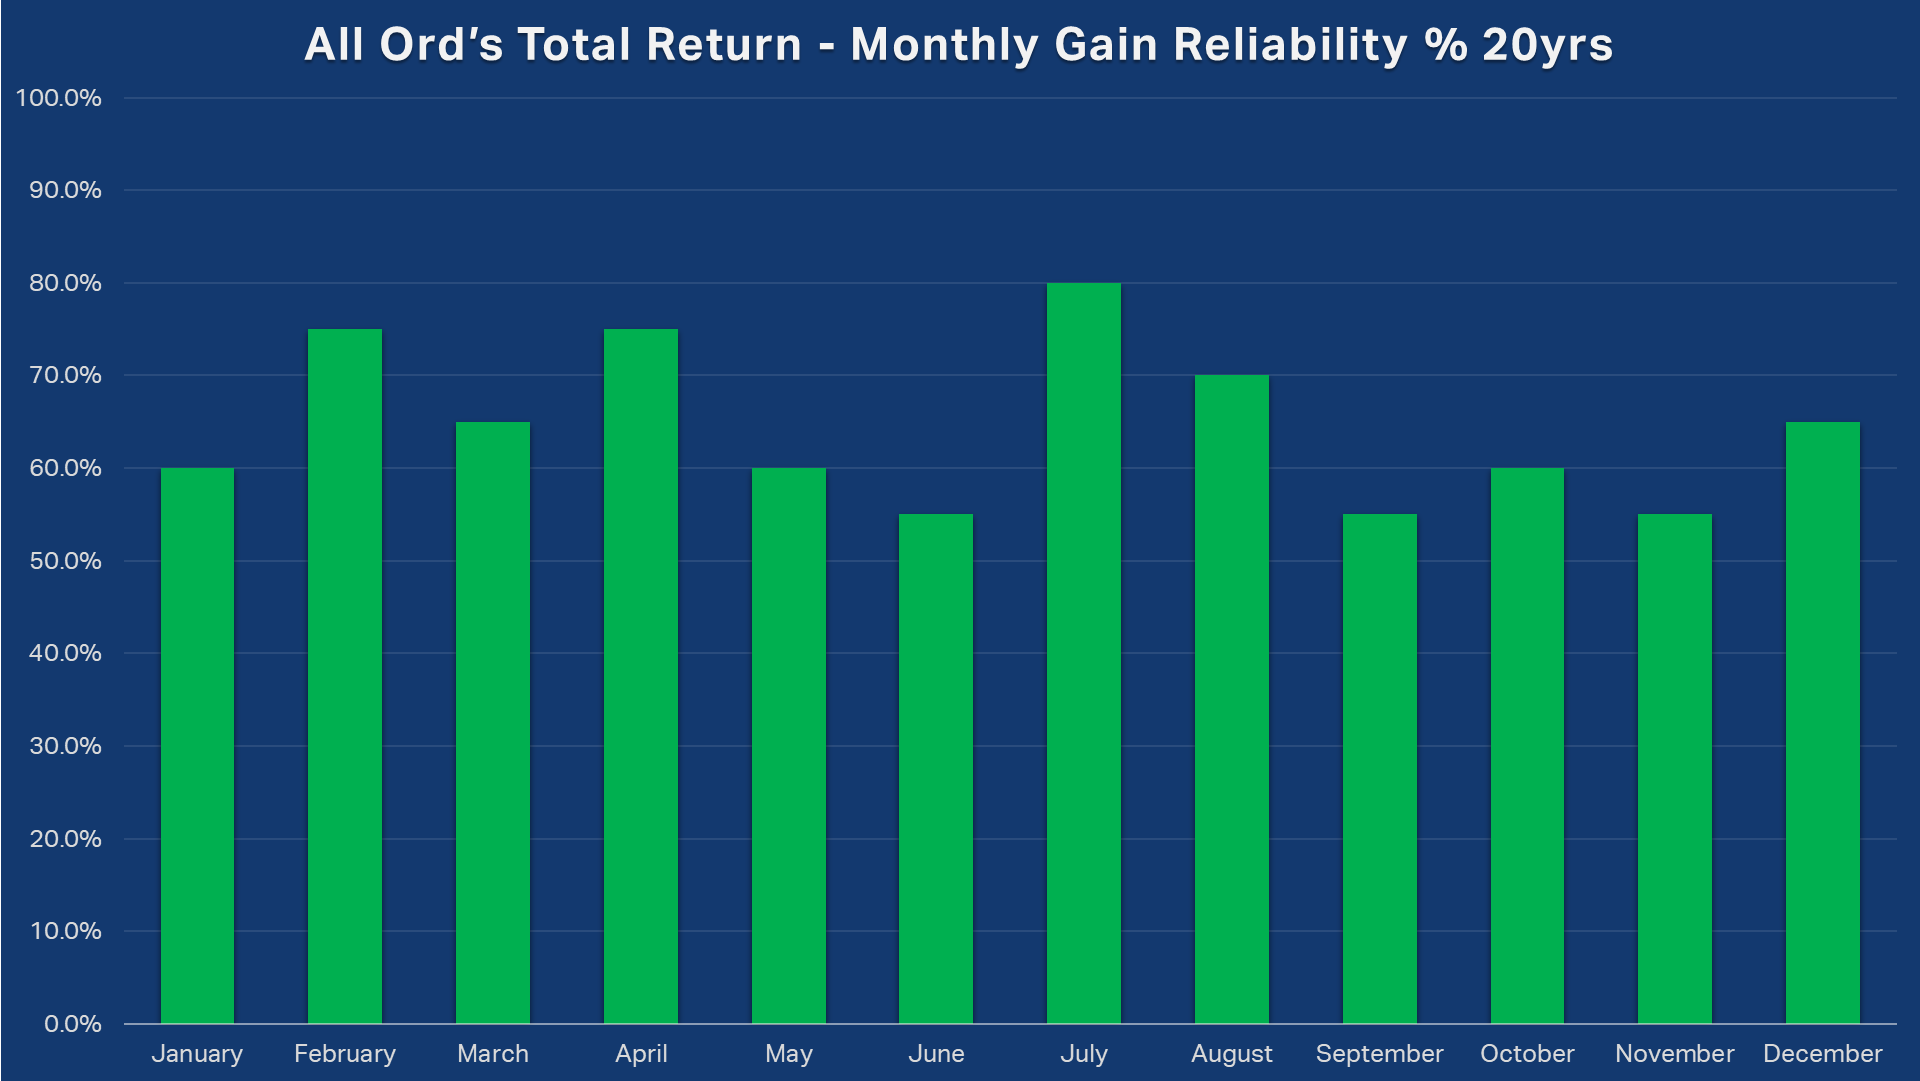
Reliability: September’s gain rate is still higher than the 40-year lookback period at 55%, but it remains the least reliable month of the year. October’s gain reliability has slipped a little.
Takeaway: No change: The September Swoon is real!
Australian share market Seasonality - 10 years

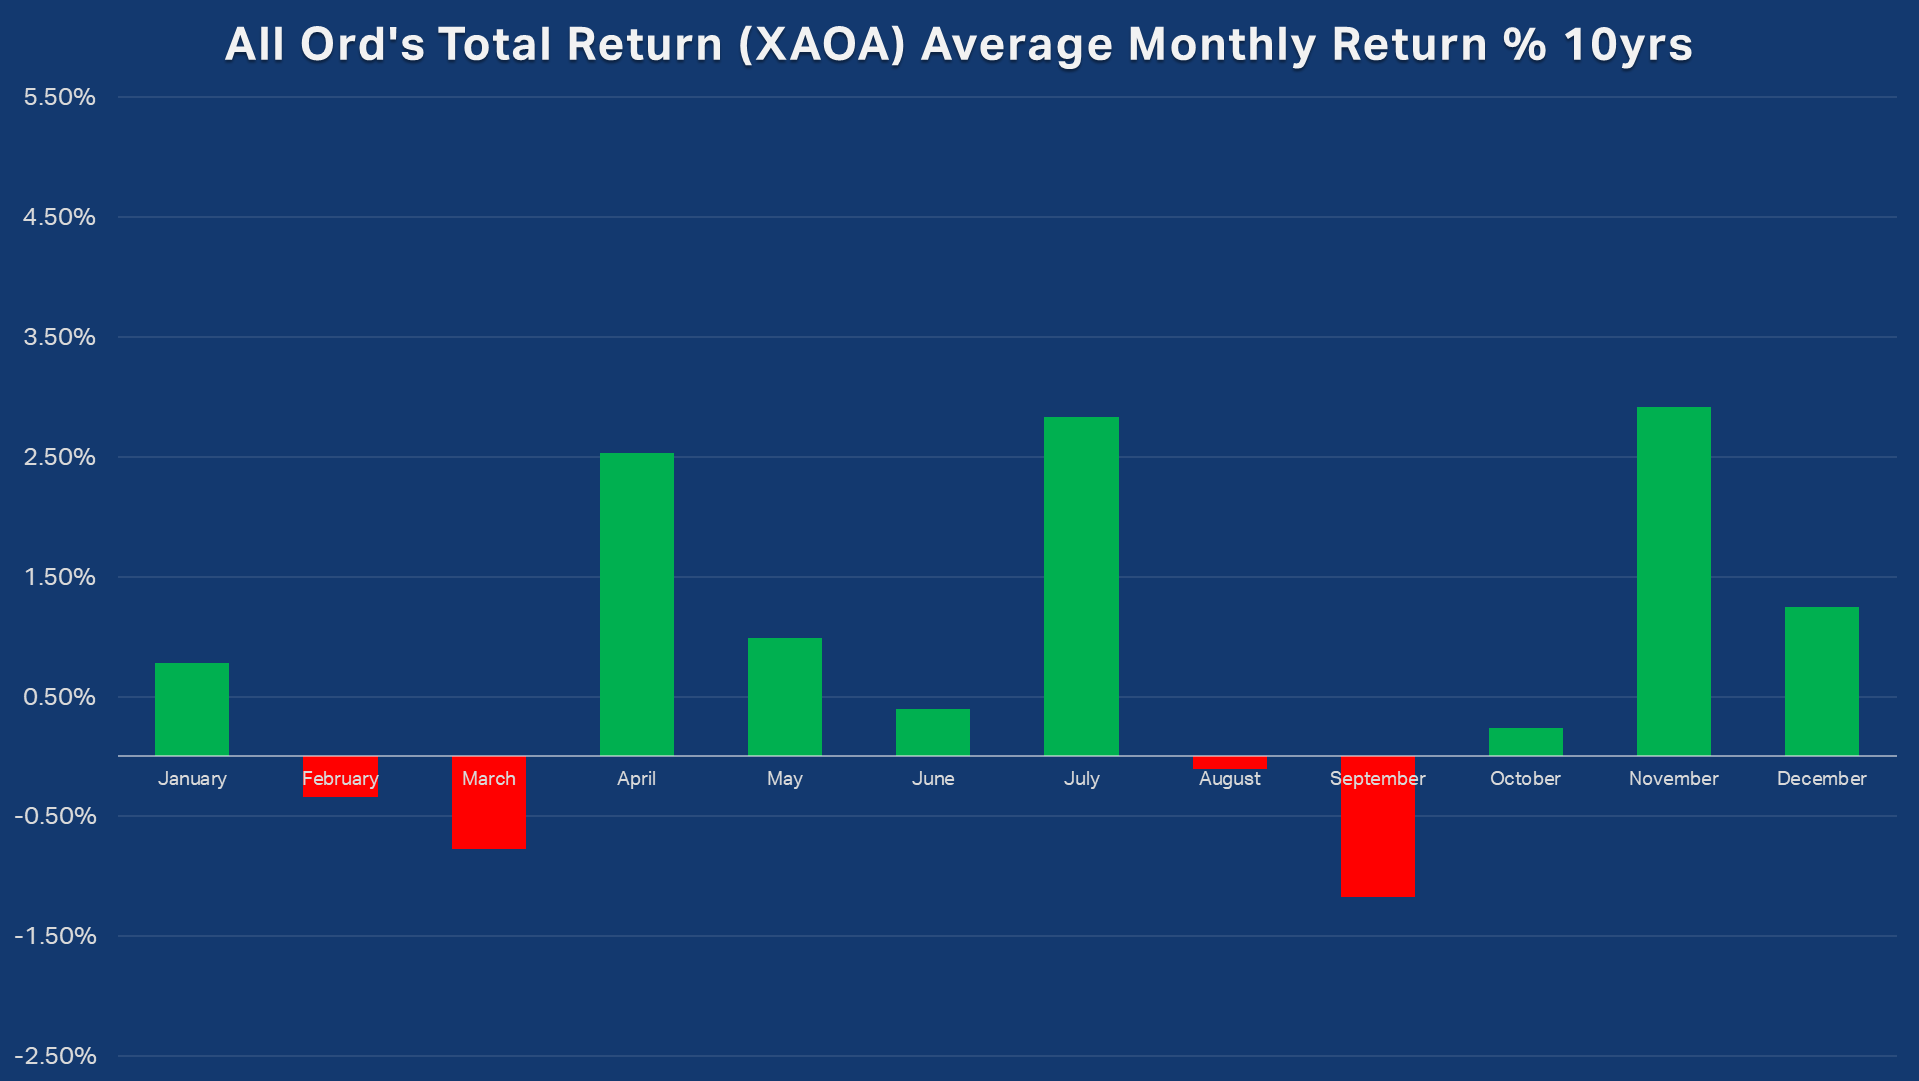
All Ordinaries Total Return XAOA Average Monthly Return 10 years (click here for full size image)

Returns: If the trend is your friend, then it’s no friend of Aussie investors over a 10-year lookback period! September’s average weakness deepens – now to a rather nasty -1.2% – while October’s average dips but holds slightly positive. Interestingly, August has dipped to a loss, and May-June weakness has switched to February-March (these observations are super interesting – can you think of an explanation for them!? 🤔)
Perhaps the most important difference here as far as this time of the year is concerned, is the supercharging of November’s return.
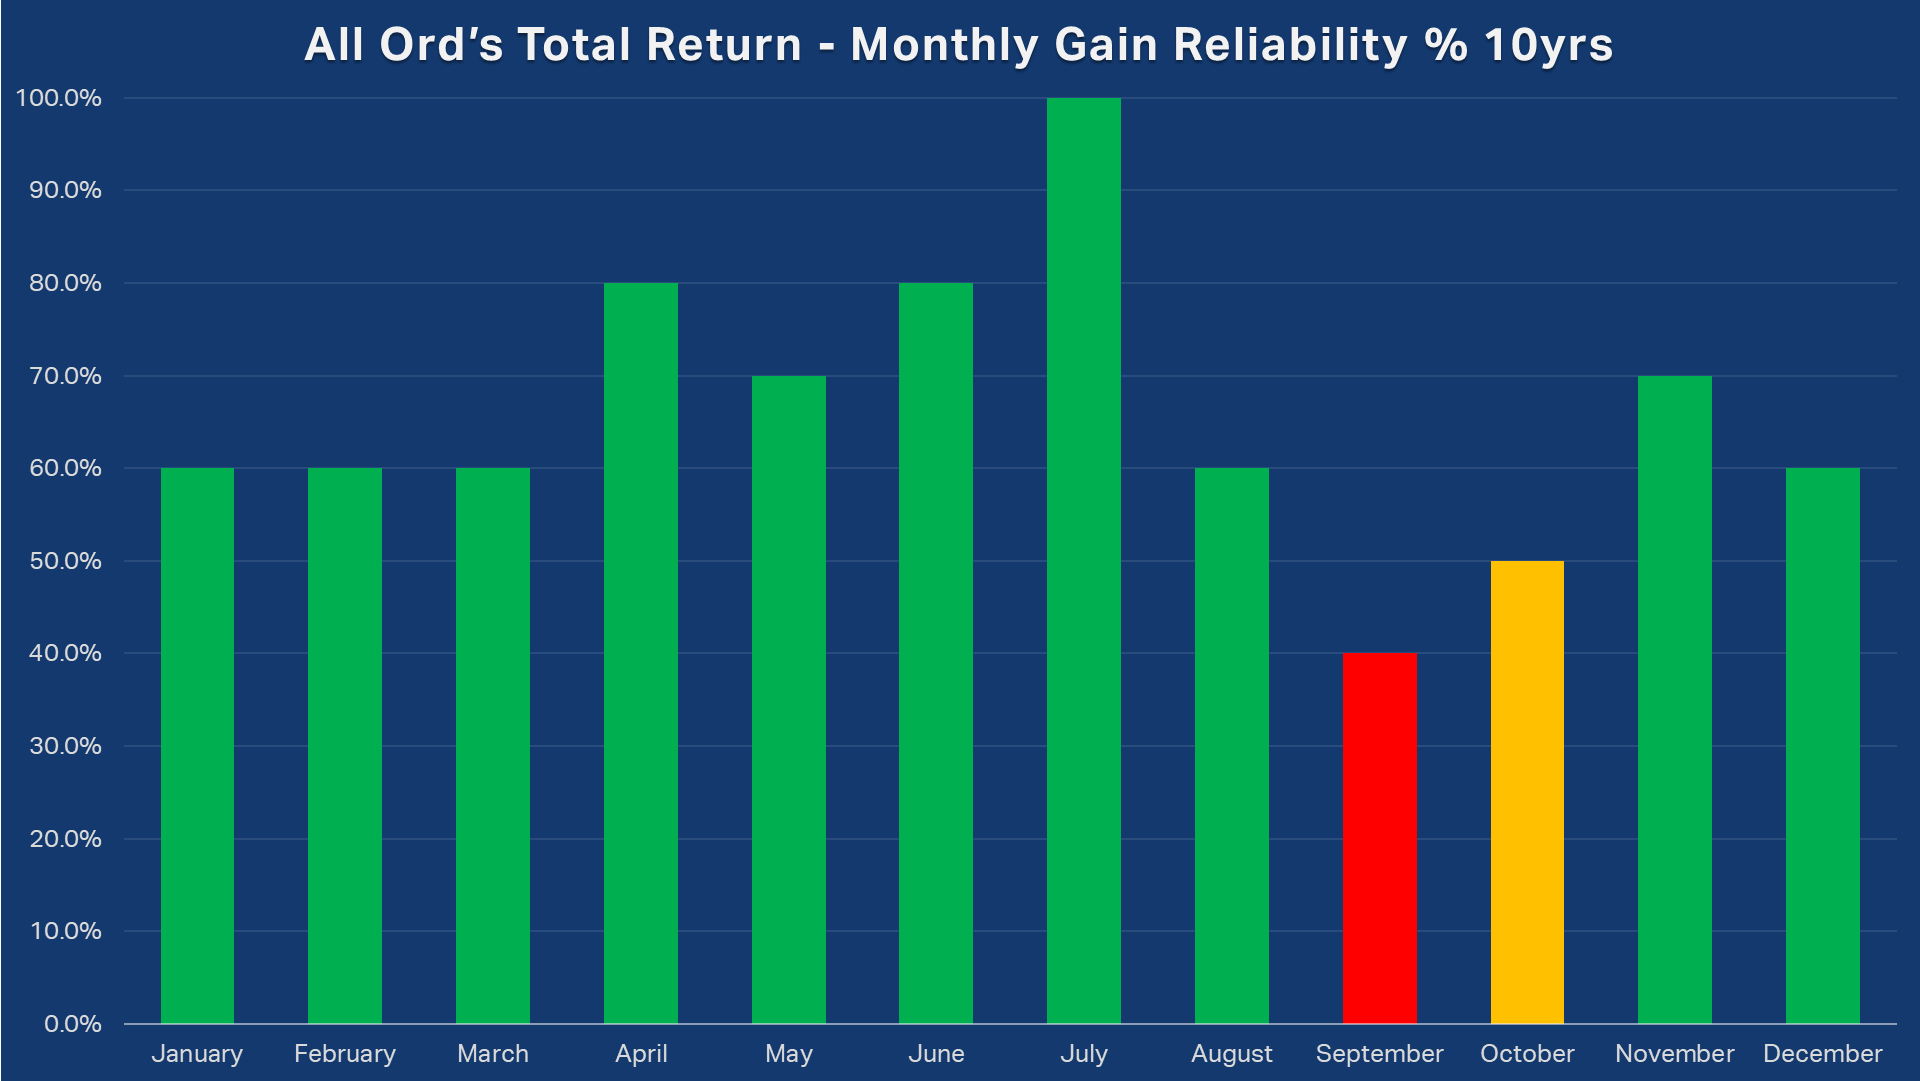
Reliability: This is the first lookback period where September’s gain reliability falls below 50% (i.e., it is more likely to be a down month than an up month), while October has dipped to a 50-50 bet…
Takeaway: Properly swooning now! The two-month performance with October is looking dodgy too…
Australian share market Seasonality - 5 years

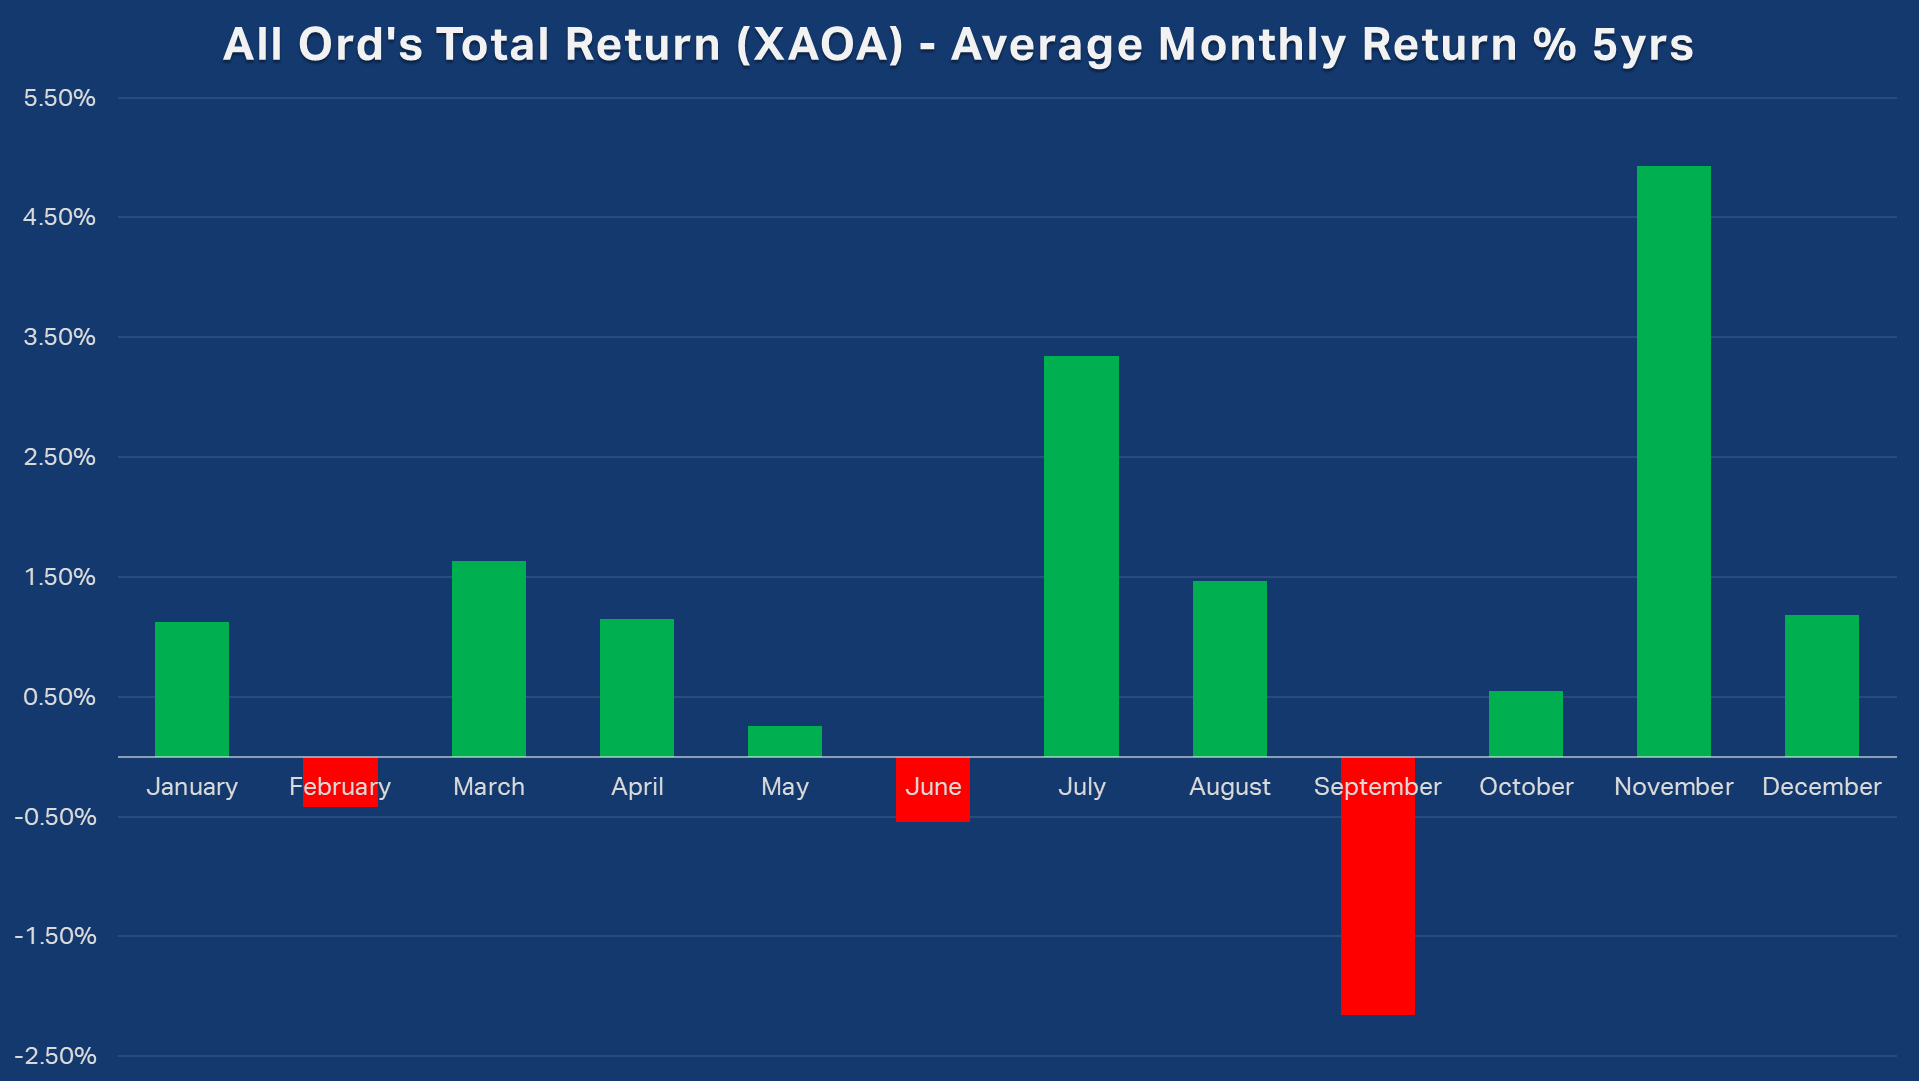
All Ordinaries Total Return XAOA Average Monthly Return 5 years (click here for full size image)

Returns: Small sample, but starting to get a little serious now at a -2.2% average September decline. November is now a clear standout as the best month of the year.
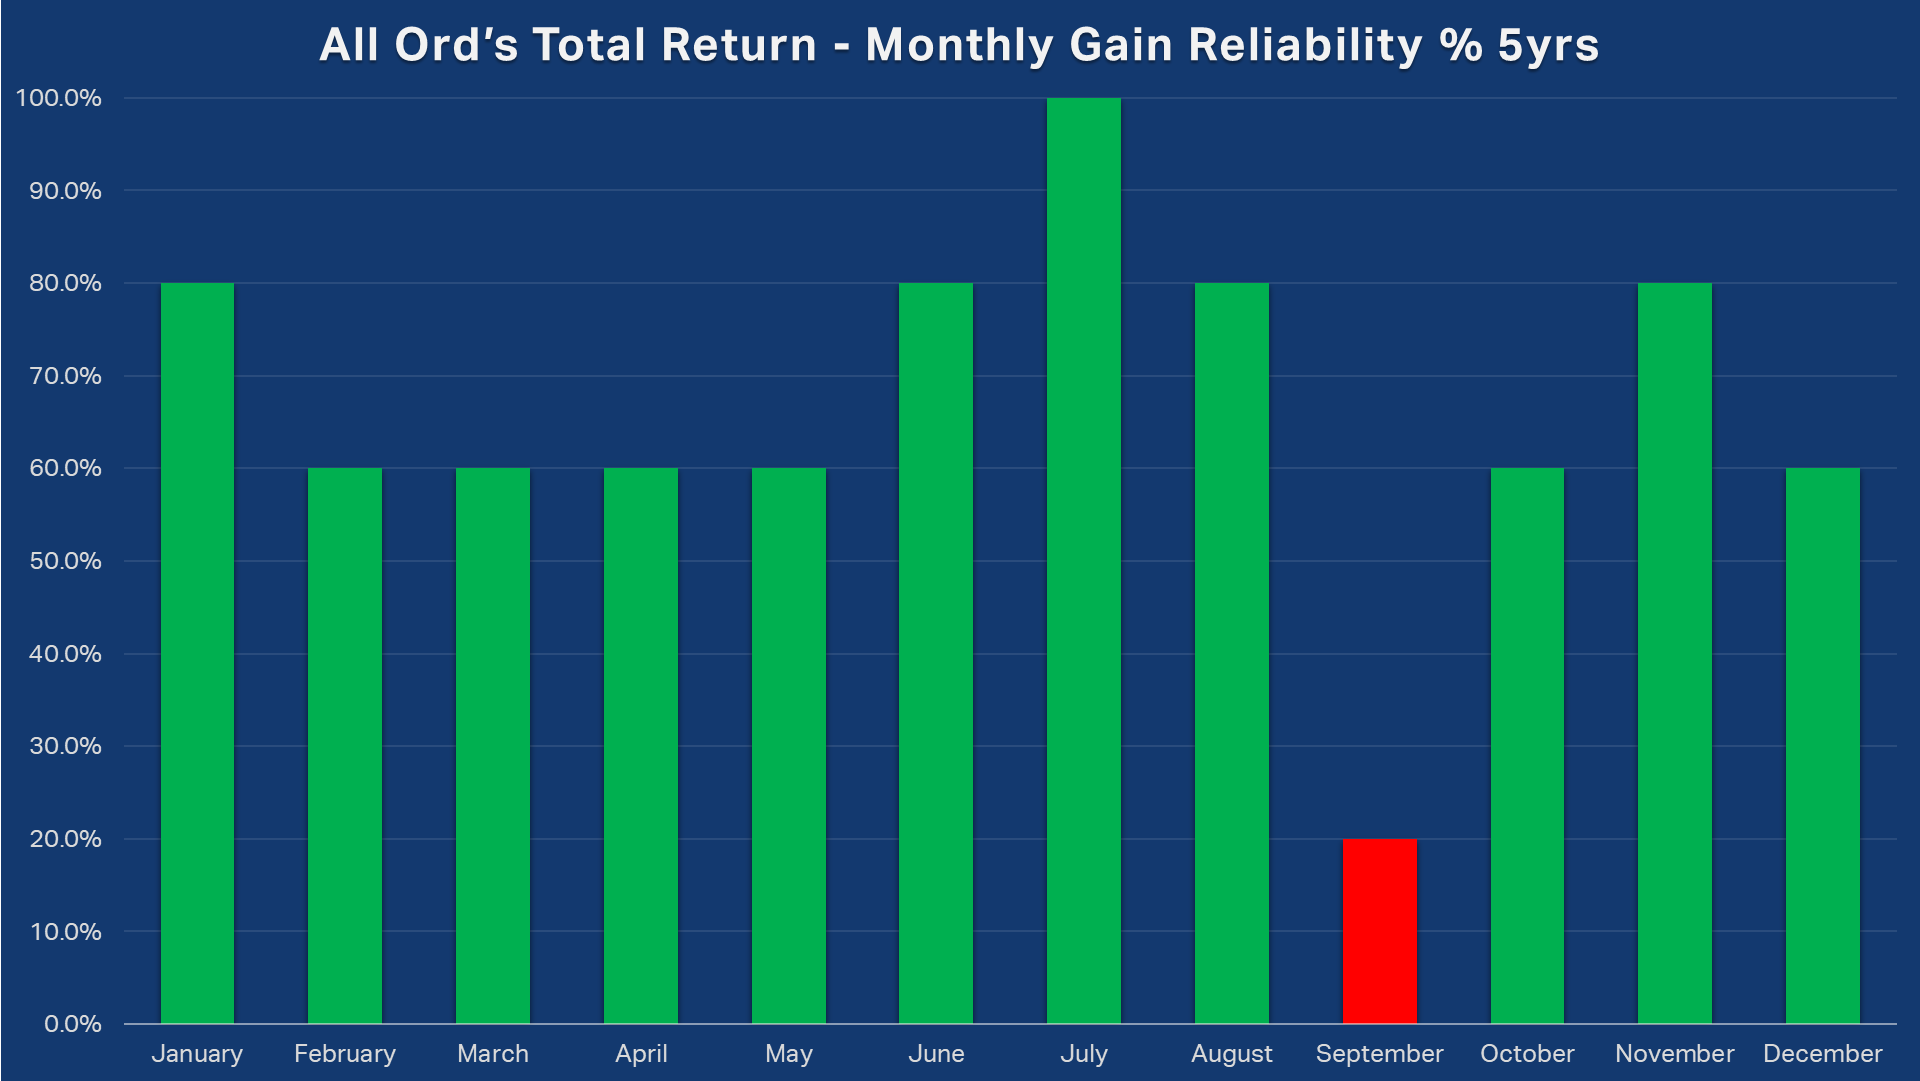
Reliability: Looks completely shot here, with 4 out of 5 of the last Septembers showing losses. October is still generally an up month.
Takeaway: The most recent sample, albeit a brief one, is the starkest demonstration of the existence of the September Swoon.
The devil is in the detail
Why can shorter windows differ from long-run averages? Because seasonality can evolve – sometimes precisely because investors anticipate it. When enough traders “front-run” a well-known seasonal pattern, flows and positioning can time-shift returns (or compress them) in shorter samples.
I suspect that’s what’s happening with the May seasonal weakness evident in longer lookback periods compared to February-March weakness in shorter lookback periods – some capital is front running the phenomenon, therefore pushing negative returns into earlier months.
But September’s problems appear to remain steadfast over all lookback periods.
Also consider that statistical significance matters. The 10- and 5-year lookback windows provide us with just 10 and 5 observations per month – far too few for high-confidence inference. We should only ever treat these readings as indicative (they are far from definitive!). Even so, here are the key differences that I feel show up clearly in the shorter lookbacks compared to our analysis in Part 1:
1. September Swoon is a real phenomenon, and drawdowns grow with recency
September is consistently the worst month of the year, and the average September return grows worse in recent years.
2. The bounce starts in October, but November could be the month to watch
October appears more like a stabiliser than a launchpad – small positive on average with middling gain reliability. But, looking at just how good November tends to be across all lookback periods, particularly in recent samples, it makes sense that investors should be looking for a major market low sometime in this month.
3. Higher dispersion
Recent samples suggest wider variability around September/October outcomes, possibly a reflection of a macro event-risk (e.g., COVID-19) and/or possibly even greater crowding around this known seasonal trade.
September influences: Does July–August dictate September performance?
We really only have one question to answer now. We know that September is generally a poor month for Australian share market returns, but is there some other nugget in the data that might help us determine if some Septembers are more prone to swoon than others?
One of the other, most reliable seasonal trends shown in the charts above, and in the 40-year lookback period from Part 1, is the relatively strong performance and gain reliability of the July-August period. July is 10 from 10 gains over the last 10 years for example. For me, this begs the question: Does the performance of July-August influence September’s performance? More specifically, is there something about the July-August just gone that might guide us towards a conclusion for this year’s September performance? 🤔
With this in mind, I checked the data to see if the XAOA’s performance in July and August tended to lead to corresponding strength or weakness in September. Here are the results.

July-August vs September Seasonal Data (click here for full size image)
Key takeaways
At longer horizons (40 / 30 / 20-years):
Strength begets strength – The September Swoon disappears
Weakness begets weakness – The September Swoon intensifies
At shorter horizons (10 / 5-years):
September looks weak regardless, with both average return and gain reliability plunging
The XAOA logged a 5.8% return this July-August, roughly average compared to the 40-year lookback period, but stronger than all of the other lookback periods. If we consider 40, 30, and 20-year lookback periods, they suggest that this September has a better than 60% chance of delivering a small positive return – i.e., the Australian share market’s record breaking run can continue.
However, if we incorporate the two shorter lookback periods, then it appears that regardless of this year’s July-August heroics, we’re probably in for a tough run this month no matter what…
Conclusion: So what’s this September’s strategy? 🤔
This is the part of all of my seasonality articles where I remind readers that seasonality isn’t magic! 🔮 It’s simply a context tool used by discretionary traders and quantitative hedge funds to flag times of the year where something tradeable might be about to happen. It’s a heads up – and in the case of the September Swoon – an early warning tool to remind us to be attentive to signs of weakness appearing in other technical and quantitative indicators that may strengthen the case a particular move is imminent.
On this point, I am not yet seeing any of those confirming signs. If you follow my daily technical analysis updates on the S&P/ASX 200 and the Nasdaq Composite (USA) in the Market Index Evening Wrap, you’ll know that my trend, price action, and candlestick metrics all demonstrate strong demand-side control. This is my jargon for: The bull market is intact. Of course, as these metrics change, my view will change – and I will be super attentive to these changes and their implications as per the seasonal data I’ve shared with you here.
One thing is for sure, however: The big, systemised trading funds that move markets act on data – and they run exactly the kinds of research and conditional testing we’ve shown here. When enough capital leans the same way at the same time, seasonal tendencies can become self-fulfilling, at least at the margin. So, as I said in Part 1: Those who do not learn from the past are condemned to repeat it – and when it comes to investing, repeating past mistakes is frustrating and expensive!
This article first appeared on Market Index on 1 September 2025.
Never miss an update
Enjoy this wire? Hit the ‘like’ button to let us know.
Stay up to date with my current content by
following me below and you’ll be notified every time I post a wire
Carl has over 30-years investing experience and has helped investors navigate several bull and bear markets over this time. He is a well respected markets commentator who specialises in how the global macro impacts Australian and US equities. Carl has a passion for technical analysis and has taught his unique brand of price-action trend following to thousands of Aussie investors.
........
Investing is risky. Inevitably you will endure losses. If you can't cope with losing, don't invest.

5 topics
10 stocks mentioned

Carl has over 30-years investing experience and has helped investors navigate several bull and bear markets over this time. He is a well respected markets commentator who specialises in how the global macro impacts Australian and US equities. Carl...
Carl has over 30-years investing experience and has helped investors navigate several bull and bear markets over this time. He is a well respected markets commentator who specialises in how the global macro impacts Australian and US equities. Carl...
Comments
Comments
Sign In or Join Free to comment