TOL - 29th Aug, 2025
Watch out investors! The ASX 200's record run may be about to implode as “September Swoon” looms
Australian shares have been on a record-setting run, but we’re about to enter the worst period of the year, a time when stocks have tumbled!
Australian shares have been on a record-setting run, brushing the 9,000 level and, for now, shrugging off the usual list of reasons for caution: elevated valuations versus history, global trade uncertainty, weak commodity prices, a slowing Chinese economy – plus insert your typical naysayer’s narrative in here! (Aren’t they just the most boring people at parties!? 😁)
For students of seasonality, none of this is especially surprising. Technical analysts – your author included – who keep meticulous seasonal records, know that July and August together form one of the best two-month stretches of the calendar for the local bourse. We also know, with equal conviction, that we’re about to enter the worst period. Da, da, dahhhmmm 🚨
The September Swoon is upon us! In just a few days, we’ll kick off what is statistically the worst month for Australian shares. This article examines long-run seasonal tendencies for the Australian share market and asks a simple question: As you read this line, is this as good as it gets for Aussie investors for quite some time?
Seasonal is reasonable
Seasonality is the study of recurring, calendar-linked patterns in returns. Many are aware of seasonality in agricultural commodity markets, which tend to behave in set ways around the changing of seasons and associated harvest and delivery to market patterns.
But seasonality also exists in the stock market. This is because there are similar set tendencies associated with known, periodic corporate events such as reporting and dividend cycles. There are also seasonal patterns linked with fund manager activity around month-end, quarter-end, and tax-year end.
Seasonality matters because it provides a statistical context for current market moves. But never forget! Seasonal analysis is not an oracle – it won’t tell you what’s about to happen – simply what we might expect based on what has tended to happen in the past. Used properly, seasonality sharpens our focus and facilitates the preparation for a range of possible outcomes – especially when markets are trading in either euphoric or despondent states prior to an opposing seasonal shift (um, like now!? 🤔).
Seasonality isn’t infallible, but it’s too useful to ignore!
ASX seasonality and the September Swoon
Our target of focus today is the All Ordinaries Total Return Index (XAOA). I prefer the All Ordinaries Index over the benchmark S&P/ASX 200 as it contains around 500 stocks, and is therefore arguably a broader measure of Australian share market performance.
The “total return” label is critical; the XAOA assumes dividends are reinvested, so it reflects the total return – price plus income. When it comes to seasonal analysis of share markets, total-return indices are non-negotiable. Any seasonal chart you’ve ever seen online that used a price-only index is misleading – bluntly, it is downright useless 👎.
Why? Because dividends cluster around reporting seasons, and ex-dividend dates mechanically reduce the price of individual stocks (and therefore price-only indices), while total return is unchanged. If you ignore dividends, you risk confusing a regular, mechanical adjustment with “seasonally weak performance,” corrupting any inference you draw from seasonal patterns.
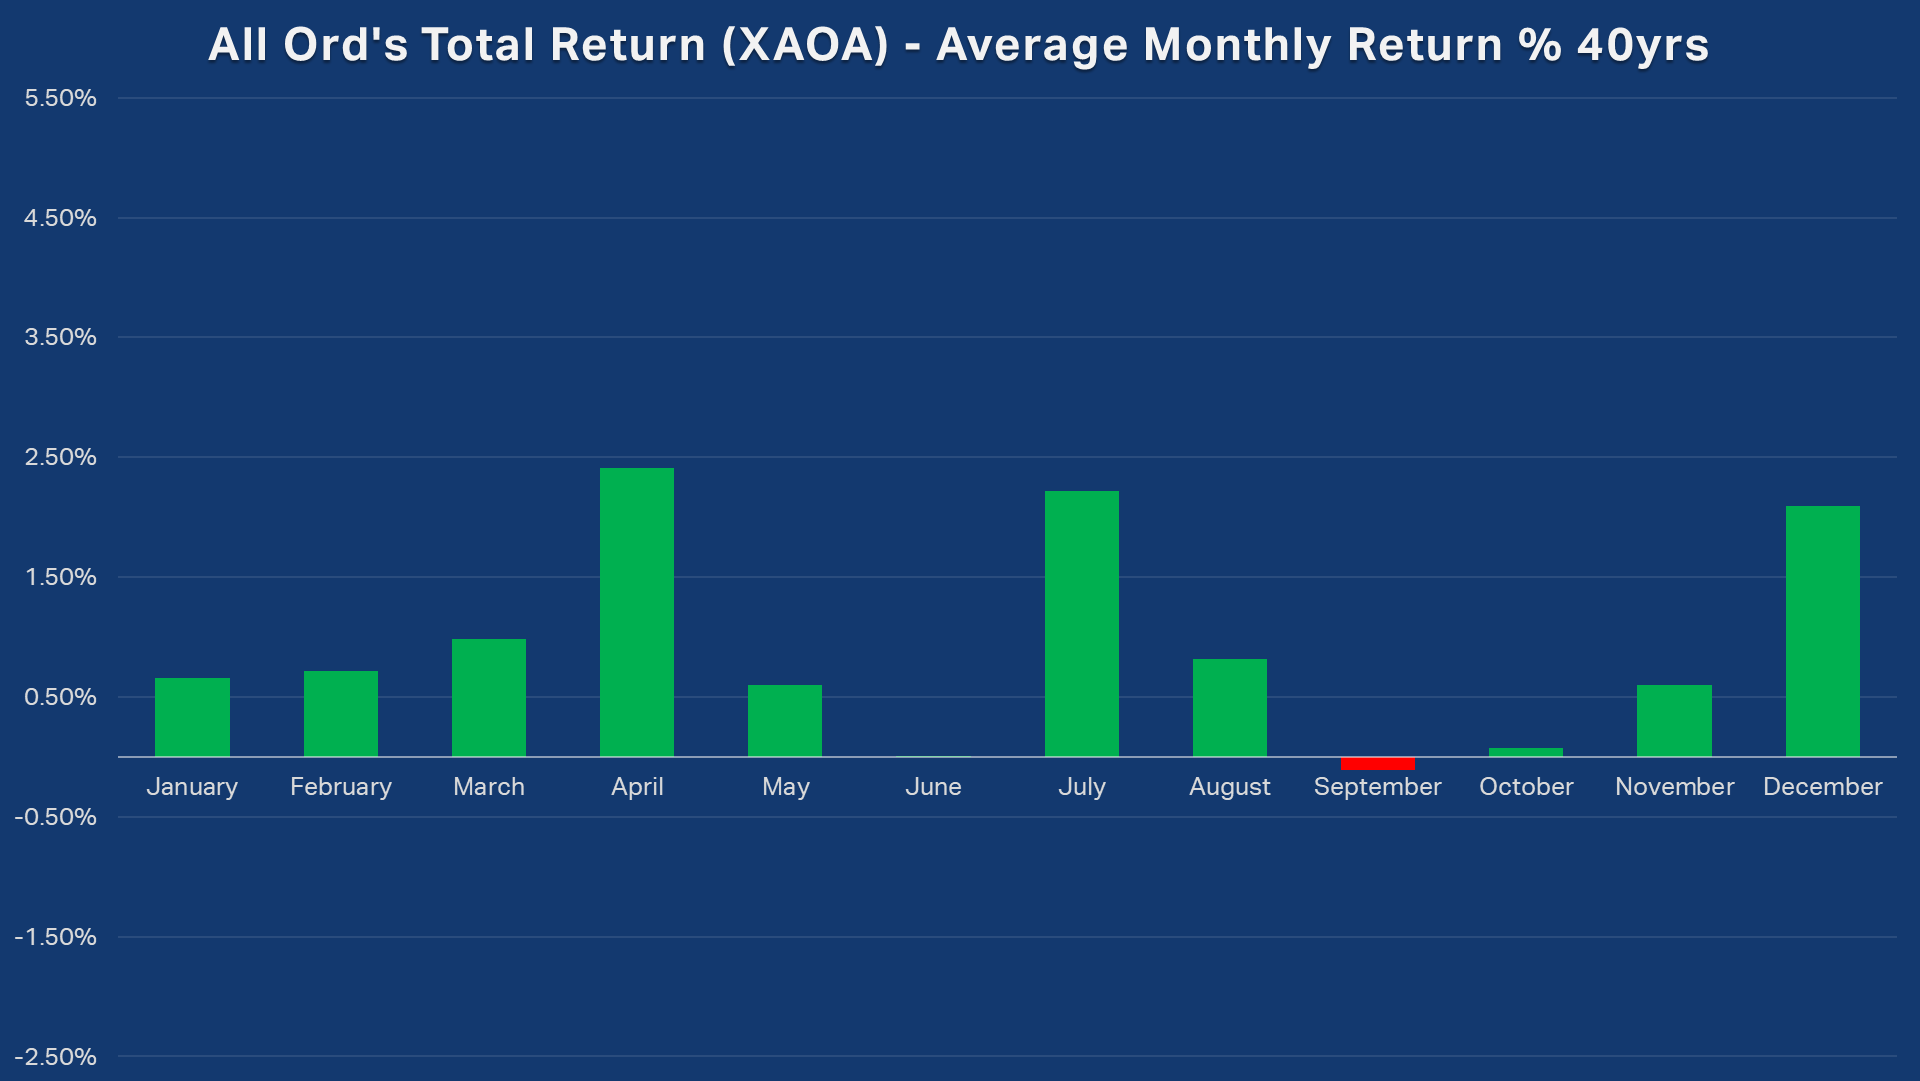
Seasonal data for the Australian share market of the detail I’m going to share with you today is rare (there’s plenty on the S&P 500 in the USA), and it’s even rarer to see it done properly with total return data. Let’s start with seasonal data for the XAOA over the last 40 years.
%20-%20Average%20Monthly%20Return%2040yrs.png)
That’s it? I hear you ask… September Swoon? More like September Snooze, Carl! 🤦
BORING! 🥱
Okay, I agree that an average return of -0.11% over the last 40 years hardly qualifies September as a harbinger of doom. But let’s put this modest decline into context – the rest of the months are all up months.
Think of it this way, we know that stock markets tend to rise over time – hey, economies tend to grow over time (isn’t that the whole point of capitalism and increasing the living standards for us all!?). This is a bit of a given, so we should expect a really long-term seasonal chart like the one above to show every month with an average gain.
Except September doesn’t – and I put it to you that does mean something!
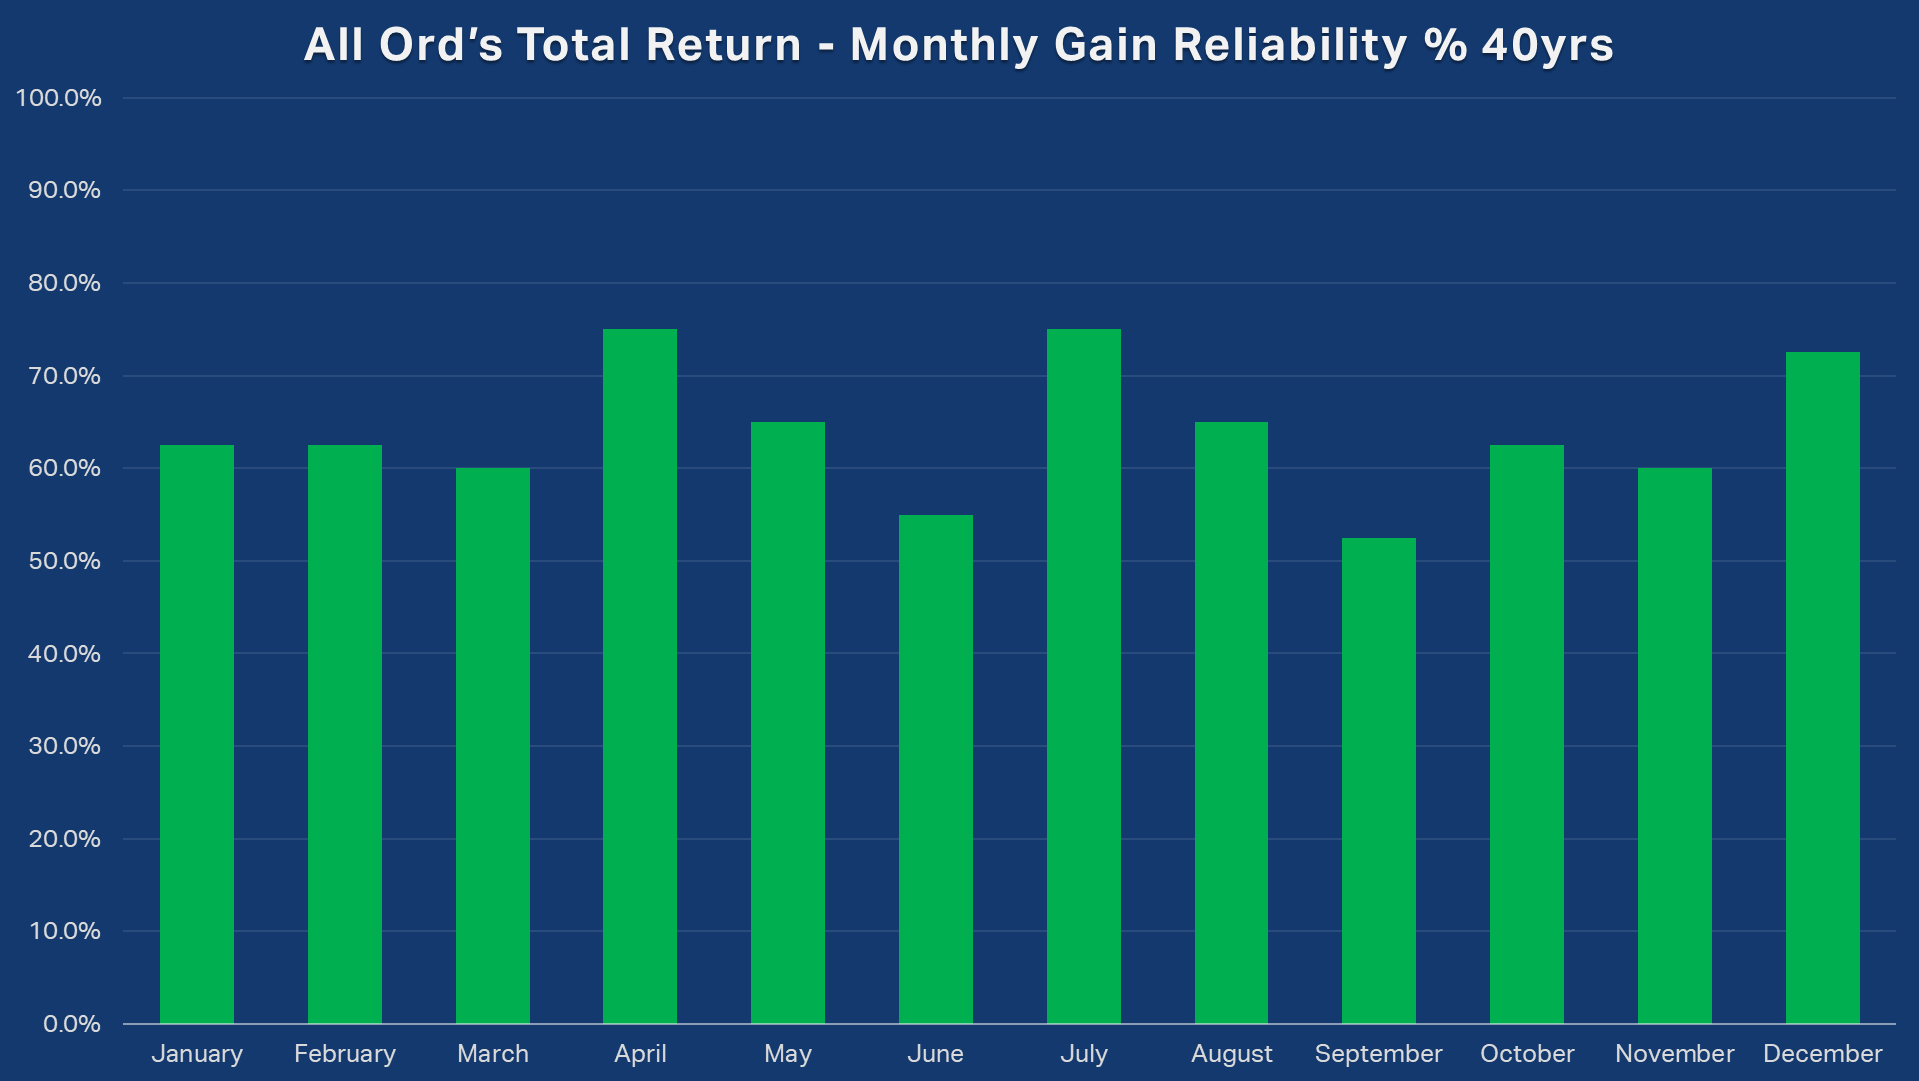
Next, to reliability. Overall, we have seen that September appears to be a poor month for returns on the Australian share market, but how often is it actually a down month? The chart below shows the Monthly Gain Reliability for each month of the year for the XAOA over the last 40 years. We can see that all months show a reliability of greater than 50% – so more often than not over the period, each month shows a gain and not a loss. Note that September is again the worst month of the year on this metric, i.e., it’s the least reliable month with a gain percentage of just 52.5%.

Why is September such an outlier? It could be because of post August reporting blues or something to do with the fact that dividends are collected in September (not due to the depreciating effect of dividends themselves – we’ve accounted for that – but potentially due to dividend harvesting strategies), the fact that US markets return from summer holidays, or a reaction to the fact that July and August are usually pretty good months (i.e., potentially just a pullback).
Or it could be a simple coincidence. Either way, history shows that several major market downturns started in September. October usually gets a bad wrap too, after all, the 1987 stock market crash occurred in October, as did a massive plunge in 2009 amidst the Global Financial Crisis. Interestingly, though, October shows a monthly average gain over the last 40 years – albeit a sliver at +0.07%.
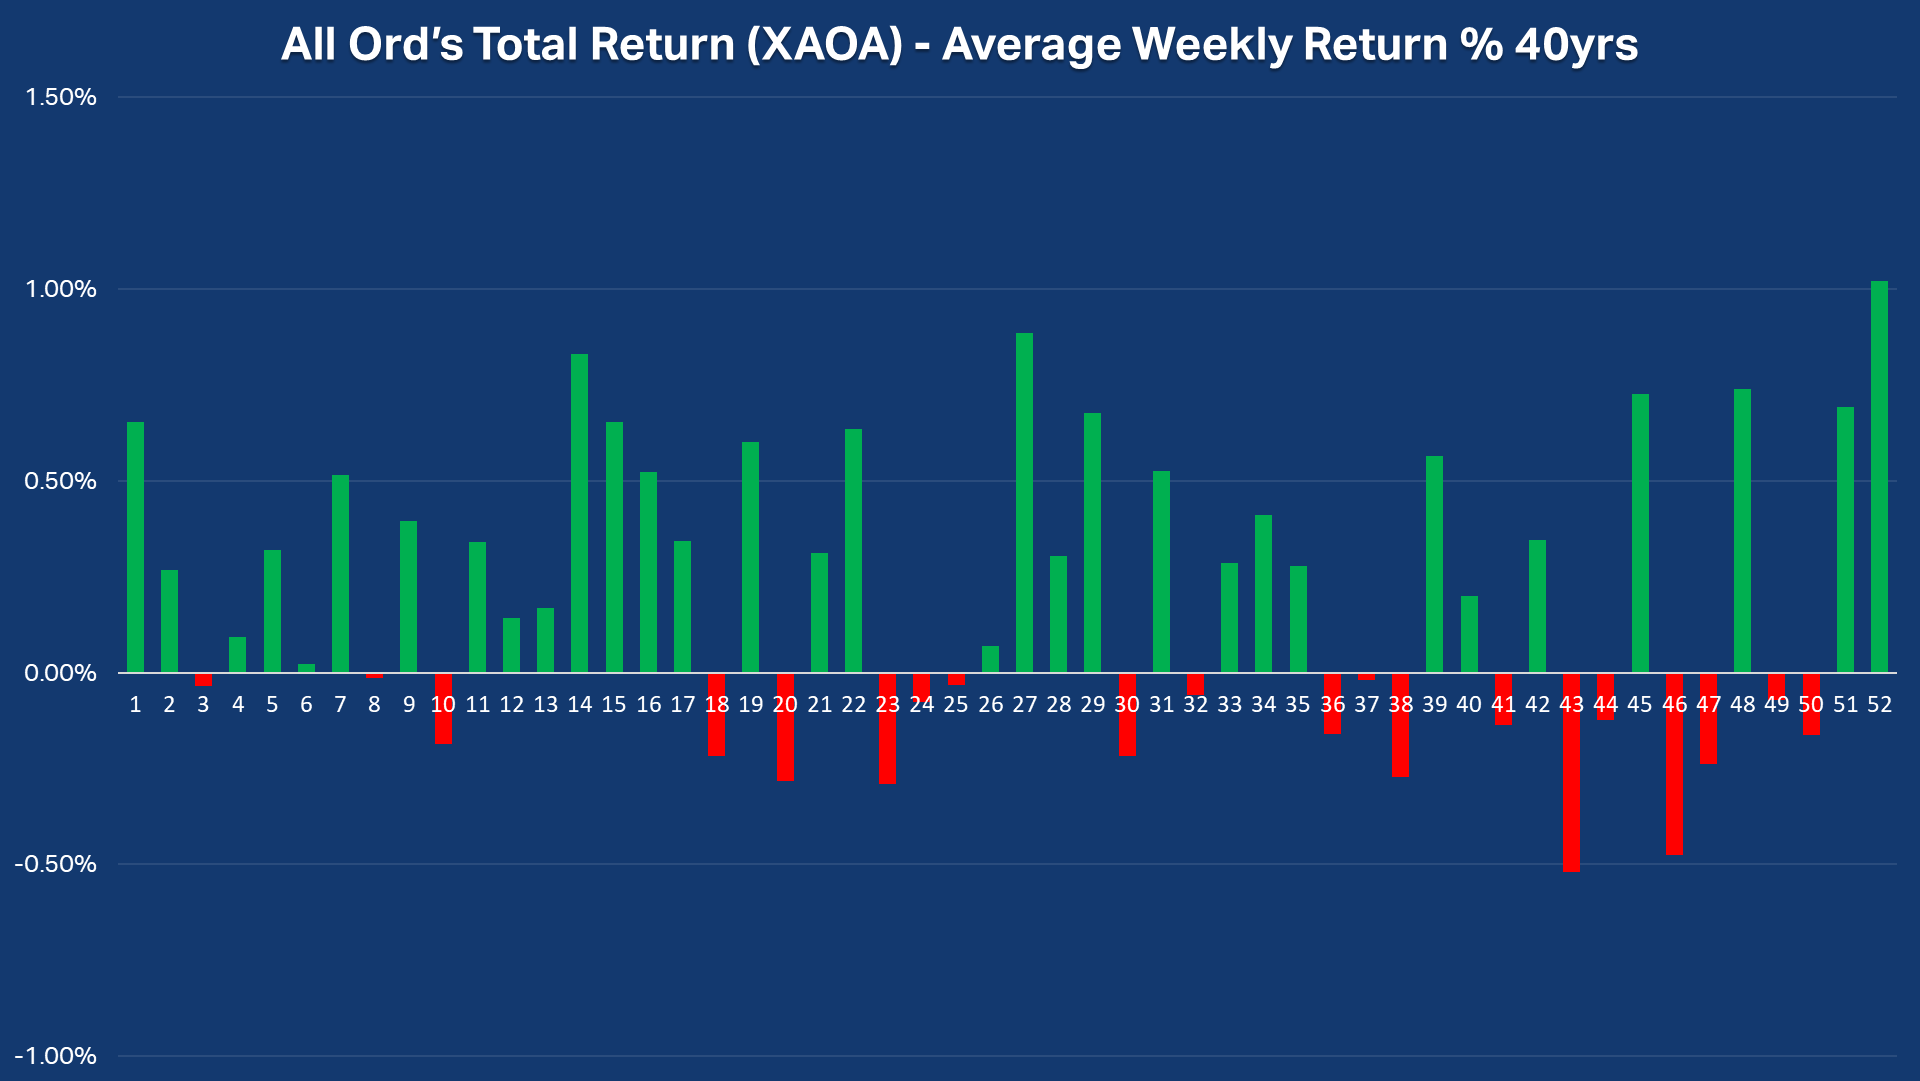
The fact of the matter is that a rebound is probably saving October from September’s Swoon (yes, I’m sticking with that catchy moniker!). Check out the chart below which shows seasonality on a weekly basis over the last 40 years (you will not get this degree of detailed seasonal analysis on Aussie shares from anywhere else! 💪).
%20-%20Average%20Weekly%20Return%2040yrs.png)
Note October’s typical weeks of 39-43 (it can vary a little depending on the day of the week of January 1). Strong performances in the first two weeks, and the third, only just make up for what is typically a terrible final week. No doubt your eye has also been drawn to some pretty terrible weeks in November (weeks 44-47). Indeed, only one week in November is typically an up-week – and looking back up to the Monthly chart – it typically proves sufficient to yield a positive overall monthly performance.
Friday will close out typical week 35. This more granular look at seasonal patterns in Australian shares suggests an even greater level of alertness is required for investors – as really, from next week (i.e., week 36) – volatility in the Australian share market has really ratcheted up. It is possible that we’re on the cusp of 11 weeks of intense swings in both directions, and disturbingly, one that clearly contains historically the worst weeks of the year.
Strap in for a Swoon! ⚠️
That’s where I’m going to end our seasonal sojourn today, but there’s plenty more research I want to present on this issue in future articles. In particular, I’d like to show you how some of the seasonal patterns shown here have played out over shorter lookback periods, like 20 years, 10 years, and 5 years (Hint: The September Swoon is even more apparent!). I’d also like to investigate how the XAOA’s performance in July and August impacted its performance in September, so, for example, did a really good July-August period yield a better/worse September and vice versa?
As I prepare this research, I trust that today’s investigation should at least put this issue on the radar for you. If history is anything to go by, then right now… today… could be as good as it gets for the Australian share market for several weeks. At this point, I am reminded by one of my favourite sayings (markets or otherwise!): Those who do not learn from the past are condemned to repeat it.
PART 2 IS OUT! 🧐
Your can read it here: ASX 200 has date with destiny in September as records look set to tumble
This article first appeared on Market Index on Wednesday, 27 August 2025.
Never miss an update
Enjoy this wire? Hit the ‘like’ button to let us know.
Stay up to date with my current content by
following me below and you’ll be notified every time I post a wire
Carl has over 30-years investing experience and has helped investors navigate several bull and bear markets over this time. He is a well respected markets commentator who specialises in how the global macro impacts Australian and US equities. Carl has a passion for technical analysis and has taught his unique brand of price-action trend following to thousands of Aussie investors.
........
Investing is risky. Inevitably you will endure losses. If you can't cope with losing, don't invest.

%20-%20Average%20Monthly%20Return%2040yrs.png)
%20-%20Average%20Weekly%20Return%2040yrs.png)
5 topics
11 stocks mentioned

Carl has over 30-years investing experience and has helped investors navigate several bull and bear markets over this time. He is a well respected markets commentator who specialises in how the global macro impacts Australian and US equities. Carl...
Carl has over 30-years investing experience and has helped investors navigate several bull and bear markets over this time. He is a well respected markets commentator who specialises in how the global macro impacts Australian and US equities. Carl...
Comments
Comments
Sign In or Join Free to comment
most popular
Equities
The Magnificent Seven can’t carry the market forever
Pzena Investment Management