TOL - 5th Dec, 2025
ASX 200 Outlook: Will stocks enjoy a Santa Claus Rally this year? The data says yes
Santa may still come for the ASX – but January could be the Grinch. This data reveals a seasonal twist investors can’t afford to ignore.
 Add us as a preferred Google source
Every investor knows markets move in cycles – but few realise that some of those cycles run on a calendar, not a business cycle. That’s seasonality: the study of recurring return patterns that surface at roughly the same time each year. Think of it as the market’s “circadian rhythm.”
Some markets wear their seasonality on their sleeve, like agriculture, whose supply and demand cycles are locked to seasonal weather patterns – but stock markets also demonstrate seasonal patterns. In many ways, stocks are impacted by events that are as regular as the seasons, such as:
Earnings (quarterly, half-yearly, and full-year)
Dividends (typically following the above)
Dividend reinvestment (i.e., after dividend cheques hit bank accounts)
Major holidays, e.g. summer holidays in the Northern Hemisphere
And if you’re going to study seasonality in Australian shares, you must use the right instrument. That means ditching any price-only index like the typical S&P ASX 200 benchmark, and using total return data that adds back the impact of dividends.
You see, each time a dividend is paid, the stock price of the company paying the dividend usually drops by the amount of the dividend – and for Aussie stocks – at least some of the attached franking credits. This naturally depresses price-only indices like the ASX 200. Given that dividends and franking credits often account for roughly half of the Australian stock market’s return, ignoring them means you're only considering half of its total return picture.
Enter the All Ordinaries Total Return Index (XAOA). It’s the index I use for all of my seasonal analysis on the Australian stock market. First, it takes into account the top five hundred ASX-listed stocks (compared to the ASX 200’s two hundred), and as it's a total return index, so it adds back dividends.
This brings us to November – a month that typically behaves well for investors, yet this year delivered a -2.5% drop in the XAOA, its weakest since 2014. Such a deviation from the norm raises the question: does a poor November tell us anything about what comes next?
More importantly, does it support or disrupt the fabled Santa Claus Rally – and more broadly, the fuller summer rally that often runs into January and February? That’s exactly what we’re going to investigate in this article. Let’s dive in!
‘Tis the Season to be optimistic…
Let’s start by investigating the monthly returns of the XAOA over various lookback windows. I use 5- and 10-year windows to capture shorter term seasonal trends, and 20-, 30-, and 40-year windows to capture longer term ones.
-
Shorter term lookback windows
Pro – more sensitive to changes in seasonal trends
Con – small sample size risks early or erroneous conclusions
-
Longer term lookback windows
Pro – more data, so more likely to be statistically relevant
Con – can be slower in picking up changes in seasonal trends
Each chart uses the same scale so you can compare them visually on a like-for-like basis. As you scroll through them, keep an eye out for the seasonal patterns in Australian shares that consistently show up across the different timeframes:
April, July and December are typically the strongest months
May-June and September are typically the weakest months
July-August and November-January are typically the strongest windows of the year
%20Average%20Monthly%20Return%20percent%2040yrs.png)
%20Average%20Monthly%20Return%20percent%2030yrs.png)
%20Average%20Monthly%20Return%20percent%2020yrs.png)
%20Average%20Monthly%20Return%20percent%2010yrs.png)
%20Average%20Monthly%20Return%20percent%205yrs.png)
Immediately, these classic markets colloquialisms begin to emerge:
“Sell in May and go away” – reflecting typical May-June weakness.
“Santa Claus Rally” – reflecting typical strength in the lead up to Christmas, which often continues into January (i.e., the "summer rally").
“September Swoon” – reflecting the general tendency of markets to dip in September (September is the only month of the year to show a negative average return over all lookback windows).
Let’s look at monthly returns through a slightly different lens – reliability. The charts below show how often each month delivered a positive return over the lookback period, e.g. a reliability of 50% indicates an equal number of winning and losing months.

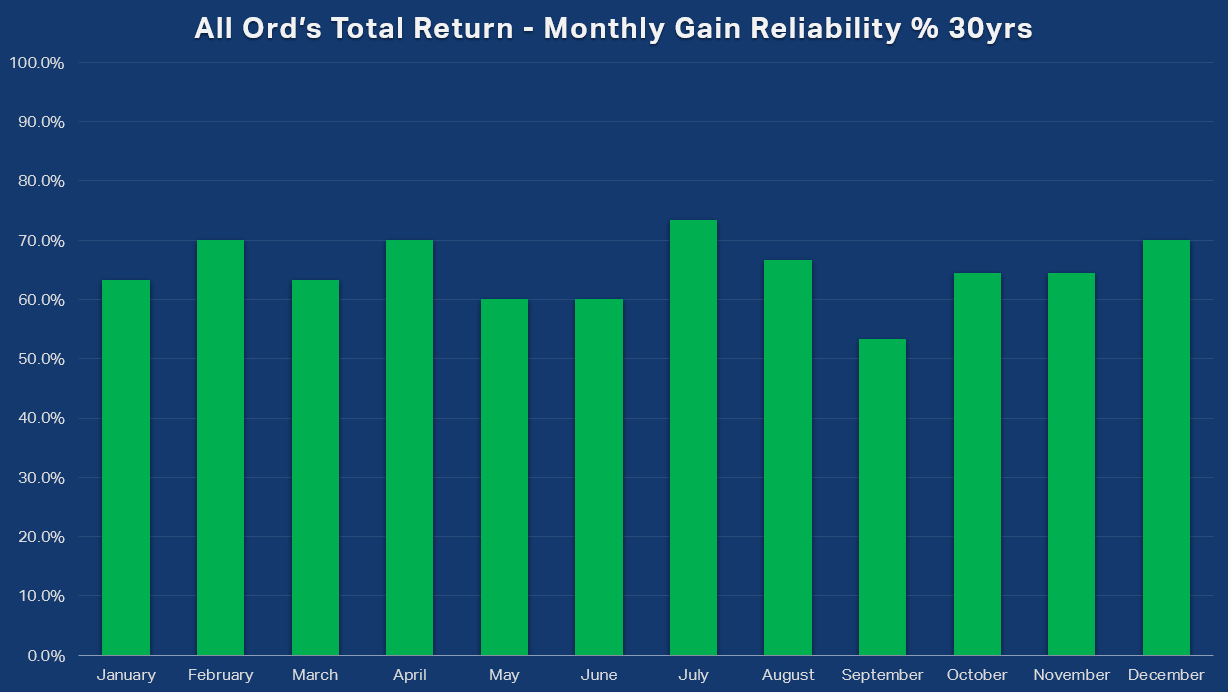


The reliability data further reinforces the return data. We can see that:
July is arguably the most reliable month of the year (i.e., its average reliability over the lookback windows is 85.7%), followed by April (72% average reliability), August (70.3% average reliability) and December (65.5% average reliability).
September is the least reliable month of the year / most reliable month of the year for falls (42.7% average reliability).
Other less reliable months include November (61.1% average reliability) and March (61.7% average reliability – “Beware the ides of March!”)
Does this November’s slip spoil Santa’s rally?
Statistically, this November’s -2.51% performance wasn’t a collapse – just unusually soft. At 0.8 standard deviations below the long-run mean of +0.68%, it clears the “bad month” bar without getting anywhere near the “rare event” threshold.
But does a bad November tend to impact December’s performance, and more broadly, the New Year rally into January? Let's check the average and median December returns over the various lookback windows based on whether November was an up ⬆️ or down ⬇️ month:
| 40-Year Nov vs Dec Comparison | Dec Return % |
| Average Dec vs ⬆️ Nov | +2.21% |
| Median Dec vs ⬇️ Nov | +1.84% |
| Median Dec vs ⬆️ Nov | +2.54% |
| Average Dec vs ⬇️ Nov | +1.91% |
| 30-Year Nov vs Dec Comparison | Dec Return % |
| Average Dec vs ⬆️ Nov | +2.06% |
| Median Dec vs ⬆️ Nov | +2.54% |
| Average Dec vs ⬇️ Nov | +1.12% |
| Median Dec vs ⬇️ Nov | +1.42% |
| 20-Year Nov vs Dec Comparison | Dec Return % |
| Average Dec vs ⬆️ Nov | +1.94% |
| Median Dec vs ⬆️ Nov | +3.04% |
| Average Dec vs ⬇️ Nov | +0.83% |
| Median Dec vs ⬇️ Nov | +0.92% |
| 10-Year Nov vs Dec Comparison | Dec Return % |
| Average Dec vs ⬆️ Nov | +1.08% |
| Median Dec vs ⬆️ Nov | +1.75% |
| Average Dec vs ⬇️ Nov | +1.62% |
| Median Dec vs ⬇️ Nov | +2.65% |
| 5-Year Nov vs Dec Comparison | Dec Return % |
| Average Dec vs ⬆️ Nov | +0.81% |
| Median Dec vs ⬆️ Nov | -0.55% |
| Average Dec vs ⬇️ Nov | +2.67% |
| Median Dec vs ⬇️ Nov | +2.67% |
The idea that a weak November kills the Santa Claus Rally just doesn’t hold up under any serious statistical inspection. Yes, over the full 40-year dataset, December tends to be slightly stronger after a positive November – a +2.54% median gain versus +1.84% after a down month – but the bigger point is that December is historically positive either way.
Seasonal data suggests the Santa Claus Rally doesn’t depend on November giving it a head start.
There is a very modest diminishment in median December performance if November is a down month over the longest lookback window. This is also reflected in the 30-year (⬆️ November +2.54% vs ⬇️ November +1.42%) and 20-year samples (⬆️ November +3.04% vs ⬇️ November +0.92%).
But before you get too pessimistic about this month’s prospects, consider that more recently, the pattern has flipped. Over the last 5- and 10-years, December has actually been stronger after a down November, with median returns of +2.65% and +2.67% respectively – comparing favourably with +1.75% and -0.55% after up Novembers.
In other words, some of the best December rallies of the past decade have come precisely when the market looked tired, frustrated, or pessimistic.
What about a happy New Year?
The Santa Claus Rally seems intact – regardless of whether November was up or down. But what if December’s typical strength hides underlying issues that began in November – weakness simmering under the surface of December’s revelry and ready to re-emerge in January as Santa’s sleigh fades into the distant north?
When you splice the data of whether November was up or down with January's performance, a clear pattern in the new year emerges – not one that kills the Santa + New Year Rally entirely, but one that does dampen its impact.
| 40-Year Nov vs Jan Comparison | Jan Return % | Dec + Jan Return % |
| Average Jan vs ⬆️ Nov | +1.30% | +3.51% |
| Median Jan vs ⬆️ Nov | +1.32% | +3.86% |
| Average Jan vs ⬇️ Nov | -0.30% | +1.62% |
| Median Jan vs ⬇️ Nov | -0.30% | +1.54% |
| 30-Year Nov vs Jan Comparison | Jan Return % | Dec + Jan Return % |
| Average Jan vs ⬆️ Nov | +1.62% | +3.68% |
| Median Jan vs ⬆️ Nov | +1.32% | +3.86% |
| Average Jan vs ⬇️ Nov | -1.93% | -0.81% |
| Median Jan vs ⬇️ Nov | -1.71% | -0.29% |
| 20-Year Nov vs Jan Comparison | Jan Return % | Dec +J an Return % |
| Average Jan vs ⬆️ Nov | +1.88% | +3.82% |
| Median Jan vs ⬆️ Nov | +2.01% | +5.05% |
| Average Jan vs ⬇️ Nov | -2.07% | -1.23% |
| Median Jan vs ⬇️ Nov | -2.76% | -1.84% |
| 10-Year Nov vs Jan Comparison | Jan Return % | Dec + Jan Return % |
| Average Jan vs ⬆️ Nov | +2.25% | +3.34% |
| Median Jan vs ⬆️ Nov | +1.07% | +2.82% |
| Average Jan vs ⬇️ Nov | -2.65% | -1.03% |
| Median Jan vs ⬇️ Nov | -5.38% | -2.73% |
| 5-Year Nov vs Jan Comparison | Jan Return % | Dec + Jan Return % |
| Average Jan vs ⬆️ Nov | +3.05% | +3.86% |
| Median Jan vs ⬆️ Nov | +2.73% | +2.17% |
| Average Jan vs ⬇️ Nov | -6.56% | -3.90% |
| Median Jan vs ⬇️ Nov | -6.56% | -3.90% |
Let’s exclude the 5-year window, which contains only one down-January sample. Over the last 10 years (4 samples), 20-years (8 samples), 30-years (11 samples), and 40-years (15 samples), the pattern is clear: January turns negative after a down November in every timeframe, posting median returns of -5.38%, -2.76%, -1.71%, and -0.30% respectively.
It’s not that Santa skips town; it’s that he doesn’t always stick around for the fireworks!
A weak November genuinely appears to spoil the New Year’s leg of the summer rally. My theory is that the Santa Claus Rally is so deeply embedded in the market’s psychology – its seasonal “circadian rhythm” – that it can overwhelm prevailing negativity through December. But once the calendar flips to January, the unresolved causes of November’s weakness tend to resurface and the market becomes far less willing to ignore them.
Santa’s still coming (...suggests seasonality!)
Financial markets are often described as chaotic, unpredictable, and driven by an ever-shifting mix of macroeconomics, sentiment and geopolitics. Yet beneath that noise seasonal patterns emerge.
However, seasonality does not provide investors with a crystal ball – nor should it be mistaken for one. What it does offer is context: a historical framework that highlights the market’s recurring behavioural tendencies, and helps investors understand where risks or opportunities may be clustering at different times of the year.
Patterns such as the Santa Claus Rally, the broader summer rally, and even the September Swoon, don't dictate outcomes, but they can illuminate them. When interpreted correctly, seasonality can help investors shape expectations, stress-test assumptions, and better understand whether the market’s current tone aligns with or deviates from its long-run historical character.
The statistical data presented in this article is clear: investors can expect a Santa Claus Rally this year – like most years – but given the fragility of Australian shares this November, the prospect of the festive season extending all the way to Australia Day 2026 is a less likely outcome.
This article first appeared on Market Index on Wednesday 3 December, 2025.
Never miss an update
Enjoy this wire? Hit the ‘like’ button to let us know.
Stay up to date with my current content by
following me below and you’ll be notified every time I post a wire
Carl has over 30-years investing experience and has helped investors navigate several bull and bear markets over this time. He is a well respected markets commentator who specialises in how the global macro impacts Australian and US equities. Carl has a passion for technical analysis and has taught his unique brand of price-action trend following to thousands of Aussie investors.
Featuring

Carl Capolingua,
Livewire Markets
Carl has over 30-years investing experience and has helped investors navigate several bull and bear markets over this time. He is a well respected markets commentator who specialises in how the global macro impacts Australian and US equities. Carl has a passion for technical analysis and has taught his unique brand of price-action trend following to thousands of Aussie investors.
........
Investing is risky. Inevitably you will endure losses. If you can't cope with losing, don't invest.

5 topics

Carl has over 30-years investing experience and has helped investors navigate several bull and bear markets over this time. He is a well respected markets commentator who specialises in how the global macro impacts Australian and US equities. Carl...
Comments
Comments
Sign In or Join Free to comment