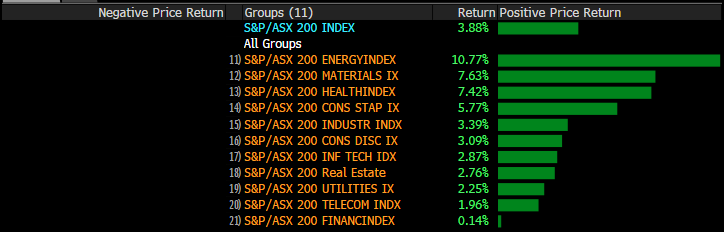
ASX 200 puts on 3.88% in April - best month in the last 7
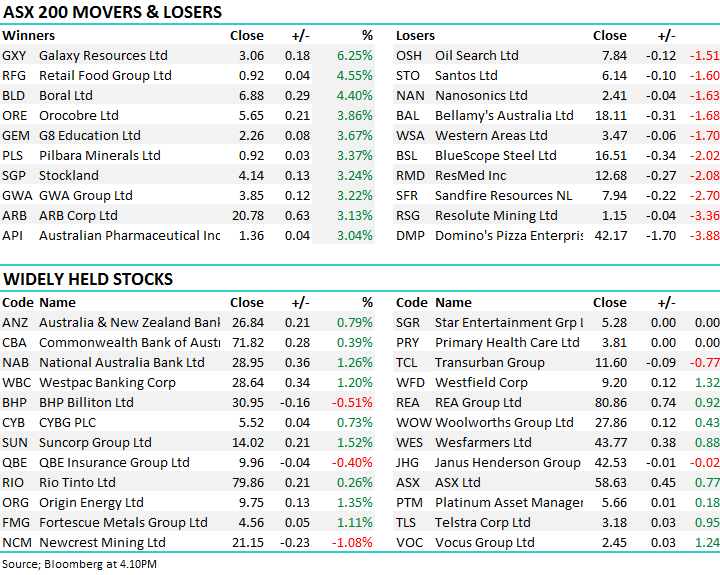
The local market continued on its bullish tilt today to end the month with the ASX 200 trading just 9pts below the psychological 6000 mark – up +29pts on the session or +0.49% to close at 5982. Banks seeing some further respite with the big 4 accounting for +10 index points of today’s gain while some of the recent ‘dogs’ started to show signs of life as fund managers look for perceived value – the likes of G8 Education (GEM) putting on +3.67% was interesting while we also saw some reasonable buying amongst the Lithium names, Galaxy (GXY) the standout after a slow start adding +6.25% while strong moves were also seen in Orocobre (ORE) which added +3.86% to $5.65 – Kidman (KDR) though lagged, adding just 1c to $1.975.
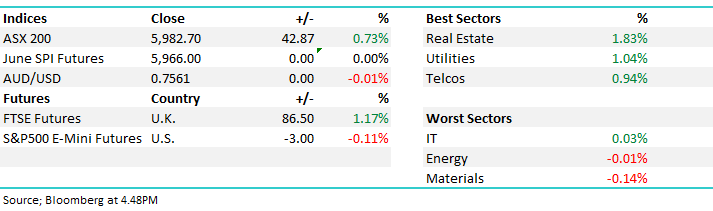
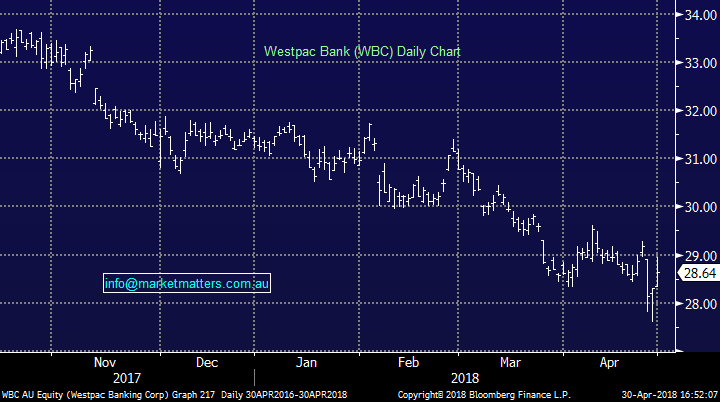
Elsewhere, a flow of mining quarterly reports kept the desk busy while better than feared credit growth numbers saw the banks well bid + an article from Chris Joye in the AFR debunking the bearish UBS note on Westpac (WBC) also helped the sector – Westpac & NAB the outperformers adding 1.20% and 1.26% respectively.
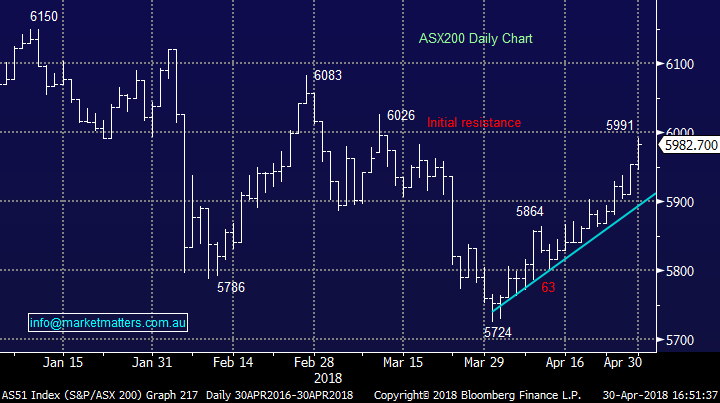
ASX 200 Chart
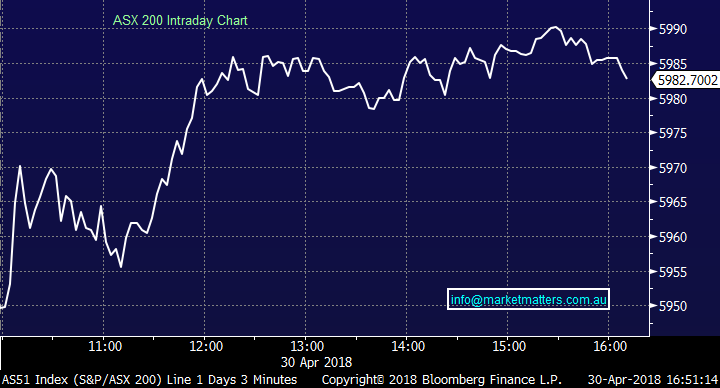
ASX 200 Chart
CATCHING OUR EYE
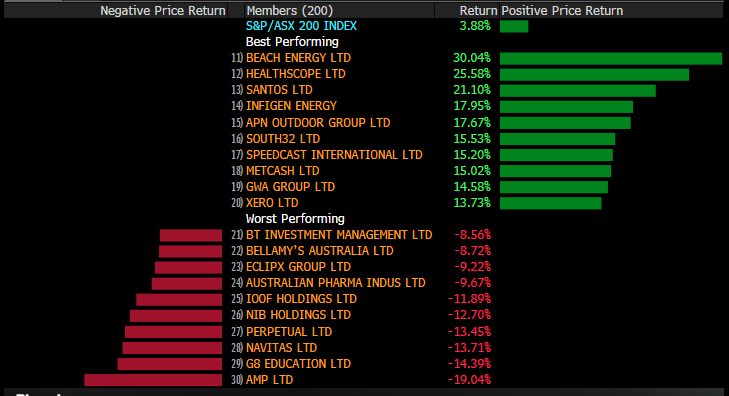
The month in review; Looking at stocks and sectors for the month of April, the index added +3.88% with the energy sector the clear standout while the Financials suffered at the hands of the Royal Commission. Interestingly, from a seasonal perspective, the April performance was in line with what we should normally see coming off the back of an abnormally weak March.
ASX Sectors for the month of April
Clearly AMP is under intense pressure as you’d expect while Perpetual (PPT) also felt the pinch during the period.
Stocks – best and worst for April
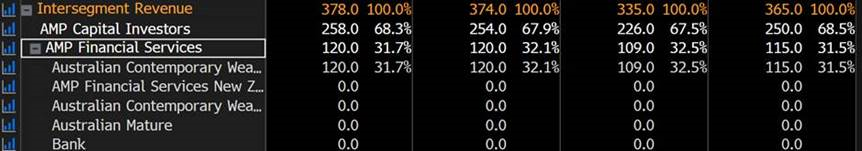
Thinking about AMP earnings for a moment, the bulk of their earnings come from funds management which seems good given the current negative focus on wealth management, however the flow of those funds typically come from AMP advisers / wealth managers. Those funds are directed into AMP product for a number of reasons, many of which have been challenged by the Royal Commission. Importantly, it seems very plausible that the removal of incentives given to the AMP adviser network will have a significant impact on FUM flow.
AMP revenue by segment
Perpetual on the other hand has also been sold hard on similar market concerns and trades on a similar valuation. 13.2x and 7% yield v AMP on 13.8x and 7.29% yield. While Perpetual is clearly not immune it is a company that’s slightly more diversified / defensive in terms of their trust business, plus their funds business (Perpetual Investments) seems a more robust / well regarded funds management operation which is less reliant on an internal adviser network for FUM flow.
PPT revenue by segment
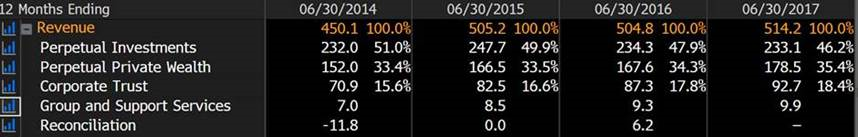
Both will clearly have structural issues going forward, however those looking to bottom feed in a sector that has been hit very hard, PPT seems better placed to meet future challenges, and it now trades on a similar valuation to AMP.
Banks & Better Credit Growth; A number of factors combined today to see the banks pick themselves up off the carpet and stagger higher. Credit growth for the month of March was 0.5% which brings credit growth for the year ended 31/3/18 to 5.1%. This is an increase from 0.4% in February and from 4.9% in the year ended 28/2/18 – and importantly, better than the market feared last week after APRA announced the removal of the 10% investor loan growth restriction from 1 July. It was thought (and I was in this boat) that the news probably signalled a weakening in credit growth for the month given the timing of the announcement however that proved not to be the case today. The over-riding positive news is that the regulators are watching credit growth and will act to support it.
Drilling into the composition, housing credit growth was 0.5% in March which was equal to February’s number. Owner/occupier credit growth was 0.6% in March compared to 0.7% in February. Business credit growth was 0.8% in March compared to 0.1% in February. This is the second highest monthly business credit growth number for more than a year. The numbers are promising.
Westpac (WBC) Chart
Mining Quarterlies; A number of quarterlies out today / this week combined with Chinese economic data. Today we saw the PMI number beat expectations and productions updates from local miners (NST, WSA, IGO and SYR) were generally okay.
Northern Star (NST); MQ18 in line and now set up for target 600koz pa trade form JQ18 and beyond. NST has delivered on the ambitious growth plans/targets mapped out in recent years. Importantly, the company is now cum growth and ex capex hence CF should start to reflect this position form JQ18. But the share price requires such delivery …
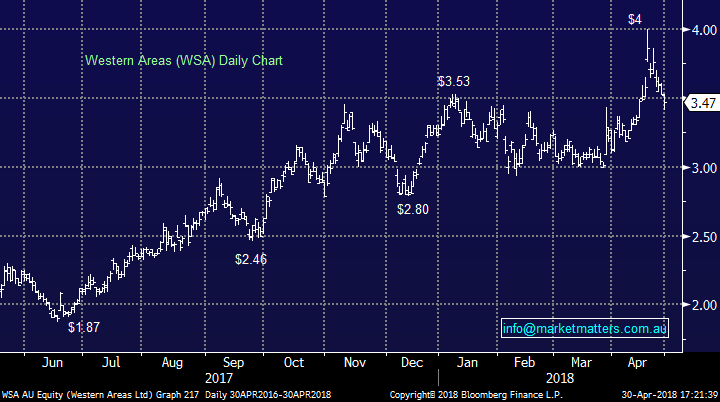
Western Areas (WSA); MQ18 lower production on lower grade (flagged in Feb), the first “miss” in 30 quarters. This is a value play that is firmly on our radar into recent weakness…
Western Areas (WSA) Chart
Have a great night
James & the Market Matters Team
Disclosure
Market Matters may hold stocks mentioned in this report. Subscribers can view a full list of holdings on the website by clicking here. Positions are updated each Friday, or after the session when positions are traded.
Never miss an update
Enjoy this wire? Hit the ‘like’ button to let us know.
Stay up to date with my current content by
following me below and you’ll be notified every time I post a wire
James is Director & Lead Portfolio Manager at Market Partners - a collective of highly experienced investment professionals, operating independently, managing discretionary portfolios for wholesale investors.
James is also Portfolio Manager & primary author at Market Matters, a digital advice & investment platform with over 2500 members that offers real market intel & six portfolios open for investment.

5 stocks mentioned

James is Director & Lead Portfolio Manager at Market Partners - a collective of highly experienced investment professionals, operating independently, managing discretionary portfolios for wholesale investors. James is also Portfolio Manager &...
Expertise
James is Director & Lead Portfolio Manager at Market Partners - a collective of highly experienced investment professionals, operating independently, managing discretionary portfolios for wholesale investors. James is also Portfolio Manager &...
Expertise
Comments
Comments
Sign In or Join Free to comment