Could US lockdowns slam the brakes on this market rally?
The COVID-19 data coming out of the US is grim and getting grimmer. My concern is that many investors have been pricing in an increasingly positive economic recovery, which may not eventuate if governments in the US need to re-introduce lockdowns. And that spells danger for share prices in the US – and other markets as well.
Major equity markets have recovered between half to two thirds of their losses since the height of the global COVID-19 pandemic fears and the lows in late March. This is on the back of the aggressive fiscal and monetary response from governments, as well as an increasing expectation that the impact and lockdowns will be shorter in duration. In the last week, an acceleration in the number of new confirmed COVID-19 cases in the US has seen markets become more nervous that there could be a second wave coming, with a consequent impact on economic activity.
If we look at the number of confirmed cases in the US, plotted on a logarithmic scale to visually show the percentage rate of change in confirmed case numbers, we can see a slight acceleration in the rate of new cases in the last week, with the line steepening marginally.
Figure 1: Total COVID-19 Cases in the US
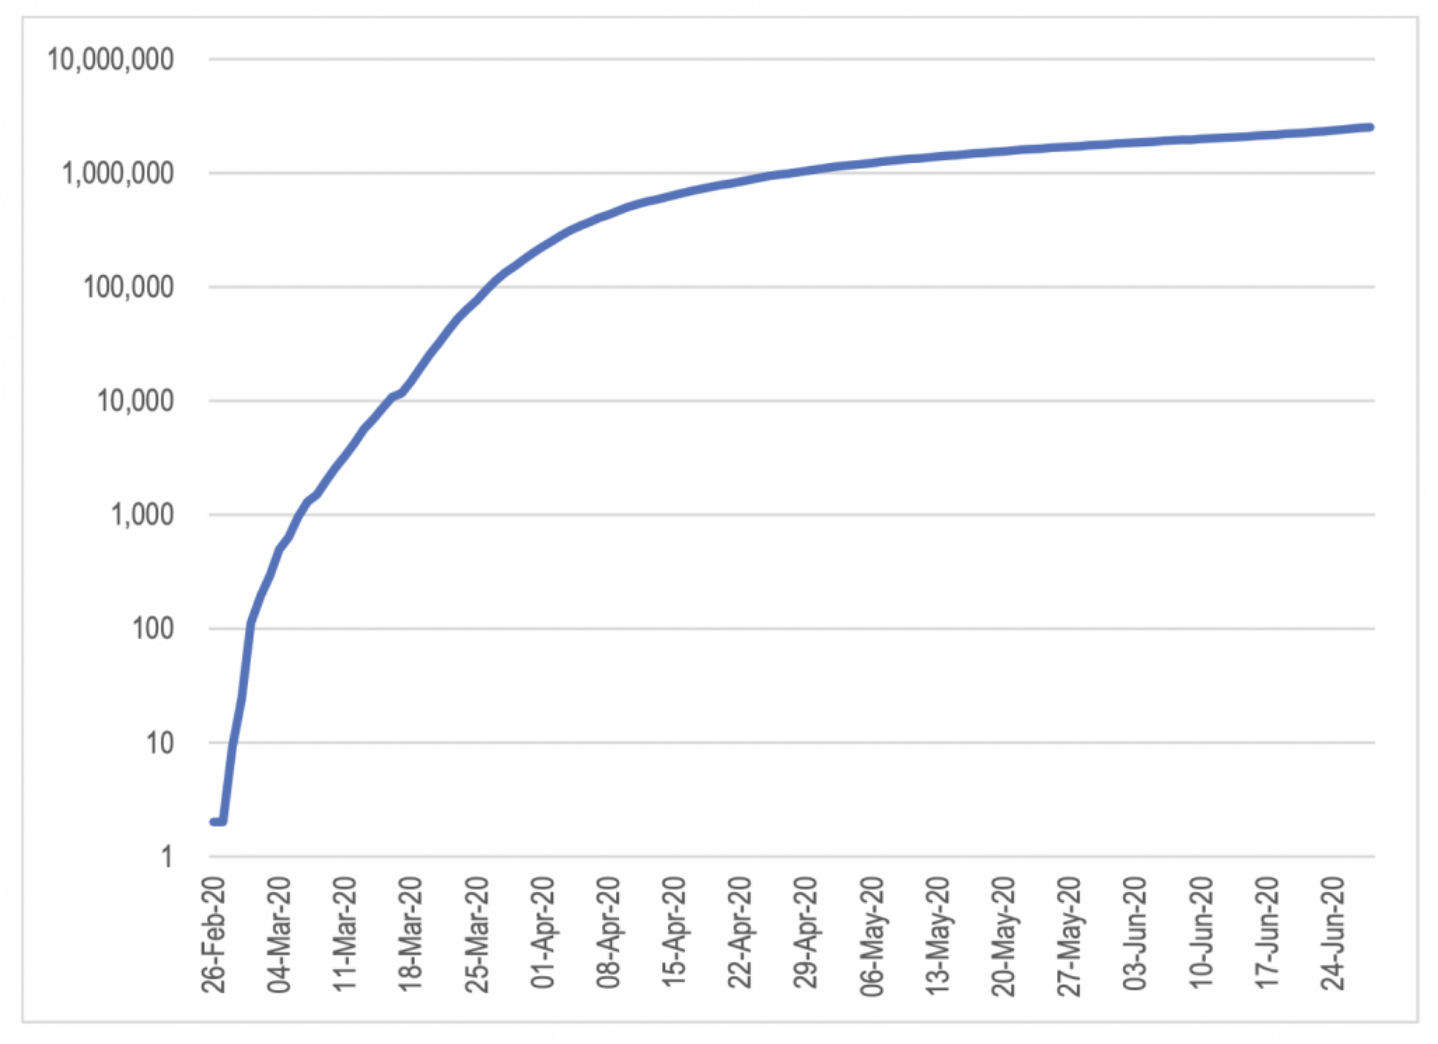
Source: CDC and state-based agencies
The chart above does not appear to show a major change in the rate of new cases, but this data needs to be disaggregated to understand where the threat exists. The epicentre of the initial outbreak in the US was the tri-state area around New York City.
At the end of April, New York state, New Jersey and Connecticut accounted for 42 per cent of total US confirmed cases despite representing around 10 per cent of the total US population. Since then, sustained lockdown requirements combined with an aggressive testing regime have resulted in a slowing of the rate in new cases.
The recent acceleration in new cases is coming from outside these three states.
Figure 2: Total COVID-19 Cases in the US – Combined NY/NJ/CT Vs the rest of the US
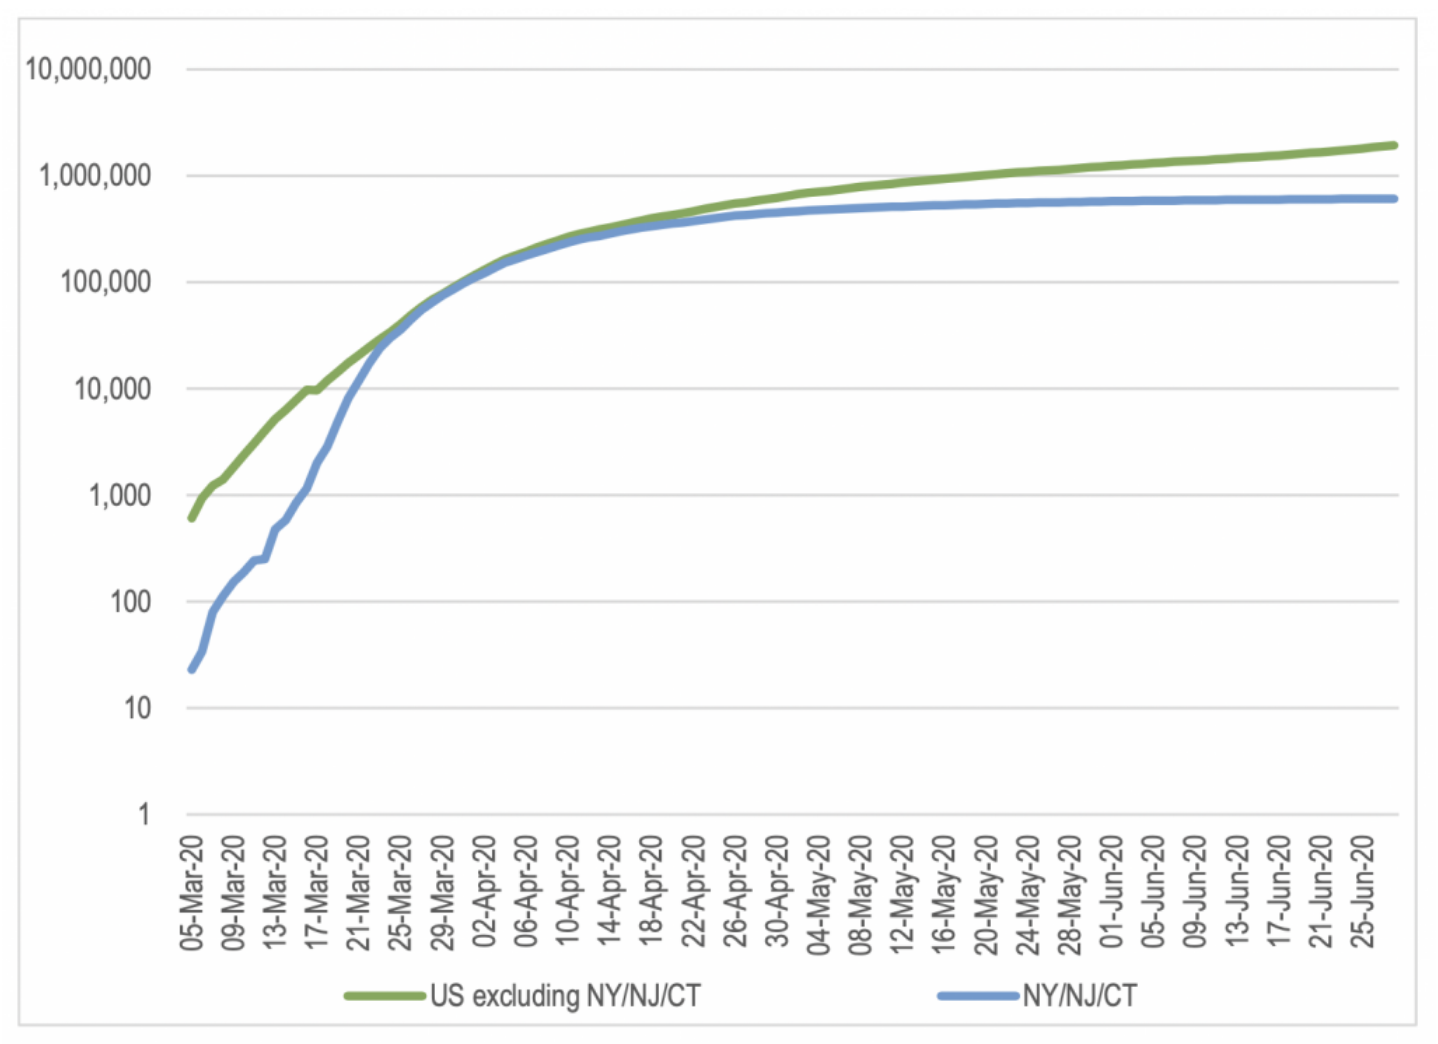
Source: CDC and state-based agencies
If we break this down even further, the acceleration in confirmed cases is primarily occurring in a handful of states such as Florida, Arizona and Texas. To help with comparability given the population differences of the various states, the chart compares the figures on the basis of the number of confirmed cases per 1,000 people resident in the state.
Figure 3: Total COVID-19 Cases per 1,000 Residents
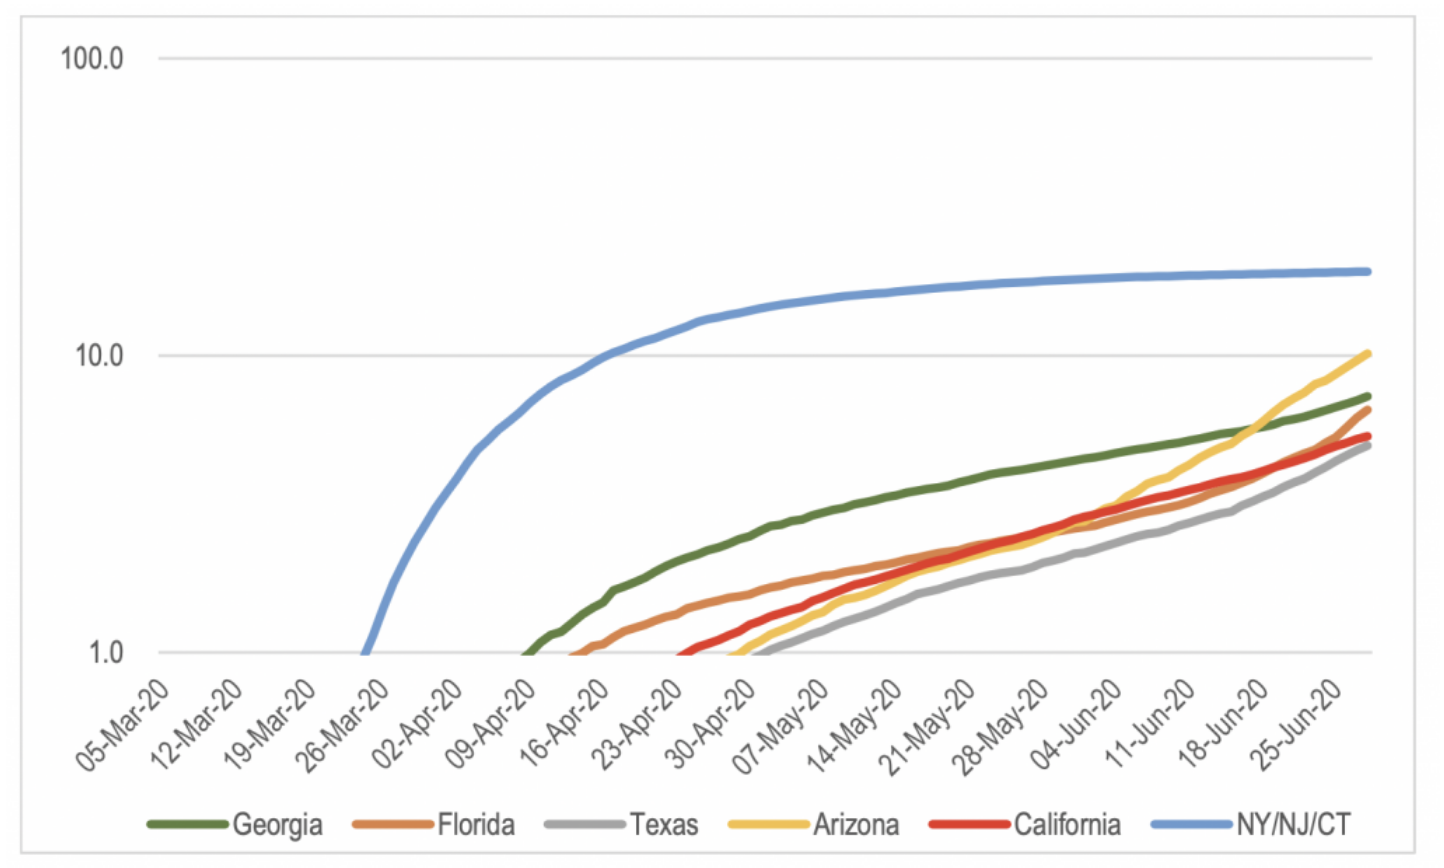
Source: CDC and state-based agencies
This chart shows the material acceleration in case numbers in Florida and Arizona in particular.
However, as we noted back in February, confirmed case volumes are only one measure of the current situation. What we are trying to identify is the extent of the spread of the infection in the broader community. This is where understanding the data in the context of testing volumes becomes important.
If there is not a broader level of spread through the population, the data should show a falling percentage of tests coming back positive as testing volumes are increased and testing is undertaken more broadly throughout the population.
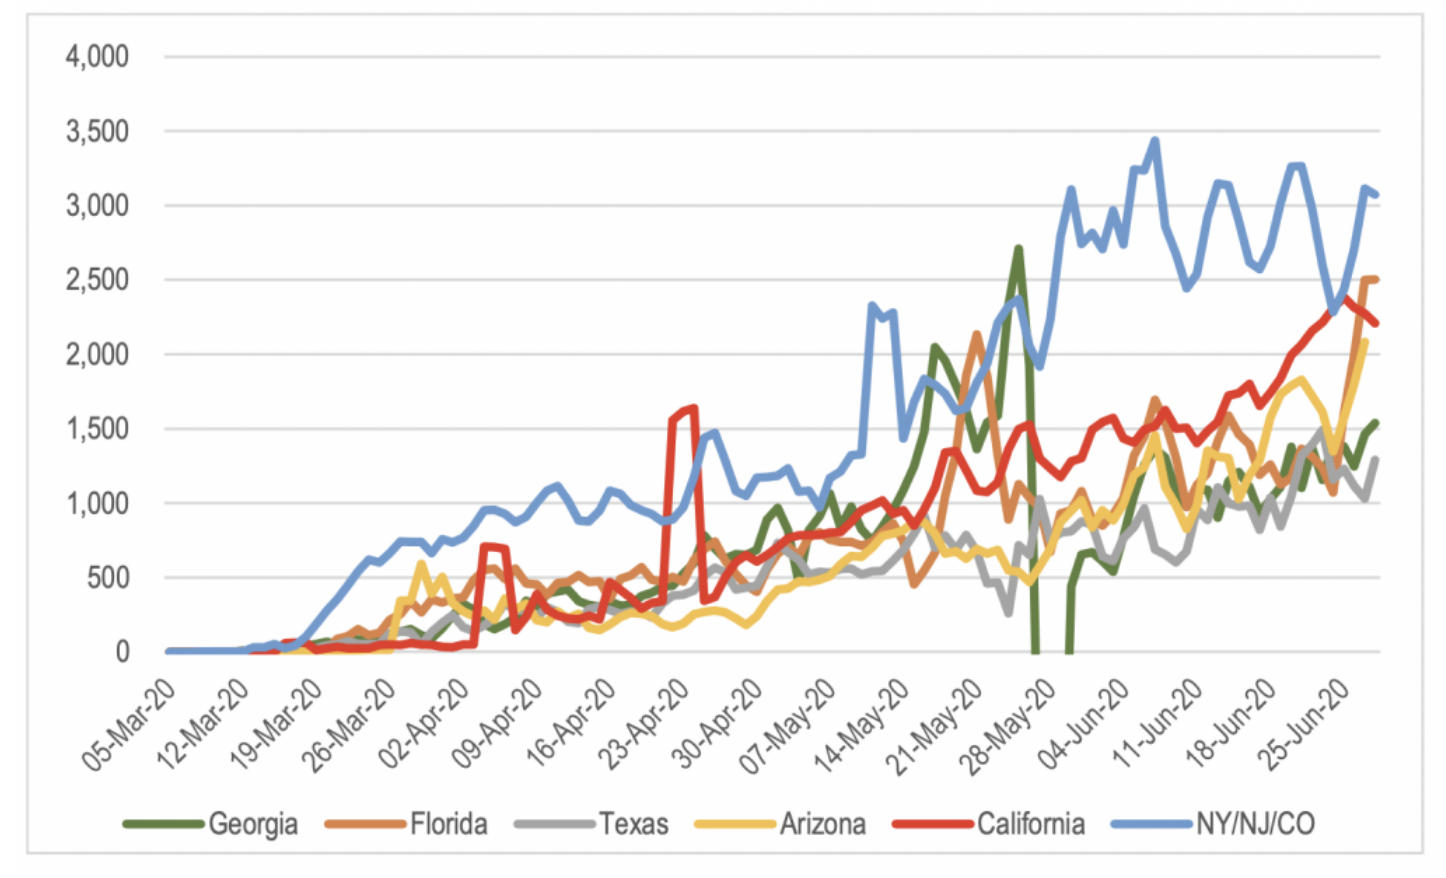
While the US was generally seen as being slow to ramp up testing in order to identify and quarantine cases in the broader community, there was also a very big difference between the timing and scale of the ramp-up in testing between New York, New Jersey and Connecticut and the rest of the US as shown in the chart below. This chart shows that NY/NJ/CT were testing at around two to three times the rate per capita relative to the rest of the country during late May and most of June. If you don’t test, you don’t see the extent of the problem and have no ability to contain it.
Figure 4: Total COVID-19 Tests per Million Residents – 3 Day Average
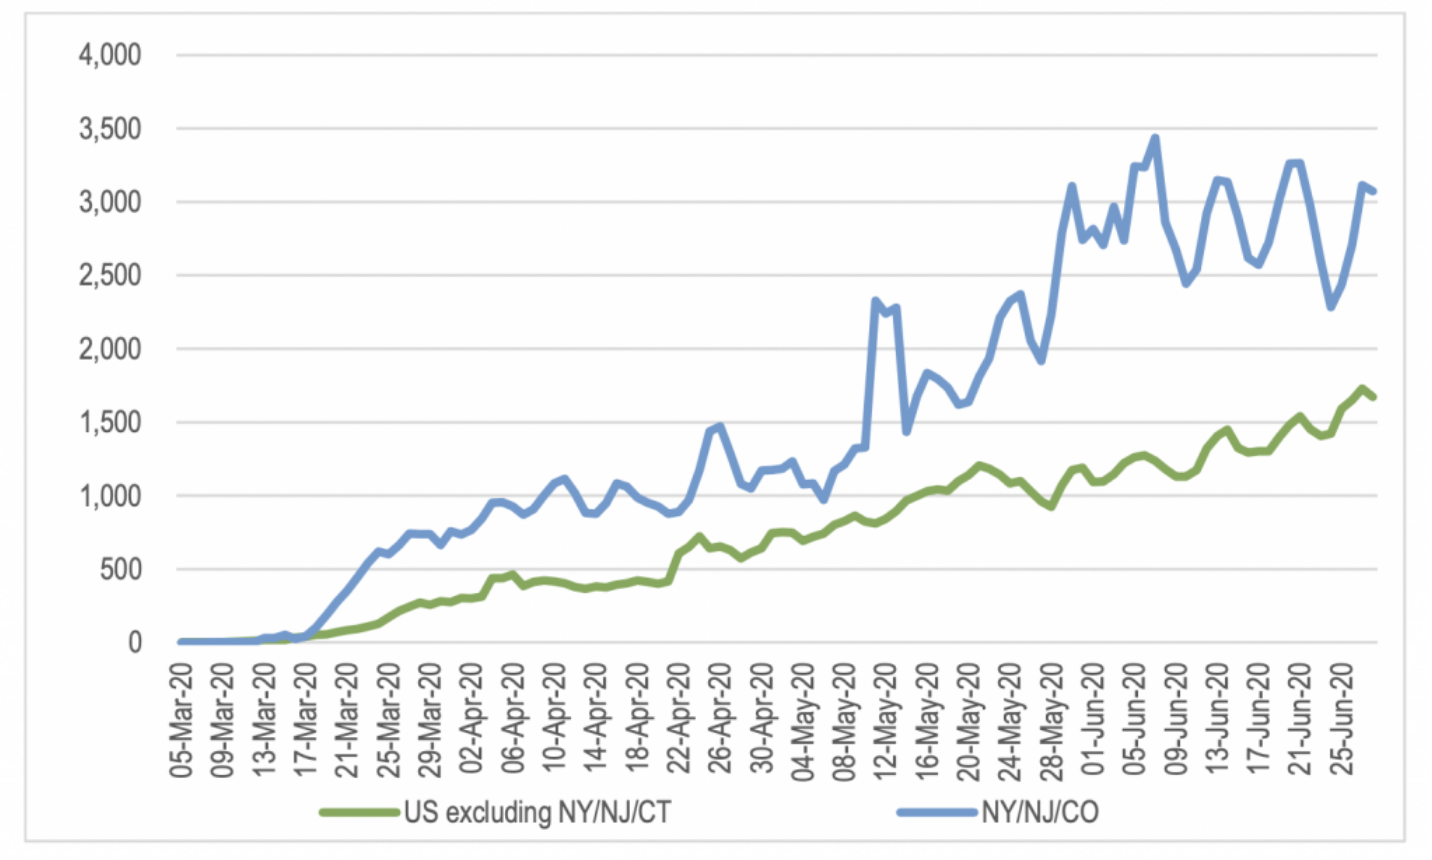
Source: CDC and state-based agencies
If we look at the problem states in isolation, we see that testing is starting to be ramped up, but remains below the levels of NY/NJ/CT.
Figure 5: Total COVID-19 Tests per Million Residents – 3 Day Average
Source: CDC and state-based agencies
As noted earlier, if there is no broader issue of unidentified community spread of the disease, you would expect the percentage of tests that come back positive to fall as the number and breadth of testing increases. This has been the case for NY/NJ/CT as testing volumes increased through May. The concern in states like Florida and Arizona is that the data shows a considerable increase in the percentage of tests coming back positive in the last couple of weeks despite the almost doubling of test volumes. This could be indicating that there is a much larger spread of the disease throughout the population than previously thought.
Figure 6: Percentage of Daily COVID-19 that are Positive – 3 Day Average
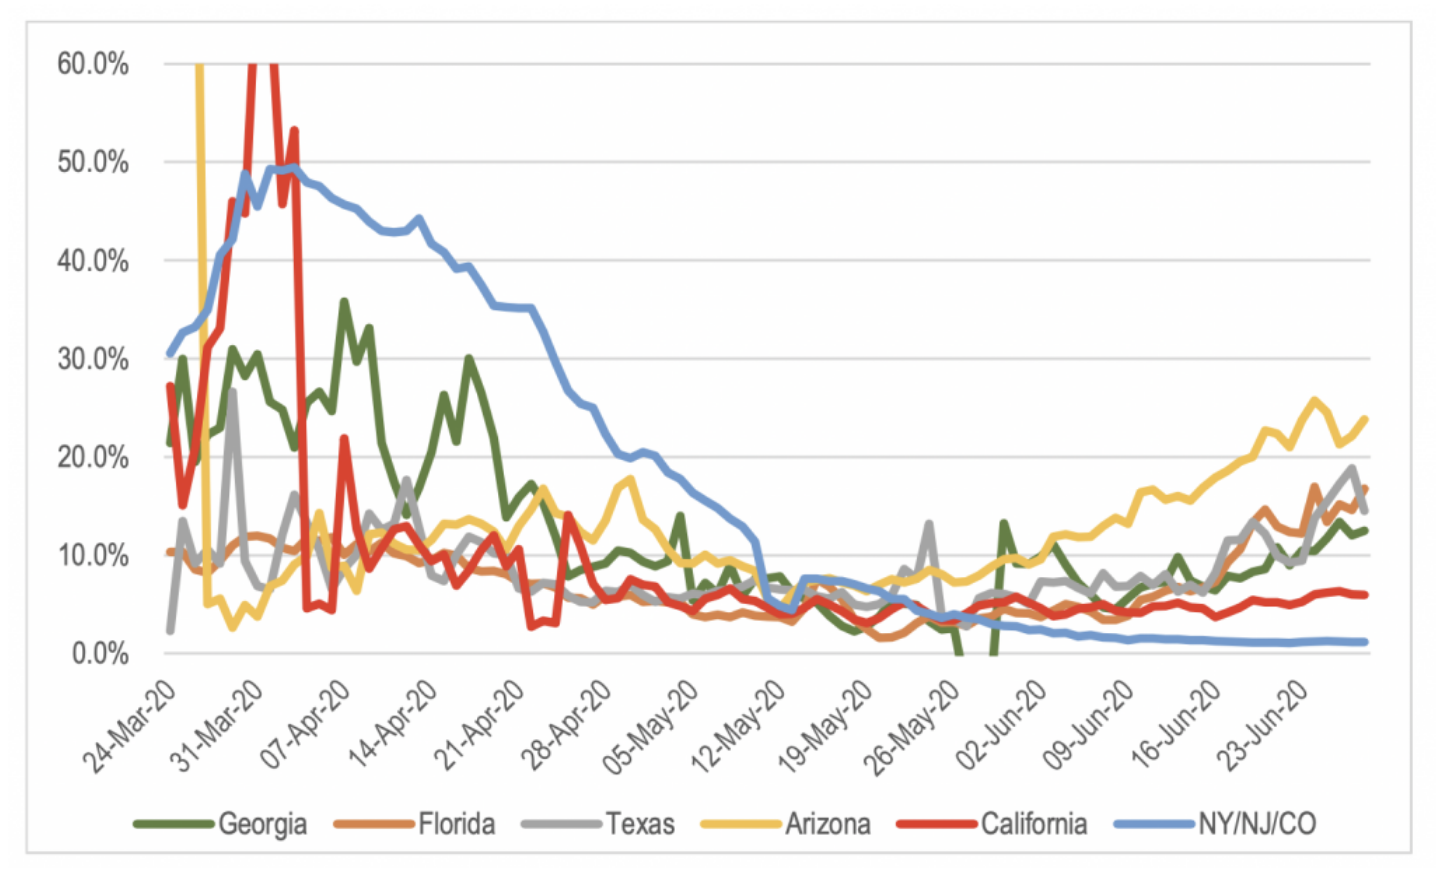
Source: CDC and state-based agencies
More broadly across the US excluding New York, New Jersey and Connecticut, the data is showing an increase in the percentage of tests that are coming back positive at the same time the volume of tests per capita is increasing.
Figure 7: Percentage of Daily Positive COVID-19 Tests Vs Volume of Tests – US Excluding NY/NJ/CT
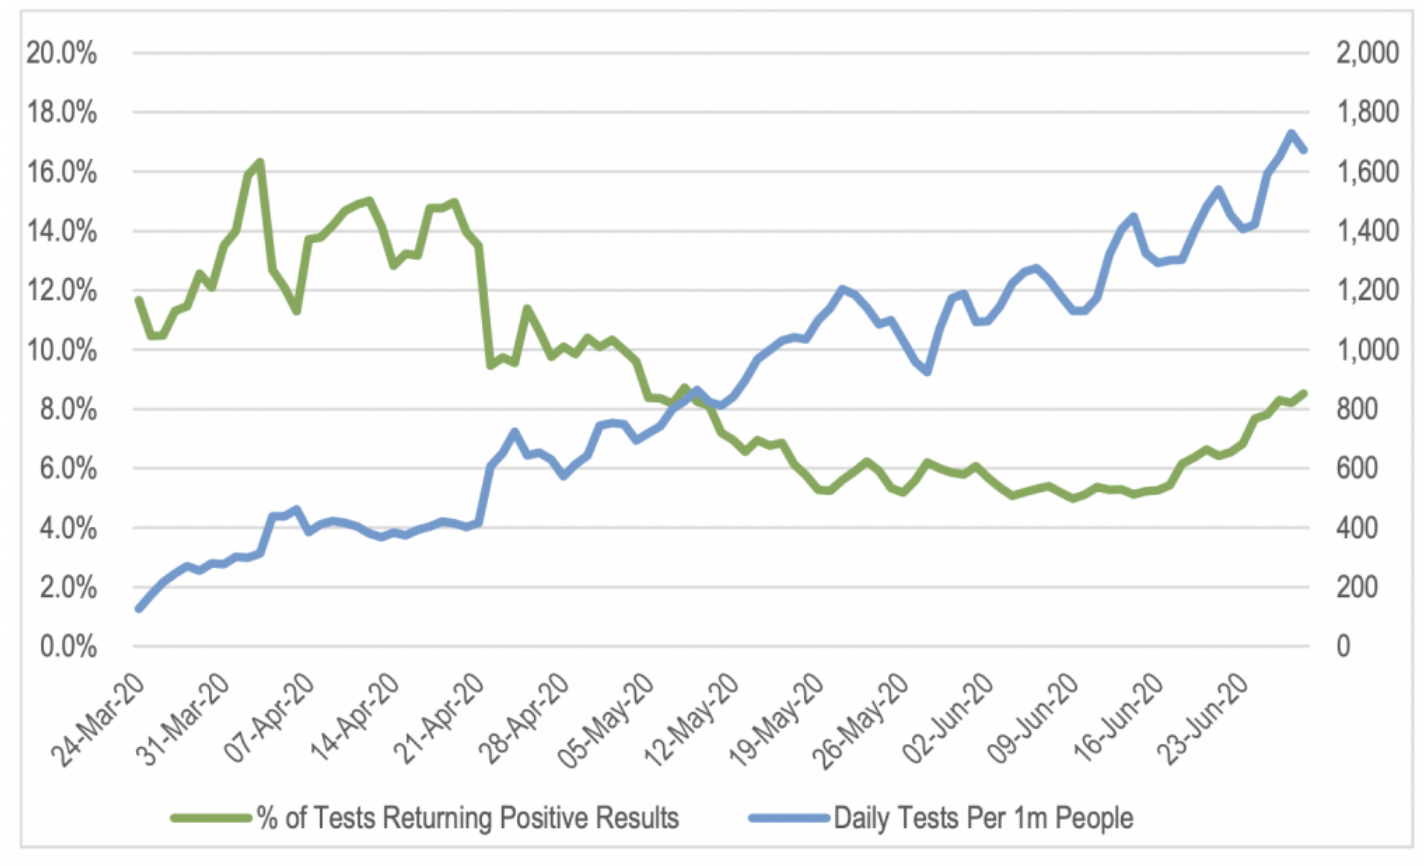
Source: CDC and state-based agencies
The concern is that there is the potential for the rest of the US to catch up to the per capita case rate of the NY/NJ/CT area. This could see COVID-19 case numbers triple in the US.
Figure 8: Total Cases Per 1,000 Residents – NY/NJ/CT vs the Rest of the US
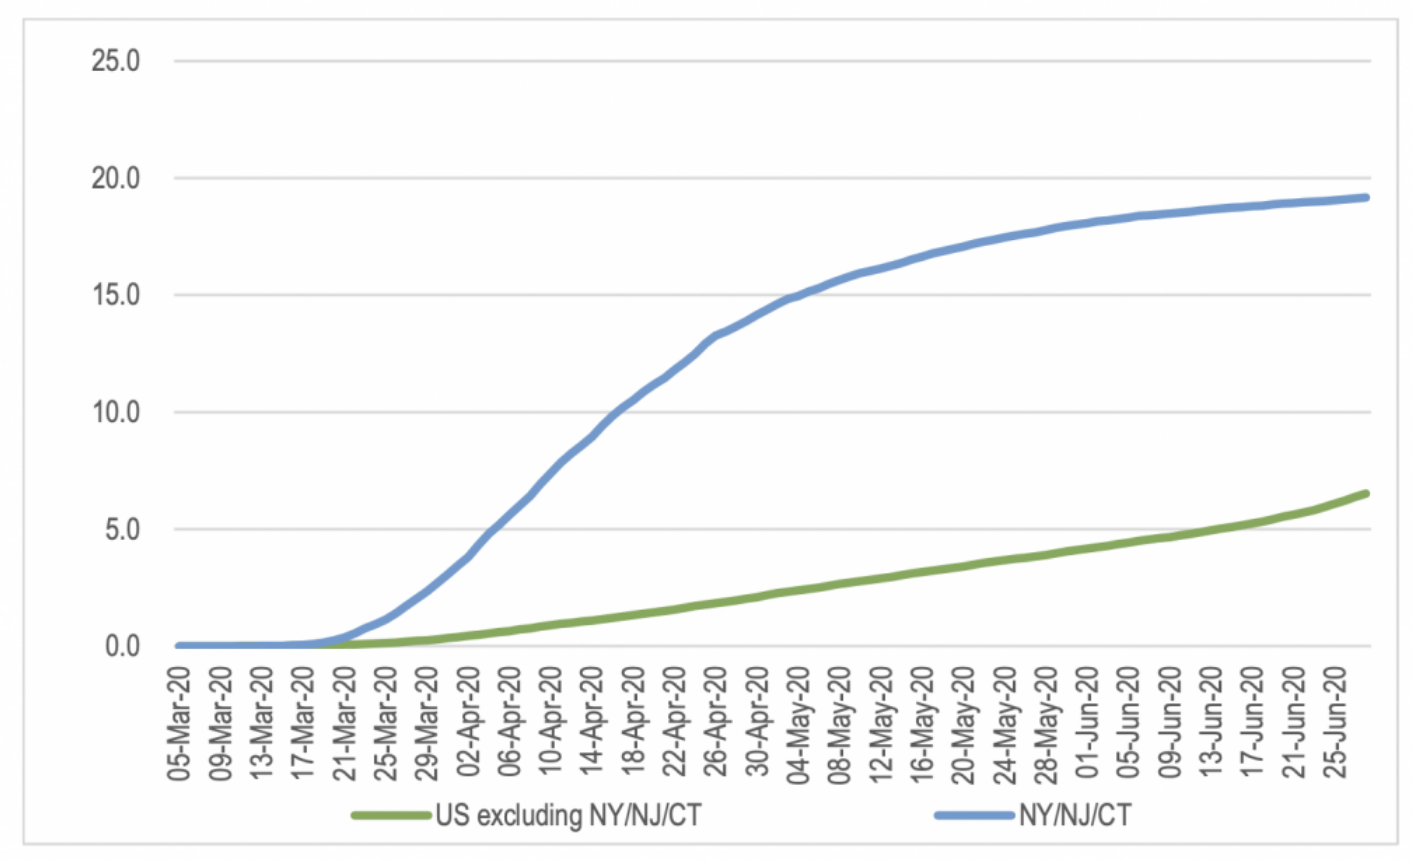
Source: CDC and state-based agencies
If the rest of the US were to reach the number of COVID-19 cases per capita as NY/NJ/CT, the total number of cases in the US would increase from 2.5 million to around 6.3 million cases.
Of course, the number of cases per capita in NY/NJ/CT does not represent a ceiling. It is possible that that the spread of the disease could easily exceed these levels. A number of the states that are now of concern, were slow to lock down the population and quick to open up again. Additionally, their populations are arguably more resistant to measures that would constrain the strain of the disease than NY/NJ/CT, and it is likely to be harder to get residents to return to lockdown conditions due to lockdown fatigue and discontent with the impact on their lifestyles.
The flipside positives against the eventual spread being worse than the current level of infection per capita in the NY/NJ/CT are that not all states are experiencing the same accelerating in new cases and testing volumes are higher than in the early stages of the outbreak in March.
The implications of a second wave for equity markets are clearly not positive given the market has been pricing an increasingly positive outcome and recovery in that last two months.
If governments need to re-introduce lockdowns, the ability to support the economy through fiscal policy measures will be more limited this time. The existing support measures are not sustainable in the long term given the rapid growth in borrowing to required fund them. Additionally, a material proportion of that support is due to expire in the coming months. This might be extended, but this can only go on for so long. Therefore, a second wave spike in cases carries significant risk to economic activity and equity markets.
However, there are some factors that would reduce the impact on economic activity. The main risk to the economy comes if the healthcare is swamped by the reacceleration in new cases, forcing another lockdown.
A second wave through the rest of the US is likely to have a proportionally smaller impact on hospitalisation rates for a couple of reasons. First, the outbreaks to date in states like Arizona and Florida are more skewed to younger people due to their return to hospitality venues. Hospitalisation rates are lower for younger people with the disease. But this could see some re-imposition of restrictions applied to hospitality venues, with negative implications for stocks exposed to the industry such as gaming stocks.
Additionally, treatments are also likely to have improved, reducing the rate at which cases deteriorate to critical levels.
Get investment insights from industry leaders
Liked this wire? Hit the follow button below to get notified every time I post a wire. Not a Livewire Member? Sign up for free today to get inside access to investment ideas and strategies from Australia’s leading investors.
Never miss an update
Enjoy this wire? Hit the ‘like’ button to let us know.
Stay up to date with my current content by
following me below and you’ll be notified every time I post a wire
Prior to his departure in August 2022, Stuart was employed by Montgomery Investment Management for over seven years as a Senior Analyst and Portfolio Manager of The Montgomery [Private] Fund.

4 topics

Senior Analyst and Portfolio Manager
Prior to his departure in August 2022, Stuart was employed by Montgomery Investment Management for over seven years as a Senior Analyst and Portfolio Manager of The Montgomery [Private] Fund.
Expertise
Senior Analyst and Portfolio Manager
Prior to his departure in August 2022, Stuart was employed by Montgomery Investment Management for over seven years as a Senior Analyst and Portfolio Manager of The Montgomery [Private] Fund.
Expertise
Comments
Comments
Sign In or Join Free to comment
most popular
Investment Theme
If 24 LICs ran the Melbourne Cup, which ones would we back?
Affluence Funds Management