Global Equities: A Generational Buying Opportunity Emerging
The purpose of this blog post is to take an objective and balanced account of what may well end up becoming a generational buying opportunity in global equities.
To do this I will lay out a set of useful charts and indicators; explain the conceptual framework and how they tie in with each other; and of course ultimately reach some initial conclusions and illuminate the risks and opportunities developing in the current environment.
First, I feel it necessary to acknowledge that this is a terrible situation that we all find ourselves in right now. Not only do we all find ourselves and our loved ones in actual danger, but the economic and market turmoil is also very unsettling. But as investors we are tasked with the responsibility to mentally set those things aside and do what must be done.
With that said, let's get on with the charts.
1. Market Breadth Meltdown
First chart will be a familiar one for regular readers: I talked about this one back in October last year as what looked like a new cyclical bull market was emerging ...of course that was before the global coronavirus pandemic hit! But anyway, first I will explain what it is, this chart shows the proportion of countries we track (70) whose main equity benchmark is positive on a year over year basis. Much like the traditional market breadth indicators that track individual stocks, this indicator helps identify emerging strength and weaknesses, divergences, and turning points for global equities by tracking countries. After turning up in 2019, the indicator crossed above the 60% mark (a useful point of delineation for minimizing false positives, albeit with the sacrifice of timeliness - you miss the first part of the rebound, but equally lower the odds of piling in on a bear market rally)... but subsequently collapsed; activating the first of 3 possible signals.
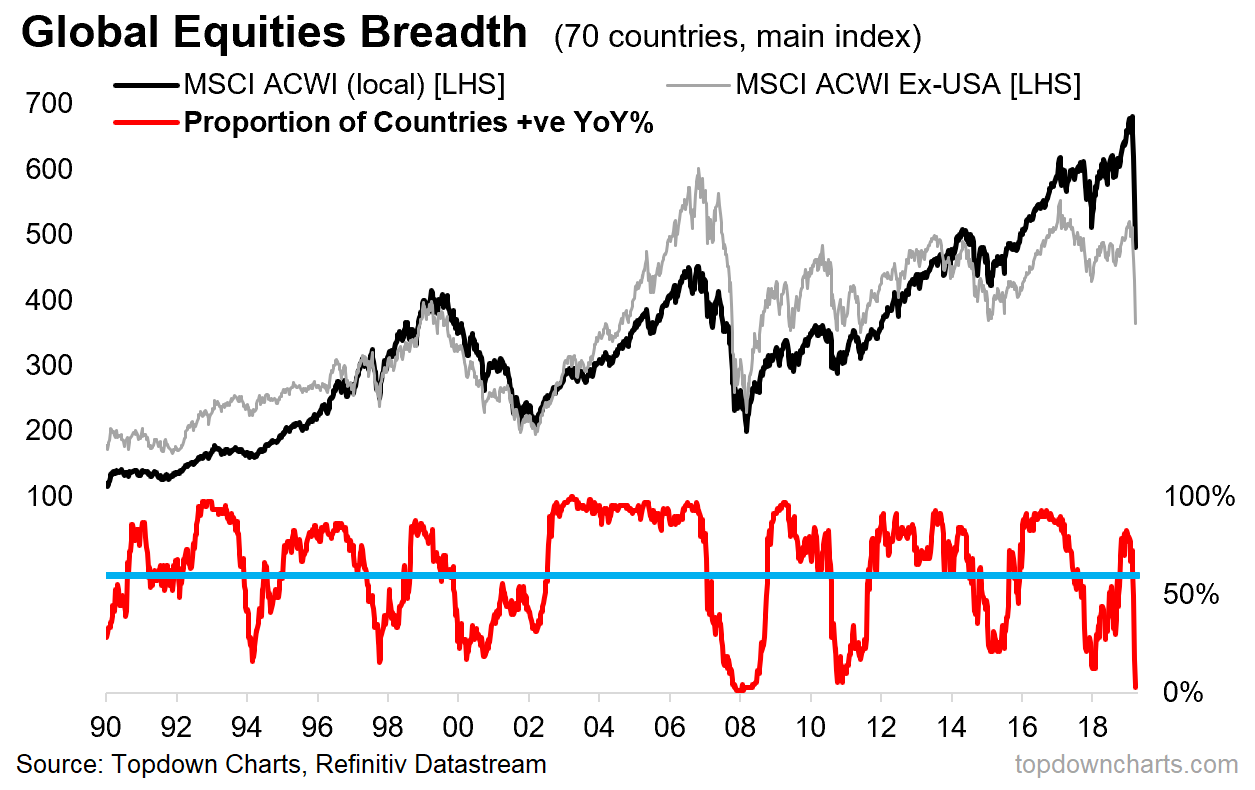
What to watch for: Aside from the 60% rule, buying opportunities can be found in two other situations: first and most risky is when breadth collapses to below 20%, second and less risky - but not without false positives: when market breadth collapses and then turns up (eyeballing the chart you can see several instances of this). So at this point we have the first one, but of course neither of the other two signals (yet).
2. Valuation Breadth: Most Countries are Cheap Now
Keeping with market breadth, this is another unusual/non-traditional indicator. This chart shows the proportion of countries we track (in this case a narrower universe of 47 countries - basically all the countries in the MSCI EM + DM indexes) whose PE10 (price vs 10 year average trailing earnings) is either below 15x (a best guess for what represents a "cheap" valuation) and 25x on the top side (a best guess for what represents an "expensive" valuation). As you can see, the proportion of countries trading on cheaper valuations moved from a low of 23% earlier this year, to now almost 70%. In other words, in the wake of the market crash, 2/3rds of the world now see their equity market trading on cheap valuations.
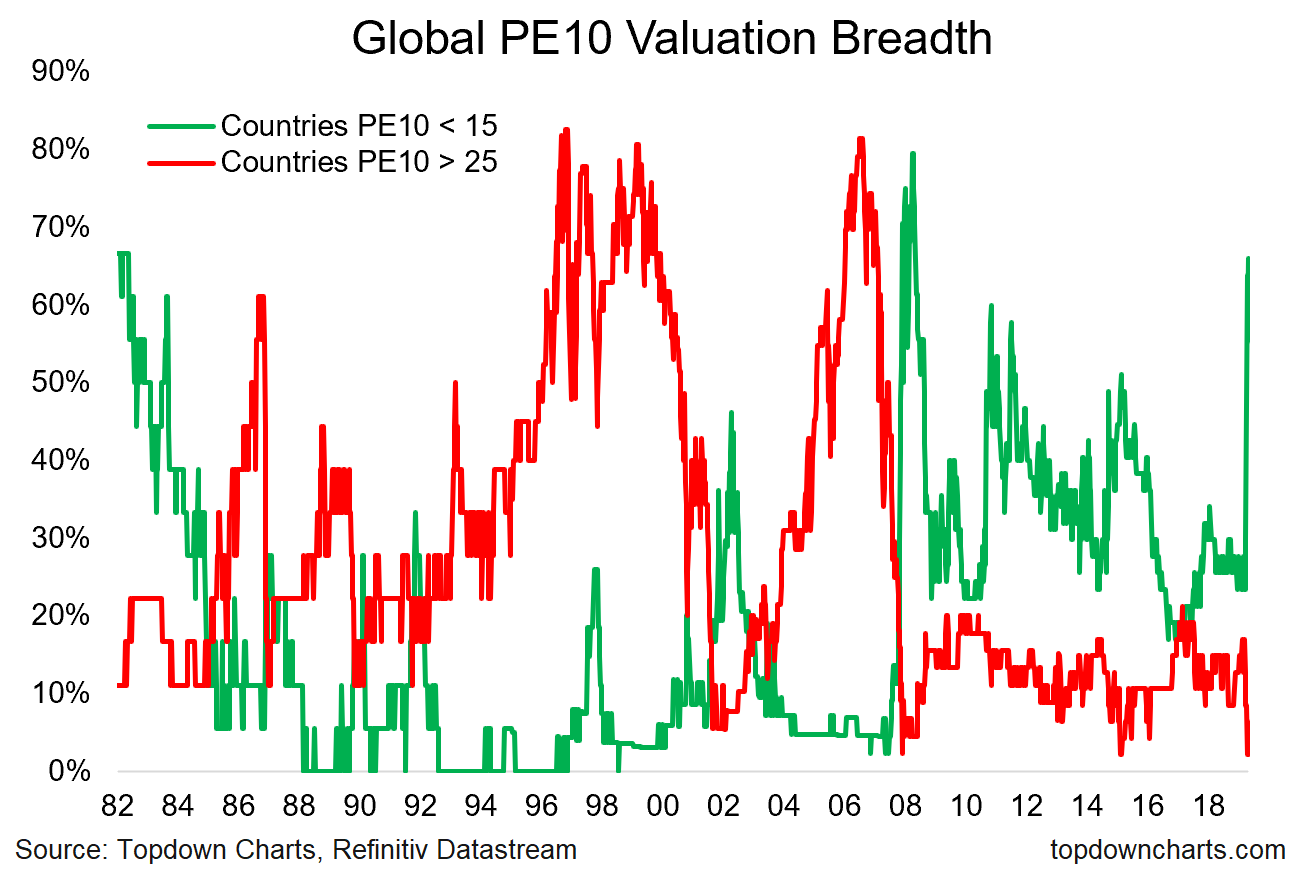
What to watch for: This is about as good as it gets, but of course it did go slightly higher at the deep dark depths of the financial crisis, so as always "cheap can get cheaper". The other thing to note is that there are still some markets which although cheaper now vs a couple of months ago, are still historically high, and that brings us into the next one...
3. PE10 Valuations: EM back to 2003 (!)
This is a remarkable chart for a few reasons. First and most notable is the Emerging Markets PE10 ratio dropping all the way back to 2003 levels; surpassing the lows of both 2015/16 and 2008/09. Not far behind is Developed Markets (excluding the USA), which are rapidly closing in on the 08/09 lows. And last but not least, is the USA, which although a lot cheaper (or should we say less expensive), it's not quite reverted back to the lows of 2015/16, and remains materially higher relative to the 2009 low. Of course we should note in passing that this is absolute valuations, and when you look at it on an ERP (equity risk premium) basis the valuation picture is a lot more compelling (both for US and global ex-US equities).
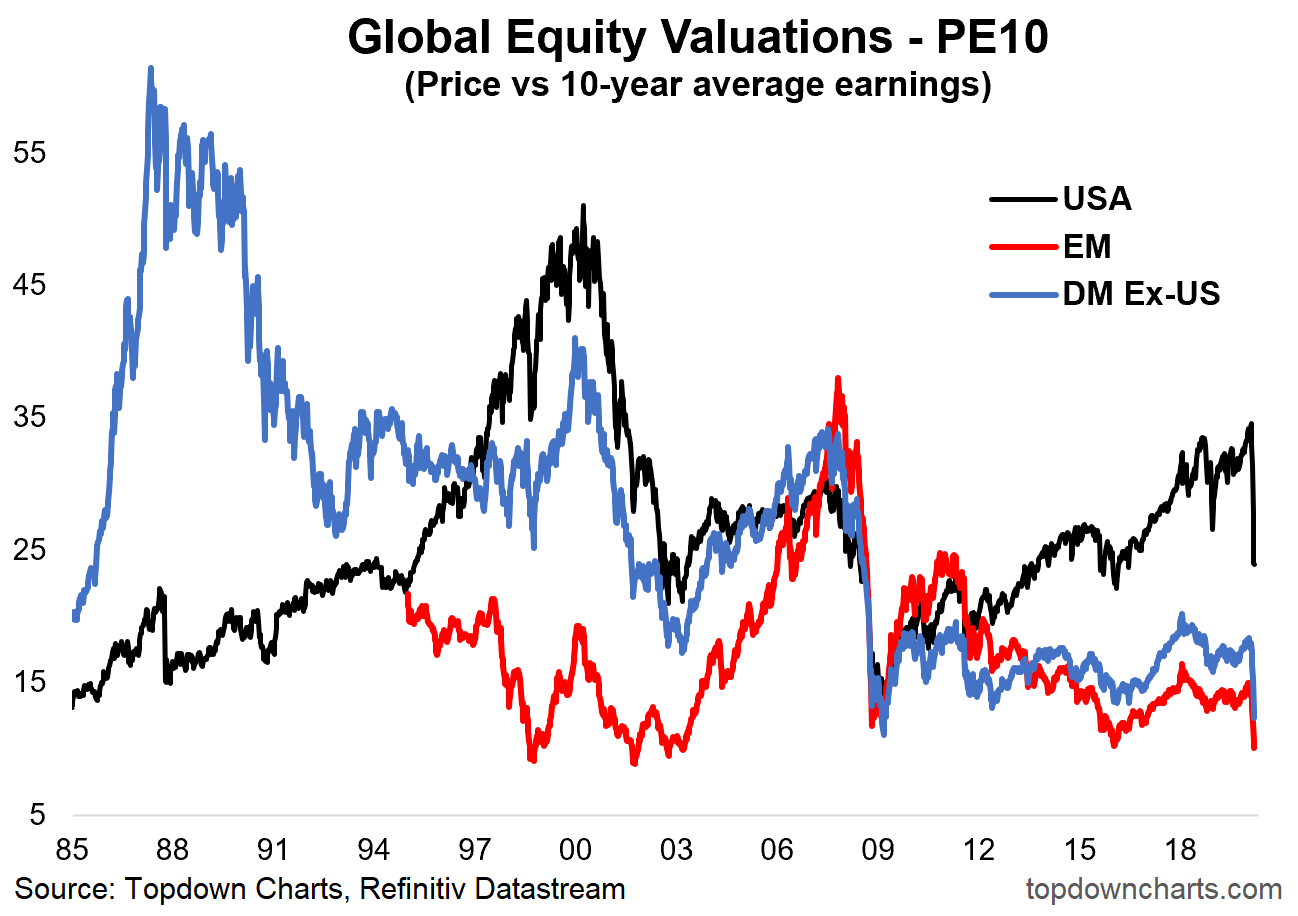
What to watch for: at this point, medium/longer term investors will be mentally salivating, as there are fairly clear and proven links between valuation levels and future expected returns (PE10 valuations have a strong inverse correlation with 10-year forward returns). Again though, the adage that cheap can get cheaper applies, and for shorter-term investors it's interesting information, but not by itself enough to drive short term trading decisions. But at this point, those who can ride out the short-term volatility will likely be keenly rebalancing into equities, if not building substantial exposure - especially with respect to emerging and DM ex-US.
4. Global Monetary Policy Pivot: Traditional Policy Stimulus
So at this point, we have an initial signal from the technicals, and some mixed (US vs Ex-US) but overall positive medium-term signals from valuations. But when it comes to figuring out turning points from the bottom side, one of the final pieces of the puzzle is monetary policy (note: cycle indicators matter too, but tend to turn much later, and in the current environment may well be outright misleading). Anyway, with respect to monetary policy, on the traditional tools we have seen basically "policy pivot part 2" (some might call it policy panic, but it's probably arguably quite rational in the face of the very real downside risks to the economy/financial system). Another round of rate cuts has followed up from the big pivot back to easing we saw globally last year. Typically the more banks cutting rates the more supportive it is for global equities.
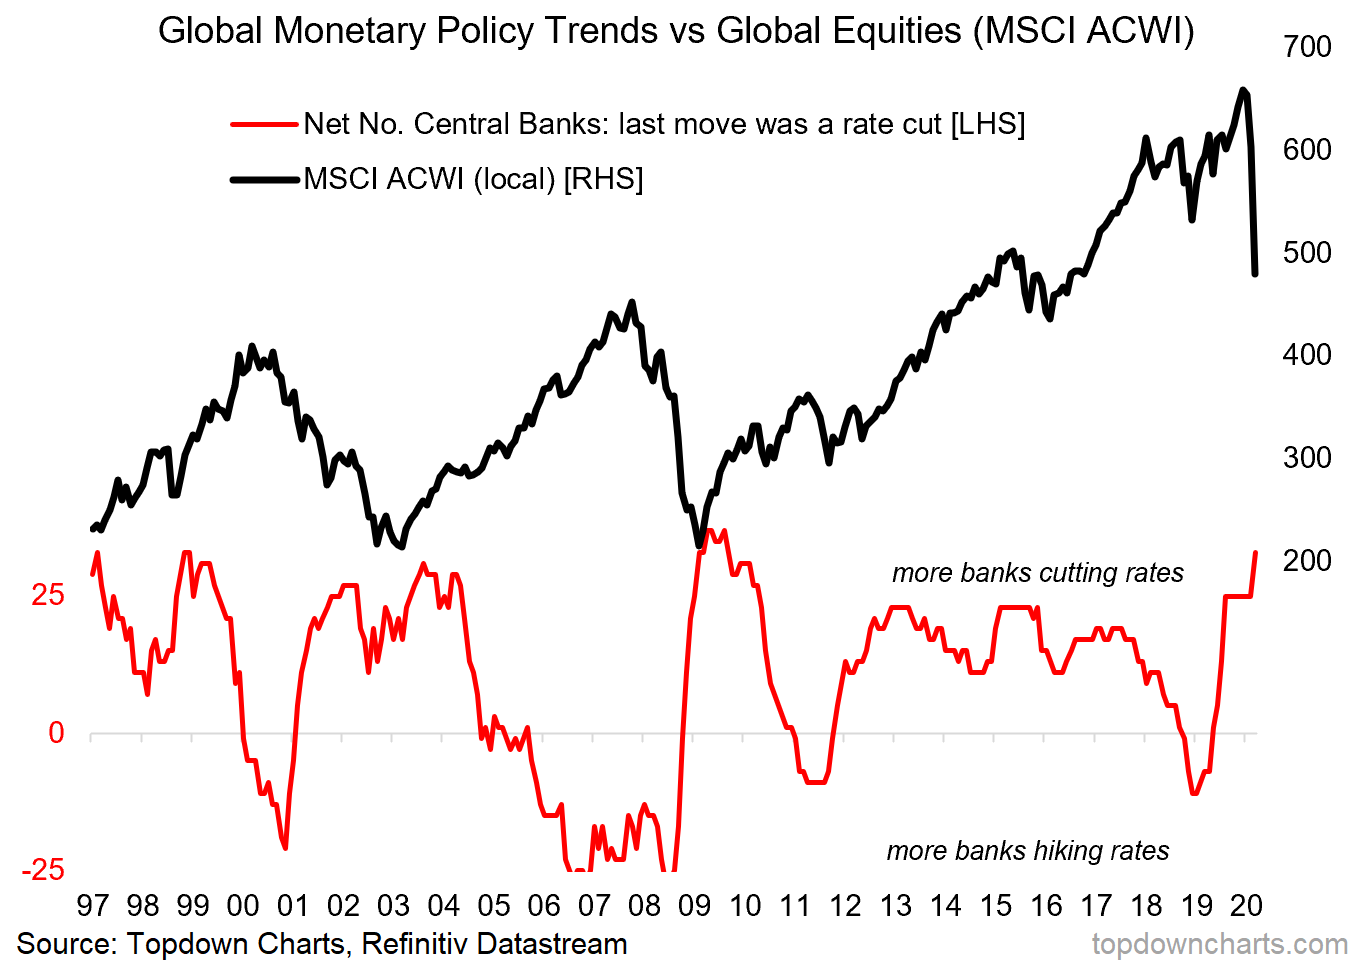
What to watch for: the linkages here are fairly logical and I would say reasonably well understood (lower rates tend to raise the attractiveness of owning equities from an ERP standpoint, and are generally stimulatory for the economy). Probably the thing to watch for is the steadily shrinking traditional policy ammunition that is available globally (China is probably the last one with any sizable traditional monetary policy ammunition left). And so that leads us into the next one...
5. Global Policy Pivot: Extraordinary Policy Stimulus
It's back to the balance sheet. Honestly, with the succession of announcements, and almost daily addition of emergency funding facilities, it's hard to keep up. But some of the big ones: the Fed announced QE of $700B ($500 on treasuries and $200 on MBS), the ECB announced a small and then a much bigger increase in QE, the BoE also stepped up asset purchases, as did the BOJ, and the quantitative easing club welcomed a couple of new members down my neck of the woods (RBA and RBNZ).
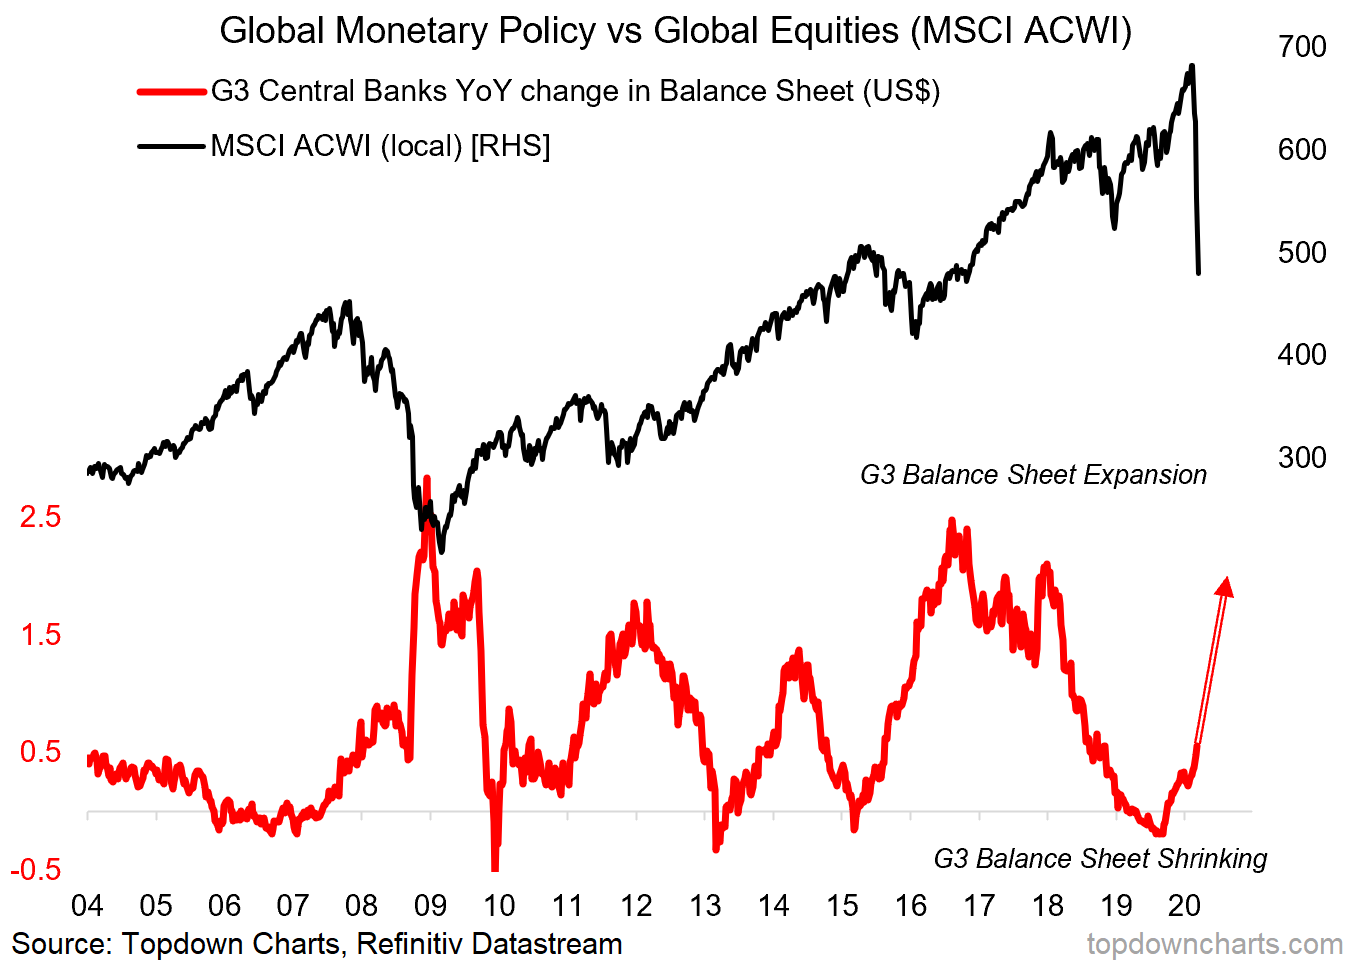
But perhaps more importantly, fiscal measures are being stepped up, with many countries announcing fiscal stimulus measures in multiple percentage points of GDP. Again with this it's both hard to keep up with the announced/planned numbers (let alone what actually makes it through into implementation and into the actual system after all the red tape and strings attached are accounted for). But the bottom line is, we are witnessing a global monetary and fiscal policy response that is on par with the financial crisis, and by the time all is said and done, could easily far exceed what was implemented back then.
What to watch for: the main thing to watch for really is the scale of easing vs the progression of the pandemic. Sooner or later it will reach a tipping point, and markets will begin to price in a rebound in growth that will inevitably come on the other side of the pandemic. In the short-term it's going to come down to the decisiveness and resoluteness of world leaders to do what needs to be done to drive a peak in the pandemic, and failing that to ultimately develop and rollout a vaccine. In the medium-term though, we are faced with a set of initial signals that point to a favourable medium-term outlook for global equities, but of course as noted, I will be watching for any changes - particularly improvement in the setup, and indeed for confirmation sign posts.
Final Thoughts and Bottom Line
Bottom line: we are seeing initial signals in technicals, valuations, and monetary/fiscal policy that make for an increasingly bullish medium-term outlook for global equities (particularly global ex-US).
As noted, the short-term outlook is veiled in uncertainty, and admittedly it's still anyone's guess as to whether 1987 or 2001 is the right macro/market analogue (i.e. whether it's a short, sharp crash, and then back to business, or a more drawn out bear market - likely with a couple of false dawns). In times like these, investors who can lengthen up their time frame will have the advantage. The ones who will also have the advantage are those who can focus-in on time-tested signals and indicators - tied together with an overarching framework/process... and not allow their emotions or the noise/news flow to unduly or unjustifiably rock their conviction.
Other than that, good luck out there, and stay safe. It may be a time to take risk with capital, but not with health, so make sure you follow best practice and even take the time and opportunity to make some positive health changes (I know I have this year). And remember: we are all in this together, and kindness and connection goes a long way!
Never miss an update
Enjoy this wire? Hit the ‘like’ button to let us know.
Stay up to date with my current content by
following me below and you’ll be notified every time I post a wire
Callum is Head of Research at Topdown Charts.
Topdown Charts is a chart-driven macro research house covering global Asset Allocation and Economics.

4 topics

Callum is Head of Research at Topdown Charts. Topdown Charts is a chart-driven macro research house covering global Asset Allocation and Economics.
Expertise
Callum is Head of Research at Topdown Charts. Topdown Charts is a chart-driven macro research house covering global Asset Allocation and Economics.
Expertise
Comments
Comments
Sign In or Join Free to comment