How to assess the value of stocks with extreme PE multiples
You’ve probably heard bullish commentators argue that declining interest rates explain, and justify, the extraordinary price to earnings (PE) multiples being paid for growth stocks. Many of these commentators also maintain that, because rates are going to stay lower for longer, these stocks are a defensive, sensible, and even safe investment. But are they right?
Do low rates explain the expansion in PE multiples?
At Montgomery we decided to explore the theory to answer the question of whether low rates were responsible for the massive expansion in PE multiples now widely accepted as normal by many, especially bullish, investors.
The theory goes something like this: equity investors demand a return – commensurate for the risk of investing in equities – above the risk-free rate (RFR) and through the actions required to satisfy the need for an appropriate return, markets will find an equilibrium. The market’s equilibrium PE multiple can then be explained by a formula that takes the risk-free rate and equity market risk premium in account with an adjustment for growth.
A quick example here may be useful. Rates on long term government bonds are widely employed as proxies for the risk-free rate. The Australian government recently sold 31-year government bonds at around 1.90 per cent. The equity market risk premium is currently estimated to be around three per cent. Add the two together and we arrive at a theoretical equilibrium earnings yields of around five per cent. The PE ratio is the inverse of the earnings yield so if we divide one by five per cent, we derive the equilibrium PE ratio of about 20 times earnings. The current PE for the ASX200 is about 19.85 times, suggesting it is about fair value.
The above however doesn’t take into account growth. To do that we need to subtract the growth rate from the earnings yield in the denominator. In the above example, if growth is two per cent then we subtract two per cent from the five per cent to arrive at three per cent. Divide one by three per cent and we arrive at a fair value PE of 30 times. Perhaps unsurprisingly, if we remove financials from the ASX200, its PE is about 30 times.
With the current market PE aligning with the theoretical PE, bullish investors retire to their den for a scotch and cigar content in the knowledge they are right and should remain fully invested in high growth names.
The problem is that for the theory to be reliable, the inputs need to be reliable. At Montgomery we just aren’t sure interest rates actually have the relationship to equities that many theorists have relied on to argue their case, especially for current market valuations.
What does the Price Earnings (CAPE) ratio tell us?
Nobel Laureate Robert Shiller developed the Cyclically Adjusted Price Earnings (CAPE) ratio and produced a retrospective series back to 1881. The data is widely considered high quality and certainly long-term.
At first glance, it appears that the series supports the expected relationship between interest rates and PEs. The low points in the CAPE in 1921 and the early 1980s corresponding with interest rate peaks.
But two convergences don’t make a summer. The apparent relationship fails on closer inspection. There were several decades of both CAPE and interest rates rising together in the 1950s and 1960s and pronounced peaks in CAPE in 1929 and 2000 occurring at moderate levels of interest rates.
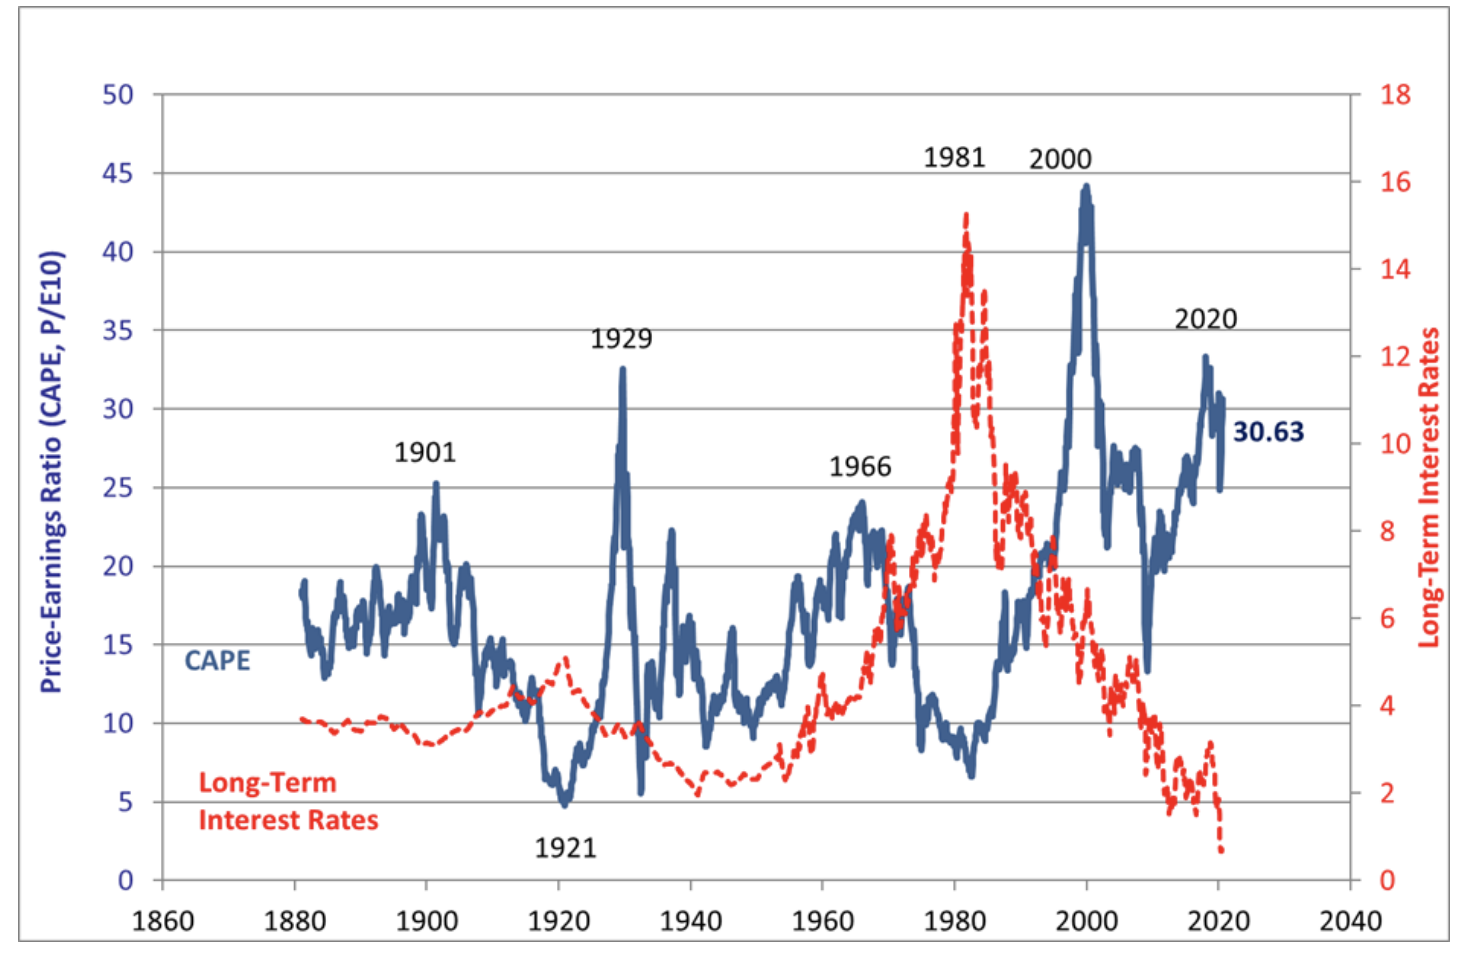
Source: Montgomery Investment Management
Thanks to statistical analysis we can also more formally express the strength or weakness of the relationship. We can convert Shiller’s data into monthly or annual changes to interest rates and CAPE and use regression analysis to determine the strength of the relationship between the two. We can also convert interest rates to a notional equity discount rate by adding, say, a constant six per cent equity risk premium (ERP) and use change to this notional discount rate as the independent variable.
This analysis indicates there is no significant relationship between changes to interest rates and changes to CAPE. The regression analysis suggests that changes in interest rates explain virtually none of the observed variation in CAPE over time. If we repeat this analysis using estimated real discount rates (calculated by subtracting actual change in CPI from the nominal rates) we again find only a very weak relationship between interest rates and CAPE.
As a further check, we undertook a (broadly) similar analysis on the Australian market, using changes to Australian discount rates (estimated as the 10-year bond rate plus six per cent) as the independent variable and change to the All Ordinaries Index (due to shorter timeframes we did not use a CAPE equivalent) as the dependent variable. Available data allows us to undertake this analysis over 50 years from 1970. In this case we did see a statistically significant relationship but only a small component of changes to the All Ordinaries Index is explained by changes to interest rates.
To put some dimensions to this, the regression analysis indicates that a reduction in interest rates of six percent (comparable to what we have seen in the last 10 years) might be associated with only a circa 13 per cent increase in the level of the All Ordinaries Index, beyond the level it would otherwise attain.
Why is this important?
The last 30-40 years have seen a marked decline in long-term interest rates in Australia and the US. Yields have seen more-or-less a steady decline since peaking in the early 1980s.
The current COVID-19 pandemic has contributed further to this dynamic, with yields – which had been rising in recent years – again turning down. In addition, there is an increasing expectation that low rates are likely to be sustained for some years.
There is virtual consensus that by keeping rates low, central banks around the world are supporting equity markets. The belief in the relationship between low rates and higher equity markets, and particularly high growth equities, whose value is concentrated more in future periods, is sacrosanct.
What our analysis suggests is that there are other explanations for the extreme PEs we are currently seeing. Some of these alternative explanations include the possibility that bond rates are not a good proxy for the long-term risk-free rate and that the market might not fully embrace the capital asset pricing model. But another explanation may be equally valid – we are in the middle of a good old-fashioned bubble in technology and growth stocks.
Not already a Livewire member?
Sign up today to get free access to investment ideas and strategies from Australia’s leading investors.
Never miss an update
Enjoy this wire? Hit the ‘like’ button to let us know.
Stay up to date with my current content by
following me below and you’ll be notified every time I post a wire
Roger Montgomery founded Montgomery Investment Management in 2010. Roger has more than three decades of experience in investing, financial markets and analysis. Roger also authored the best-selling investment book, Value.able.

4 topics

Roger Montgomery founded Montgomery Investment Management in 2010. Roger has more than three decades of experience in investing, financial markets and analysis. Roger also authored the best-selling investment book, Value.able.
Expertise
Roger Montgomery founded Montgomery Investment Management in 2010. Roger has more than three decades of experience in investing, financial markets and analysis. Roger also authored the best-selling investment book, Value.able.
Expertise
Comments
Comments
Sign In or Join Free to comment