
TOL - 2nd Jun, 2025
How to spot the next big ASX growth stock and the best growth prospects right now
Everyone wants to spot the next growth stock that rises from 50c to $300 in 10 years’ time. Here’s how to give yourself the best chance.
Everyone wants to spot the next Pro Medicus (ASX: PME), i.e., the stock that rises from 50 cents to $300 in 10 years’ time (I know what you’re thinking: “Hmmm…If I put $1,000 on PME when it was 50c…it would be worth…🤔). About $600 grand. That’s the answer by the way! (Now you’re imagining: “Wow, what if I had put $10,000 on PME…🤯).
If only we had a time machine, huh? Or if we can’t have a time machine, a way to reliably spot the next PME. Hey, for those kinds of returns we can wait another 10 years, right?
Some investors love collecting dividends, you know, 5% fully franked year-in-year-out with a stable capital base over time – like you usually get with the big banks or Telstra (ASX: TLS). That’s why these stocks are classic Aussie SMSF favourites!
But one should consider that most high dividend paying stocks are usually mature businesses with fewer growth opportunities, hence why they’re giving back so much cash to shareholders. It’s a fact that professional investors will pay more for earnings growth than they will for a steady dividend yield. This is because professional investors can get the same dividend-type returns from other asset classes like bonds but with lower volatility compared to stocks.
It’s a shame that more mum and dad investors don’t also think this way, because they could be leaving quite a few chips on the table. Take for example the chart below for Westpac Banking Corporation (ASX: WBC) showing its total return over the last 10 years. Total return simply means adding back dividends to the regular price chart, that's why the price scale looks a bit off compared to the regular WBC chart.
%20Total%20Return%20chart.png)
Sure, it looks great from 2024 – but consider that when one measures dividends and capital growth, WBC shareholders barely covered inflation between 2014 and 2024. That's 10 years of substantial underperformance compared to the benchmark index and roughly similar to a term deposit. It should also be clear that WBC shareholders had to endure several periods of extreme volatility along the way.
“Oh, but Carl, I received great income along the way…” Yeah, okay, but that’s kinda not the point! As investors, we want to maximise our total shareholder return. So, this implies at least some consideration of a stock’s capital growth. “Growth” is the key word here, because when it comes to really energising share price growth on the stock market, it typically comes from identifying companies that will have the strongest earnings growth.

Notice how the price of the S&P 500, the benchmark US stock index, rises just about lockstep with the aggregate earnings per share of its constituents? Yes, there are some wobbles along the way, but the relationship is clear – stock prices go up/down when earnings go up/down.
The reason why many Aussie investors plod along with their portfolio stuffed full of high-yielding dividend stalwarts, is because they believe capital preservation is more important than capital growth. They want their regular income, but they also want to be nearly certain every dollar they started with is still there when they need to take it out.
Sounds like a term deposit, though, right? Only with the added risk of the inevitable wobbles that come with investing in stocks. Consider how damaging it could be if you needed to “take it out” at the bottom of a protracted bear market?
I say, if you want term deposit-like returns and term deposit-like safety, then it’s probably best to stick your money in a term deposit. However, if you want the chance of earning PME-like returns, then this is exactly why we invest in the stock market in the first place! The key lightbulb moment for those who want to build serious wealth in the stock market comes when we realise we must focus on finding earnings growth and not just fully franked dividends.
I accept I’m not going to convince every die-hard income investor about what I have to say in this article – many will insist on sticking with income and the perception of safety it affords over targeting capital growth. But, perhaps for those of you who refuse to switch to a more-growth focused approach, it’s worth considering: What exactly is a “safe stock” anyway?
I put it to you, a “safe stock” is one that over the period you owned it, delivered a total return (i.e., income and capital gains) equal to or greater than your desired rate of return. Hopefully, even the most ardent income investors can agree on this.
If a company’s share price is more directly tied to its earnings growth than its dividend, then I also put to you that a stock with strong earnings growth is more likely to end up being a “safe stock” – because it's more likely to deliver a satisfactory total return. Compare this to an income stock with little or no earnings growth but a sound dividend yield. It runs the risk of lagging so badly on its capital return, that this outweighs any income benefits it may afford.
The goal of this article is to try and pinpoint the factors that more often than not indicate a stock has strong earnings growth, with the expectation that these stocks will drive superior total shareholder returns.
What is a growth stock?
A growth stock is typically defined as a listed company expected to grow its earnings at an above-average rate compared to the broader market or its industry peers. Growth stocks generally reinvest profits back into their business, prioritising expansion, innovation, or acquisitions over dividend payments.
The compounding effect of reinvesting earnings into further growing earnings results in strong revenue and earnings growth. It is fair to say, though, that business models that are highly scalable, disruptive, or which operate in rapidly expanding areas of the economy are more conducive to producing growth stocks.
Financial analysts assess the quality of growth stocks with metrics such as revenue growth rate, earnings per share (EPS) growth, return on equity (ROE), and price-to-earnings growth (PEG) ratio. Another quirk of growth stock investing is investors usually tolerate a higher price-to-earnings (P/E) ratio than typical norms on the basis that future earnings growth justifies the current valuation.
This last bit might frighten the dyed in the wool value investor who baulks at paying anything more than 10 times last year’s earnings, but growth stock investors understand that next year’s earnings, the next, and so on, are far more important than anything that’s happened in the past. Look at it this way:
Stock A – Current share price: $10
Stock A’s 2025 earnings: $1
Stock A’s 2030 earnings forecast: $1.276 (i.e., 5% p.a. compound)
Stock A’s 2025 dividend: $0.50 (i.e., 50% payout ratio)
Stock A’s 2030 dividend forecast: $0.638 (i.e., 50% payout ratio)
Stock A’s 2025 P/E & Dividend Yield: 10 | 5% p.a.
Stock A’s 2030 P/E & Dividend Yield: 7.8 | 6.4% p.a.
Stock B – Current share price: $10
Stock B’s 2025 earnings: $0.25
Stock B’s 2030 earnings forecast: $1.345 (i.e., 40% p.a. compound)
Stock A’s 2025 dividend: Does not pay a dividend (reinvesting back into growing earnings!)
Stock A’s 2030 dividend forecast: $0.672 (i.e., 50% payout ratio)
Stock B’s 2025 P/E & Dividend Yield: 40 | 0% p.a.
Stock B’s 2030 P/E & Dividend Yield: 7.4 | 6.7% p.a.
Which stock is cheap, and which is expensive? Stock A appears cheaper today with a P/E of 10 times current earnings compared to Stock B’s 40 times current earnings. It also appears to offer a superior dividend yield of 5% p.a. compared to Stock B’s no dividend.
However, if the companies continue to grow their earnings at their forecast rates (i.e., Stock A at 5% p.a. vs Stock B at 40% p.a.), then at current share prices, Stock B stands to be better value than Stock A in 5 years and it also stands to deliver a superior dividend yield.
This is why professional investors don't baulk at high P/E ratios on growth stocks (PME's P/E ratio has consistently averaged above 100 times earnings over the last 10 years, yet look at its share price performance). Nope, professional investors love earnings growth and they’ll pay top dollar for it. This is because they understand that stocks with strong earnings growth are more likely to be “safe” by our earlier definition.
But here’s the catch. While growth stocks can offer substantial capital appreciation, they also come with higher risk, especially if growth expectations are not met. For this reason, the volatility of growth stocks tends to be higher, and market sentiment can shift quickly based on execution or broader economic conditions.
What does a growth stock look like on a chart?
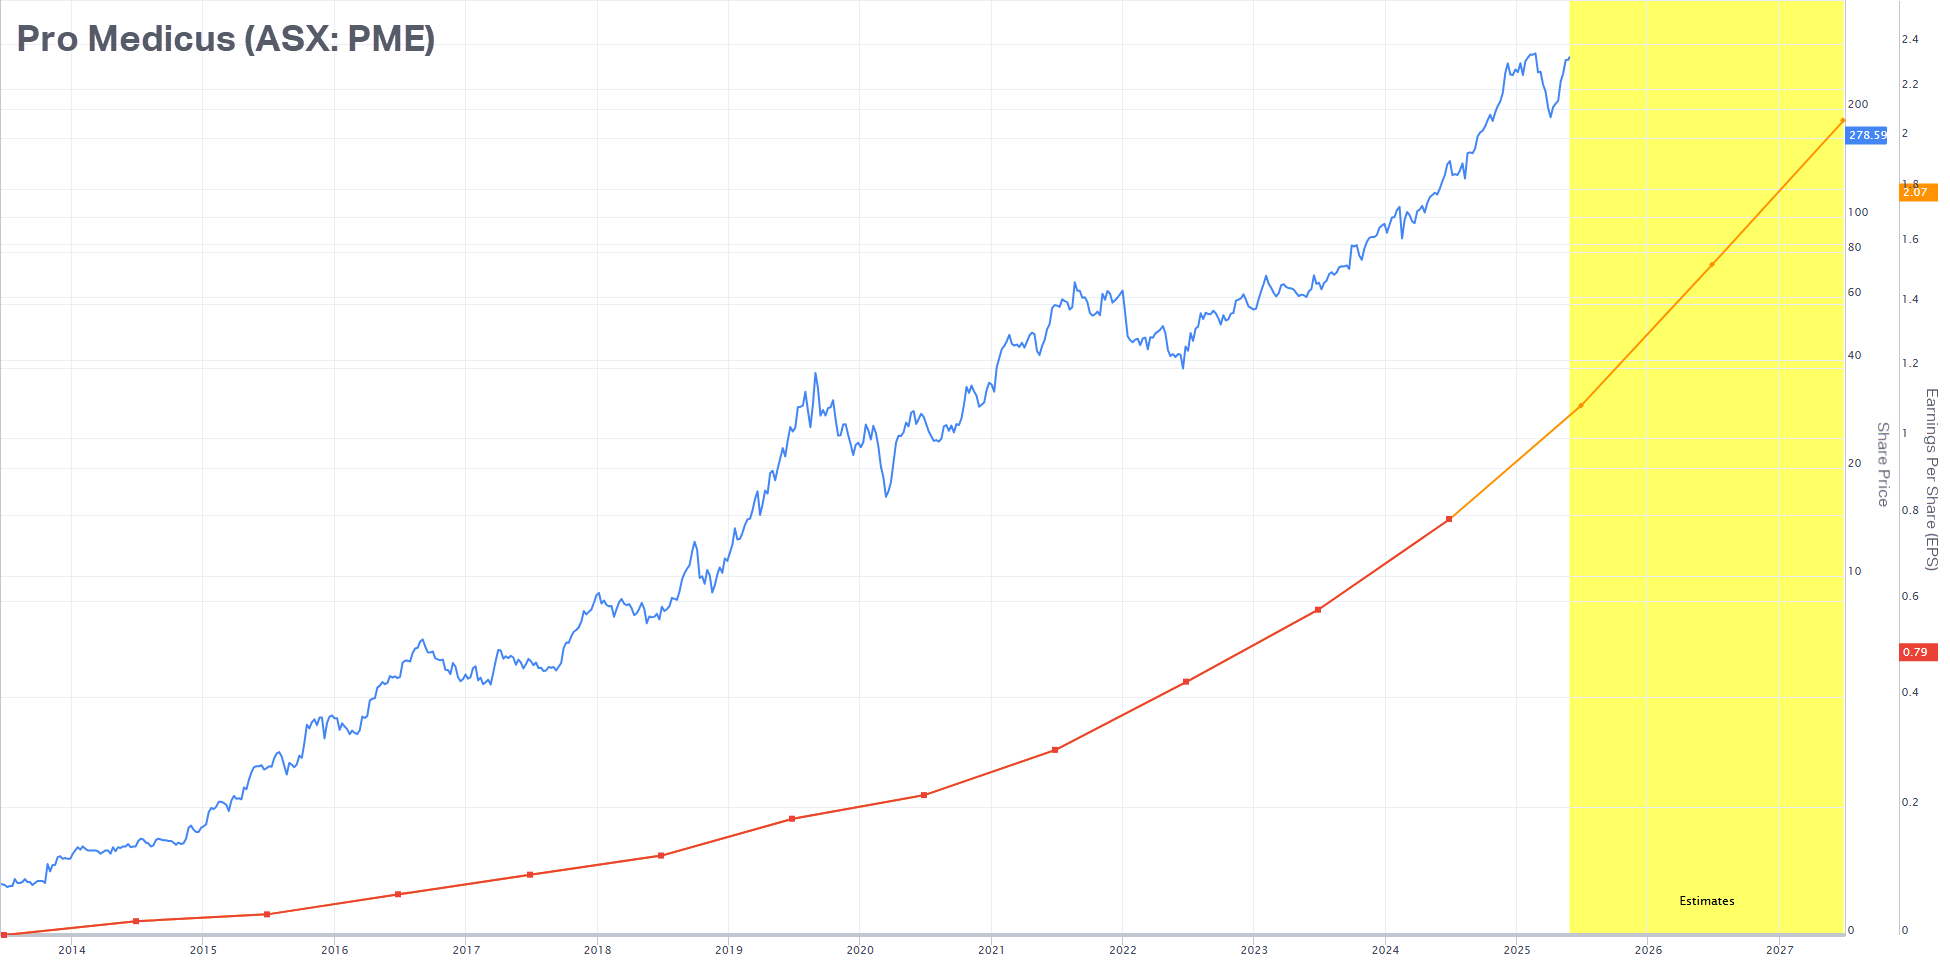
Case Study 1: Pro Medicus (ASX: PME)
Let’s stick with possibly the best example of a growth stock on the ASX over the last 15 years – Pro Medicus. I have overlaid PME’s EPS and share price using a separate axis for each. (Legend: Share price is blue line, historic EPS data is the red line segment and forecast EPS data is the orange line segment). Both axes have been set to a logarithmic scale, so we can visualise the relative proportional changes for each dataset.
%20Share%20price%20versus%20earnings%20per%20share%20(EPS)%20growth%202013-2025.%20Source%20gurufocus.png)
It’s not a perfect correlation, but it’s clear that PME’s share price growth has very closely matched its EPS growth over the last 15 years. One observation I’d make here, and the software I used to generate this chart (nor any other I am aware of) simply doesn’t have the ability to do it – but we really should offset the EPS line by minus 1 year.
This is because markets are always looking forward, not backward – so arguably, today’s share price reflects next year’s earnings (plus a bit of the year after that, and so on). The important thing for investors to remember at all times, is that a stock’s price doesn't reflect historic earnings.
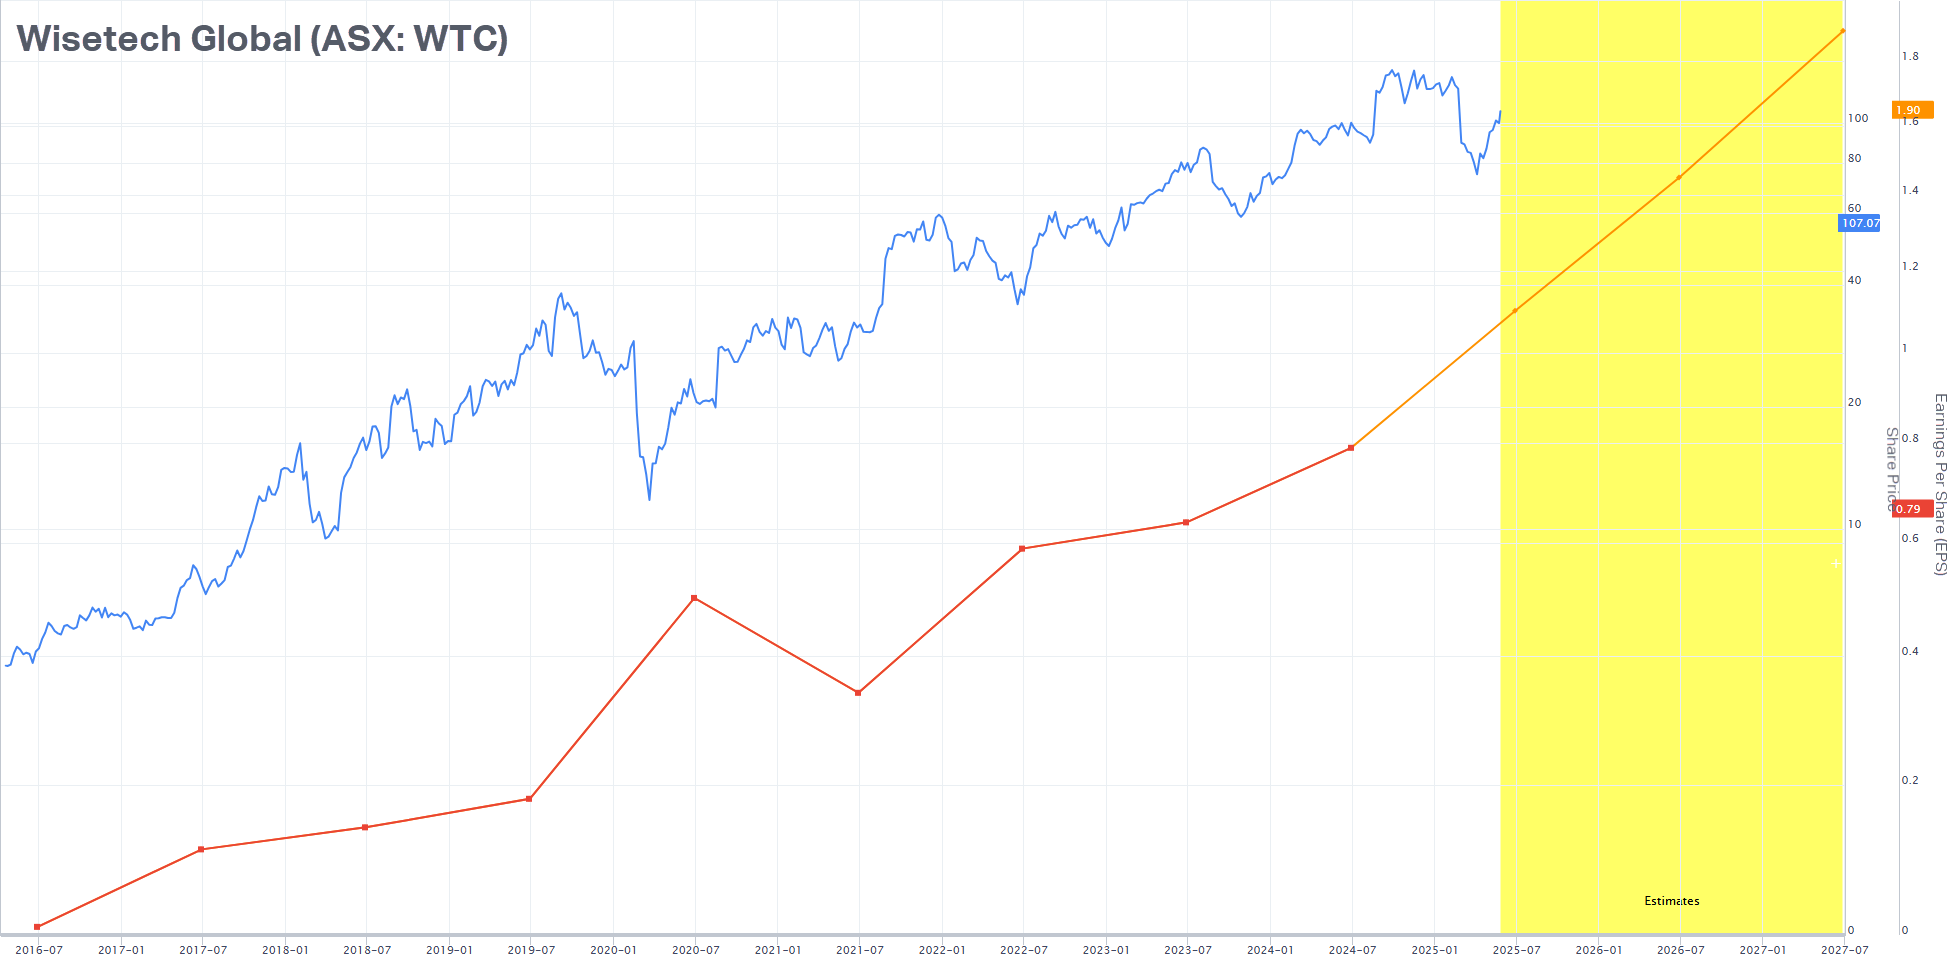
Case Study 2: Wisetech Global (ASX: WTC)
Another major ASX growth story that comes to mind is Wisetech Global. It’s probably not a coincidence that both PME and WTC operate as a software as a service (SaaS) business, as this model is common among many of the world’s greatest growth stocks. SaaS is high margin and massively scalable, and when done right, it can result in exponential earnings growth.
%20Share%20price%20versus%20earnings%20per%20share%20(EPS)%20growth%202013-2025.%20Source%20gurufocus.png)
If the analysts’ consensus estimates are right, then there’s a very good chance WTC’s share price has further upside. Still, and this is the case for all growth stocks, investors must take the leap of faith that this fantastic forecast growth will come to fruition.
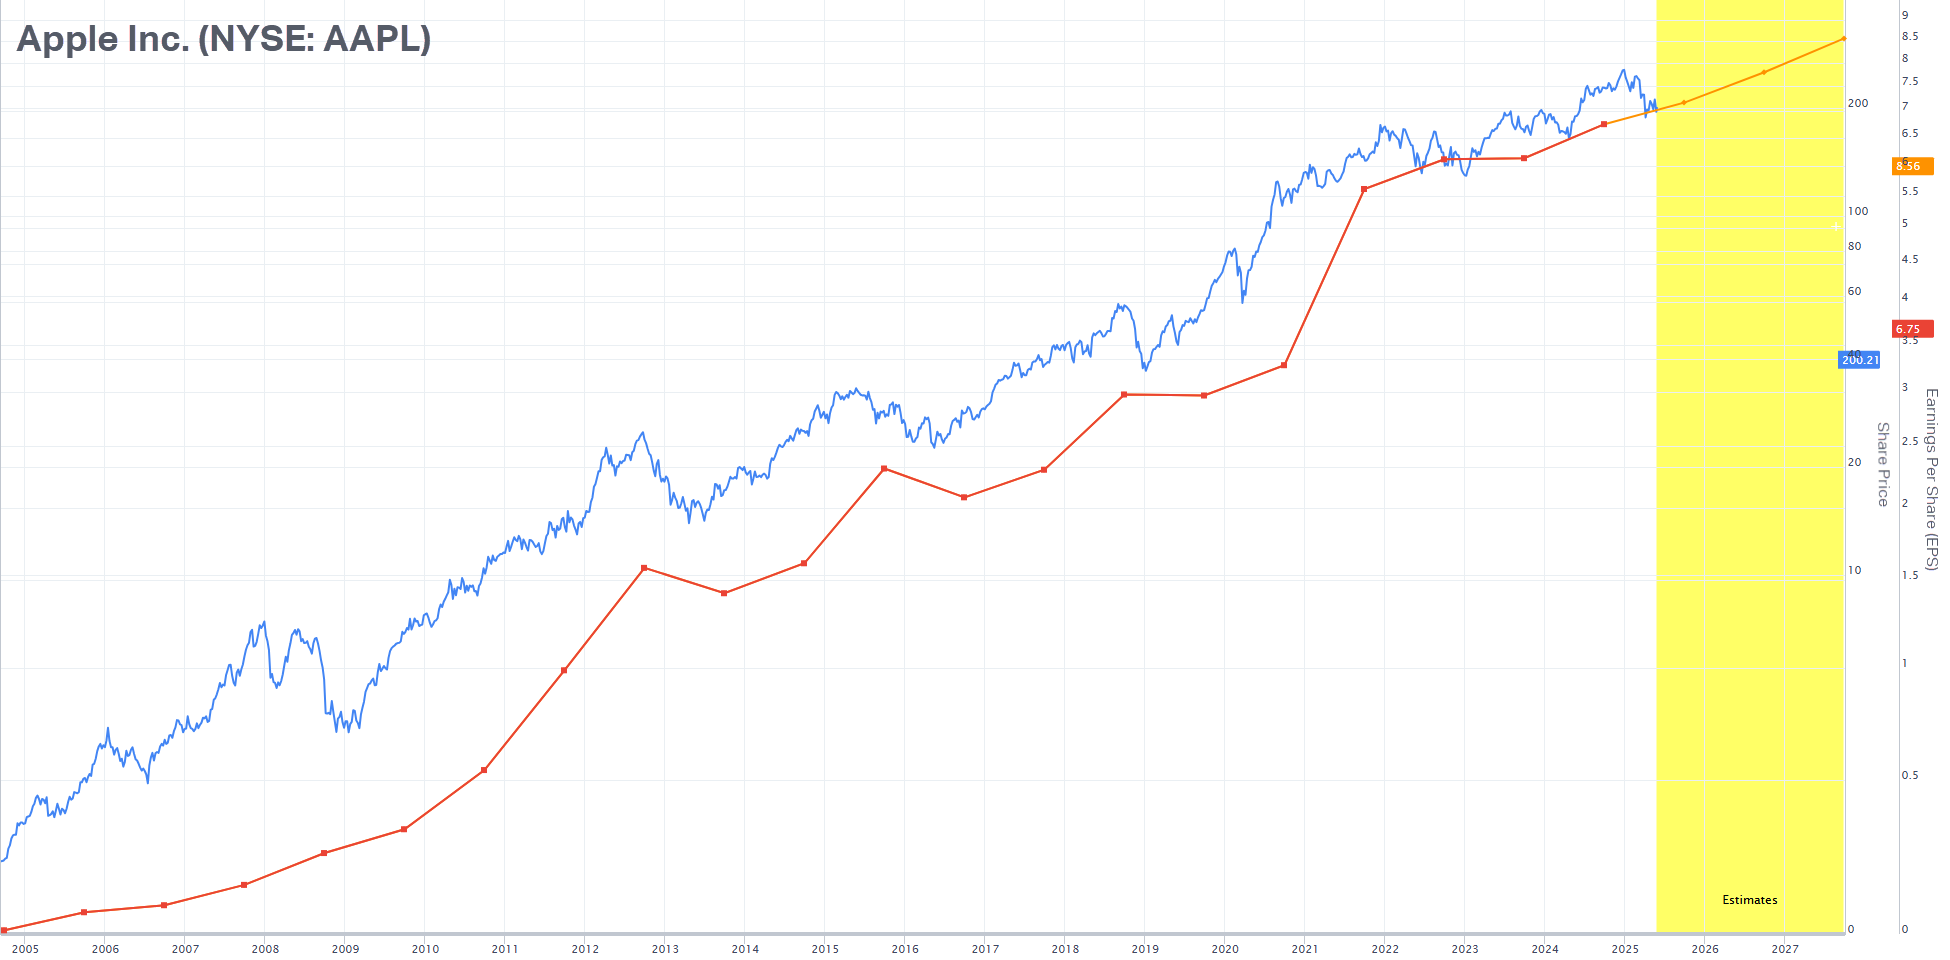
Case Study 3: Apple Inc. (NYSE: AAPL)
No study of growth stocks would be complete without a mention of perhaps the greatest growth stock of the 21st century – Apple. It’s a lesson on how great products, great marketing and brand loyalty, and strong leadership can pile on the earnings growth. As you can see from the chart below, Apple's earnings growth continues even as many of the markets it operates in have matured.
%20Share%20price%20versus%20earnings%20per%20share%20(EPS)%20growth%202013-2025.%20Source%20gurufocus.png)
The big question for Apple, and for its devoted shareholders, is when does that growth start to slow? No stock in the history of growth stocks is yet to continue its exponential growth phase forever, and that’s a nice segue into what can happen when the growth that captured a generation of investors’ imaginations begins to s…l…o…w…d…o…w…n…
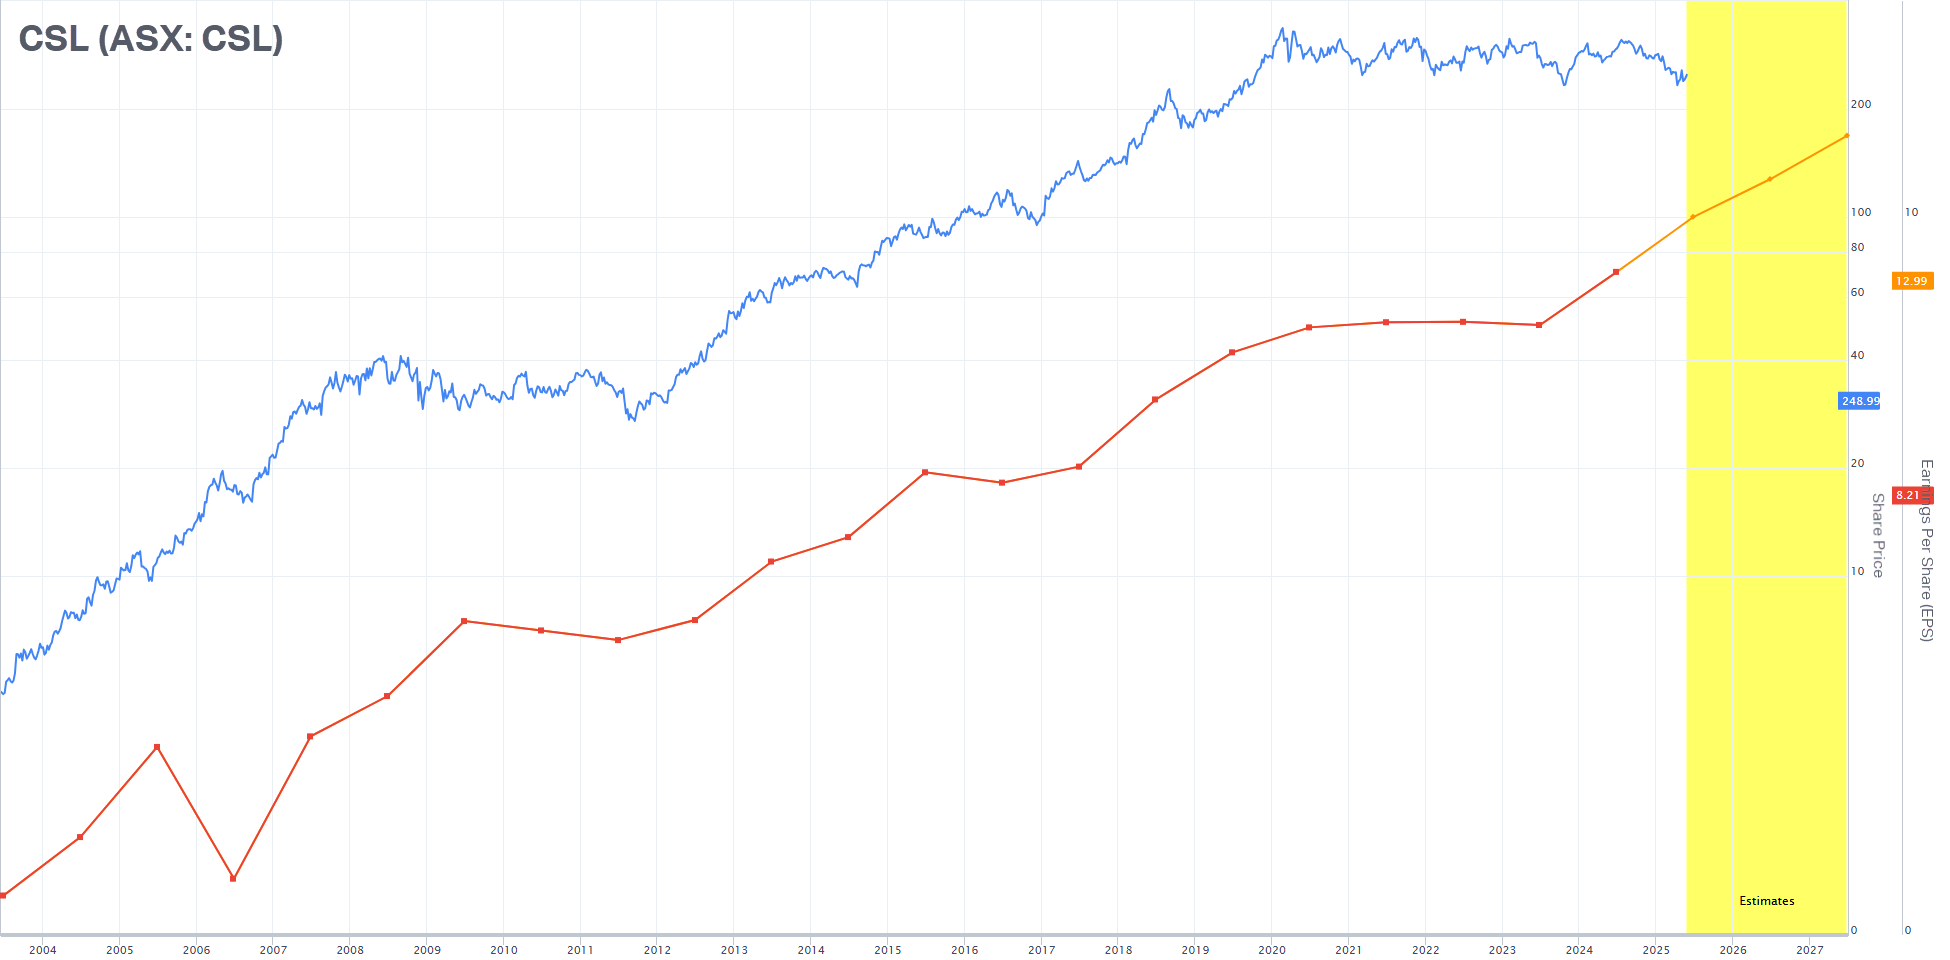
Case Study 4: CSL (ASX: CSL)
CSL is arguably the growth stock that's captured the imaginations of a generation of Aussie investors. Certainly, looking at the chart below, we can see the same strong relationship between earnings growth and share price appreciation over most of the last 20 years.
%20Share%20price%20versus%20earnings%20per%20share%20(EPS)%20growth%202013-2025.%20Source%20gurufocus.png)
This case study is a lesson in what can happen when a growth stock’s EPS growth eventually slows down. CSL’s EPS growth began to slow around 2020, and then stagnated for the next 3 years. Note a similar stagnation between 2009-2013. What did CSL’s share price do each time? Exactly, it also stagnated.
The good news for CSL shareholders is that 2024 saw another uptick in earnings, and the consensus among analysts is that the stock’s earnings growth is set to continue in future years. In theory, if our model is correct, then CSL may be set for another period of corresponding share price growth.
Conclusions and practical applications
It might not seem this way, but growth stocks don’t just appear out of nowhere. They simply get the markets’ attention and capital by delivering superior earnings growth over time. Earnings growth is highly prized among investors who understand that a stock which may appear expensive today, won't be as expensive in the future if it keeps growing its earnings.
Quite simply, share prices of growth stocks tend to be the ones that are rewarded with the greatest appreciation. One might therefore consider growth stocks safer than stocks with low earnings growth prospects.
This notion should challenge those of you who assume a high dividend yield is a trait of a safe stock. Consider that PME’s and WTC’s average dividend yield over the last 10 years is a tiny fraction of a percent, and CSL and APPL’s dividend yield over this time is closer to one percent. It did not hurt their respective total return performances one bit. On the other hand, I am sure you can think of many high dividend yielding stocks that have delivered relatively terrible share price performances over the same period.
If earnings growth is the best indicator of superior total shareholder returns, then it would serve investors to at least consider historic EPS growth, or if available, future EPS estimates. Our sister site Market Index has historic EPS data for every ASX stock for the last 10 years.
As for consensus forecast EPS growth data, this is harder to come by unless you are a heavy hitter with one of the major brokers. However, I put it to you that the best indicator of whether a particular stock is perceived to have strong earnings growth by the entire investment community is its share price.
It’s a fact that stocks which are expected to grow their earnings at a superior rate to the rest of the market have rising share prices. So, if we're looking to pinpoint the factors that more often than not indicate a stock has strong earnings growth – then the first place I would start is a steadily and strongly rising share price.
As a trend following technical analyst, I have based my entire investing approach on this theory. I regularly identify strongly trending ASX stocks that are often described as growth stocks by my fundamental analyst cousins. If you’d like to see which stocks I presently feel are showing the strongest trends, simply tune in to my daily ChartWatch ASX Scans series.
Never miss an update
Enjoy this wire? Hit the ‘like’ button to let us know.
Stay up to date with my current content by
following me below and you’ll be notified every time I post a wire
Carl has over 30-years investing experience and has helped investors navigate several bull and bear markets over this time. He is a well respected markets commentator who specialises in how the global macro impacts Australian and US equities. Carl has a passion for technical analysis and has taught his unique brand of price-action trend following to thousands of Aussie investors.
........
Investing is risky. Inevitably you will endure losses. If you can't cope with losing, don't invest.

%20Share%20price%20versus%20earnings%20per%20share%20(EPS)%20growth%202013-2025.%20Source%20gurufocus.png)
%20Share%20price%20versus%20earnings%20per%20share%20(EPS)%20growth%202013-2025.%20Source%20gurufocus.png)
%20Share%20price%20versus%20earnings%20per%20share%20(EPS)%20growth%202013-2025.%20Source%20gurufocus.png)
%20Share%20price%20versus%20earnings%20per%20share%20(EPS)%20growth%202013-2025.%20Source%20gurufocus.png)
5 topics
12 stocks mentioned

Carl has over 30-years investing experience and has helped investors navigate several bull and bear markets over this time. He is a well respected markets commentator who specialises in how the global macro impacts Australian and US equities. Carl...
Carl has over 30-years investing experience and has helped investors navigate several bull and bear markets over this time. He is a well respected markets commentator who specialises in how the global macro impacts Australian and US equities. Carl...
Comments
Comments
Sign In or Join Free to comment