Navigating industrials after the ‘Trump trade’

Patrik Sjöblom
Bell Asset Management
Since the day before the US Presidential Elections on 8 November 2016 until 31 March 2017, MSCI World Industrials has returned 12.8% in AUD-terms, outperforming MSCI World by 0.9ppt. Analysing stocks and sub sectors within Industrials, we conclude that this has not been a ‘junk rally’ driven by the low-profitability and highly cyclical end of the quality spectrum (i.e. those with relatively more to gain from a near term acceleration of industrial production), but a reasonably balanced cyclical stock rally driven by, in most cases, perceived improvements of fundamentals.
Fuelled by promises of the new US Administration and accompanied by up-ticks in PMIs globally, a combination of meaningfully higher growth expectations and future tax cuts appear to have been priced in.
Conversely, geopolitical risk factors such as falling global trade due to increased protectionism, potential disturbances from Brexit and possible political inaction by the new US Administration as well as raising interest rates have been largely ignored.
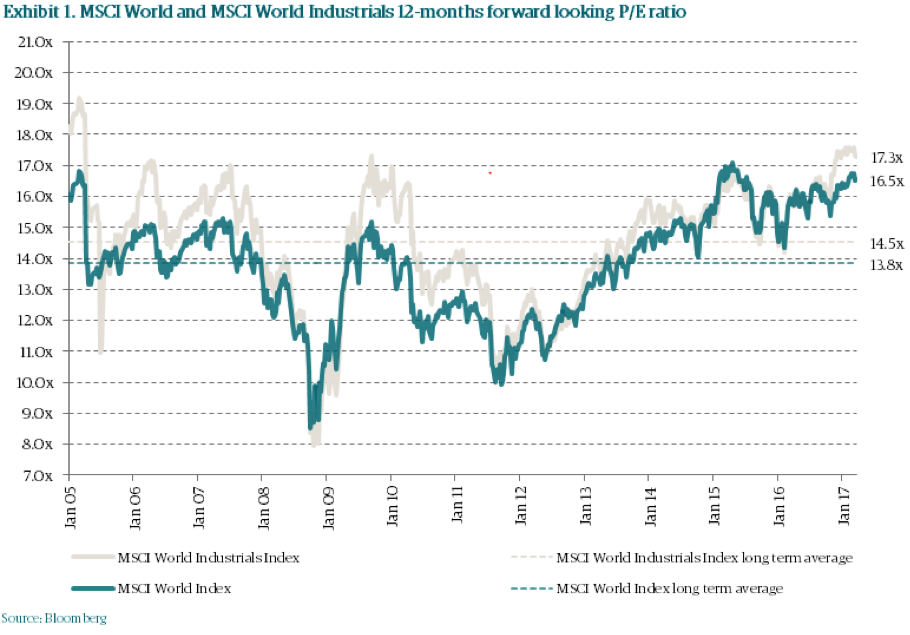
One key issue is the rally has not been supported by overall higher earnings estimates, in fact MSCI World Industrials has seen a 1-2% reduction of consensus earnings expectations during the period, and hence valuation has climbed back towards all time high levels. Valuation expressed as 12-months forward P/E ratio of MSCI World and MSCI World Industrials now at around 17x vs. long term averages of around 14x. See Exhibit 1 below.
There is little doubt in our view that the economic backdrop is improving year over year in 2017 and possibly also in 2018. However, the pace of improvement needed to justify the current all-time-high valuation together with risks mentioned warrant a more conservative capital preservation approach to investments within the Industrials sector.
Common denominators for what we believe constitute the best positioning within Industrials from this point and forward are: (i) visibility supported by backlogs, (ii) well-established and proven M&A programs to supplement organic growth, (iii) ‘self-help’ opportunities and (iv) high share of recurring and/or low GDP correlated revenues.
Upping the bet on growth without supporting earnings revisions
What has changed for Industrials since the US elections? The short answer is: very little except investors have upped the bet on a meaningful acceleration of growth taking valuation towards peak levels.
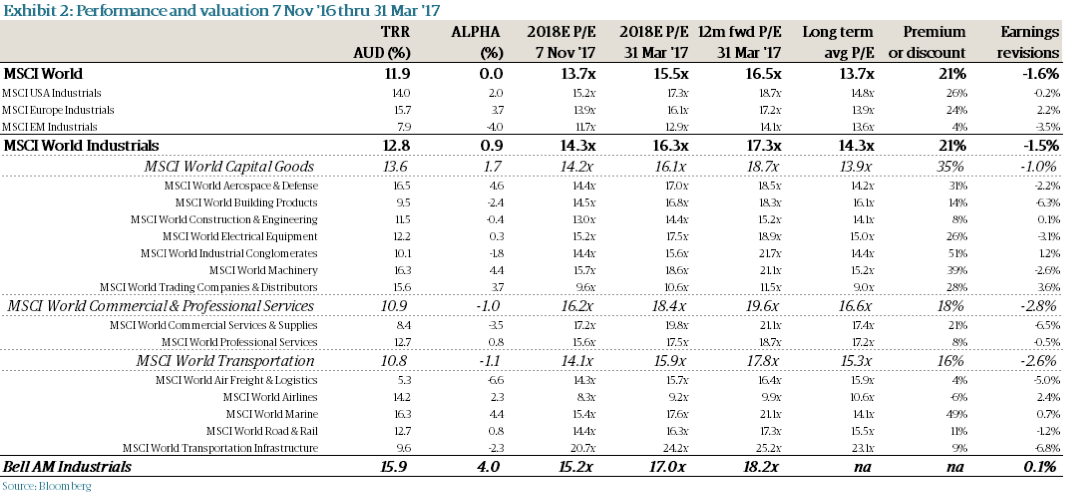
Since the election, sub sector performance (see Exhibit 2 below) in Industrials has been positive but wide spread, from +5.3% (Air Freight & Logistics) to +16.5% (Aerospace & Defence). Geographically, the outperformance of developed markets has continued with Europe in the lead (alpha +3.7%) followed by the US (+2.0%) and emerging market industrials lagging (-4.0%).
However, it appears as if the rally has been much characterised by hope amongst investors while overall earnings expectations amongst sell-side analysts actually have been reduced a bit (see Exhibit 2 below); implicitly valuations have got even more stretched. For example, MSCI World Industrials’ 2018E earnings have been trimmed 1.5%, which together with the 12.8% gain in share prices has lifted the P/E ratio by 13.6% to 16.3x for MSCI World Industrials (see Exhibit 2 below) and compared with the long term average 12-months forward P/E ratio, the sector is now trading at a 21% premium – a level not seen in the last 12 years (see Exhibit 2 below).
Rising tide lifts all boats?
By no means has this been a traditional ‘junk rally’ driven by industrials with the highest operational leverage the and thinnest margins – those with most to gain the most from a near term acceleration of growth. In our view, both sub sector and geographical performance in Industrials post the Trump-win have been pretty balanced and consistent with a scenario where all Trump policies are implemented and effects materialise fairly quickly.
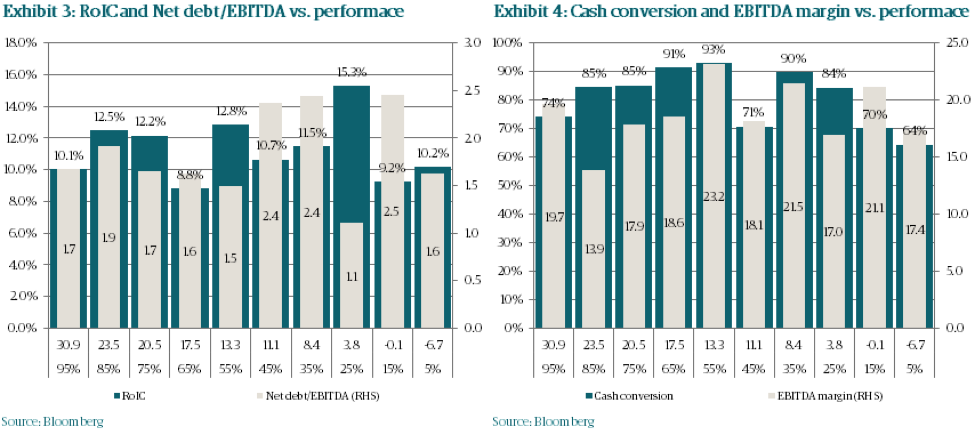
Factor testing the individual stocks’ performance over the post-election period for return, financial leverage, cash conversion and margins, no one factor, alone or in combination with another, serve to explain share price performance. See Exhibit 3 and 4 below; average of factor tested per performance percentiles. Note, for example, that the average return on invested capital (RoIC) is more or less identical in the 5th and the 95th performance percentiles – 10.1% in the 95th percentile where average performance was +30.9% versus 10.2% in the 5th percentile where average performance was -6.7%.
Opportunities and threats
President Trump and his administration have identified a number of areas that certainly need to be addressed, e.g. the seemingly structural trade deficit of the US (has been negative since the early 80’s but improving since 2006), falling or stagnant median real household income levels (slight downward trend since the beginning of the millennium; 2015 2-3% lower than 1999 and 2007), a complicated tax system with high tax rates relative to other countries, as well as the needs for infrastructure investments, better military spend and changes to the Affordable Care Act etc. All these ‘issues’ handled well would set the scene for economic growth that would be both higher and last for longer. However, both rhetoric (“Make America Great Again”; could imply a potential lack of future vision and a wish to reverse) and initiatives so far put a question mark on whether the set of remedies to come are going to be effective if they pass Congress.
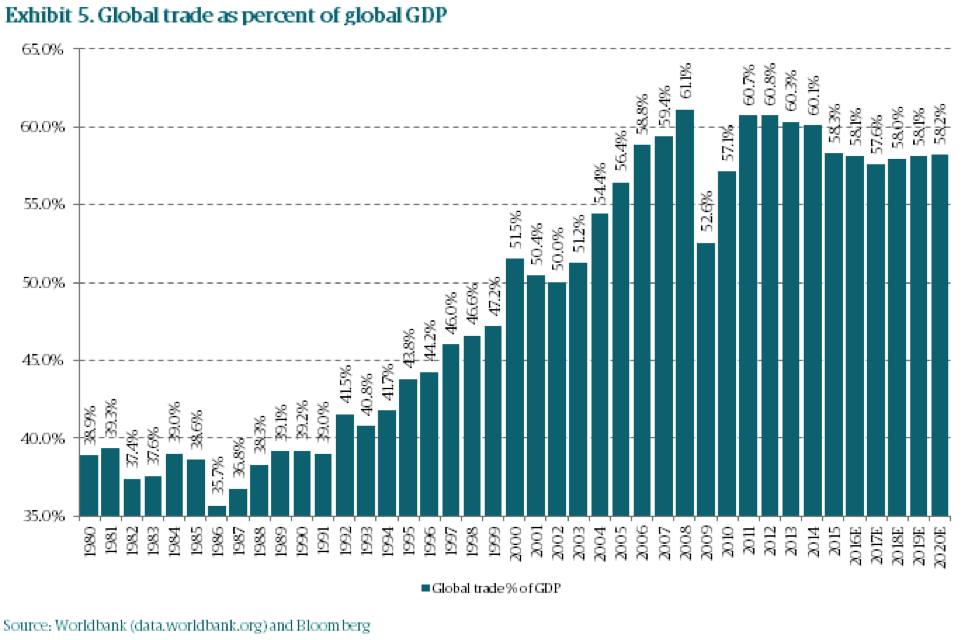
Apart from risks concerning political inaction, effects of potentially unfunded tax cuts, very long lead times of infrastructure projects and the swift upward direction of both short and long end of the yield curve, we believe investors should ask themselves what the effect on growth could be should the already falling trend of the global trade ratio accelerate due to the introduction of trade barriers? Repeal and replace trade agreements. Trump appears to view trade as a zero-sum-game while both textbook theory and empirical evidence prove otherwise. Global trade as percentage of GDP is declining and is set to continue to do so in the near term (see Exhibit 5 below). In addition, questioning ‘globalism’ is not a US phenomenon; populism is on the rise globally and, according to Ray Dalio’s article from 22nd of March 2017 “Populism: The Phenomenon”, votes in developed economies in general elections for populist and anti-establishment parties have risen to 34% in 2016, which can be compared with around 40% in the early 30’s.
Our positioning
One integrated part of Bell AM’s investment process is assessing the growth drivers of companies. For Industrials a strong view on the cycle would therefore be useful. As pointed out we do not doubt that the economic backdrop is improving year over year in 2017 and possibly also in 2018. However, we believe, risks such as all-time-high valuation after an eight-year-bull-market in combination with raising interest rates and political agendas that may not necessarily turn out to be pro-growth warrant a conservative capital preservation approach to investments within the Industrials sector. We believe individual stock positions in Industrials possess one or more growth drivers that are aligned with:
Visibility supported by backlogs (e.g. Airbus, BAE Systems and Raytheon in Aerospace & Defence)
Well-established and proven M&A programs to supplement organic growth that may be somewhat anaemic beyond 2017 (e.g. Assa Abloy in Building Products, Bunzl in Trading Companies & Distributors and to some extent Honeywell in Industrial Conglomerates)
‘Self-help’ opportunities, i.e. ongoing or planned initiatives to grow margins and profitability with the help of organic growth (e.g. Assa Abloy in Building Products and Honeywell in Industrial Conglomerates)
High share of recurring and/or low GDP correlated revenues, (e.g. most of the above mentioned names plus several companies in Professional Services like Dun & Bradstreet, Equifax, Relx and Verisk Analytics).
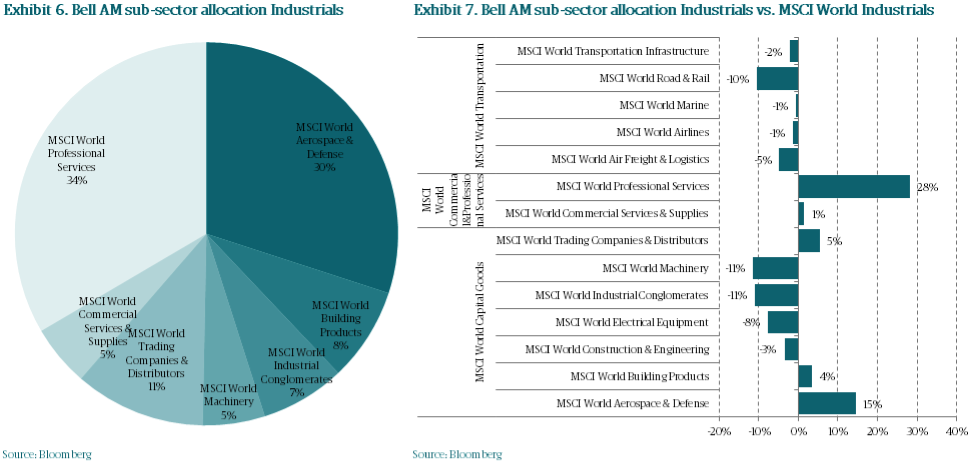
As an unintentional consequence of our bottom up stock picking approach, we ‘happen’ to be marginally over-weighted Industrials (12.7% weight vs. MSCI World at 11.2%), but the sub-sector weightings deviates a lot from the benchmark (see Exhibit 6 and 7 below).
In terms of quantitative quality factors, some characteristics of our holdings in Industrials are:
- Returns (RoIC) more than double that of the market and well above Industrials
- Cash conversion 11% above the market and Industrials
- Financial leverage about half of the market and well below Industrials
- EBITDA margins 17% higher than the market and ahead of Industrials
- Forecast revenue growth of 4.2% p.a. in 2016-19, which is well above Industrials and ahead of the market
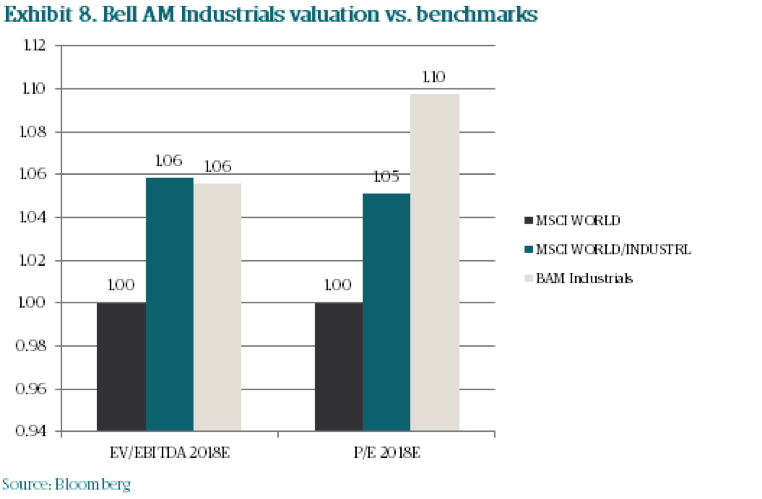
And for this we pay only a small premium of 6% on EV/EBITDA vs. the market and marginally less relative to Industrials, and a 10% premium on P/E (see Exhibit 8 below). In financial lingo this is called QARP – Quality At a Reasonable Price.
Never miss an update
Enjoy this wire? Hit the ‘like’ button to let us know.
Stay up to date with my current content by
following me below and you’ll be notified every time I post a wire
Patrik Sjoblom is a Senior Global Equities Analyst and has 20 years experience in the securities and investment management industries, including 6 years at Bell Asset Management. Patrik gained his equities research skills while working in Stockholm, London and Melbourne. Patrik has primary research responsibilities for eligible stocks that pass the quantitative screening in the Industrials sector and secondary research coverage responsibilities over Energy and Materials sectors.
Patrik joined Bell Asset Management in March 2011. Prior to joining, he was a Senior Investment Analyst covering Nordic Capital Goods at Crédit Agricole Cheuvreux in Stockholm for 8 years. Patrik was also Sector Co-ordinator for Capital Goods at Nordea Securities in Stockholm and Director at UBS Warburg, London covering European Capital Goods. He was also an Equities Analyst at Skandia Investment Management in Stockholm. During his career Patrik specialised in the Capital Goods and Automobile and Components sub-sectors gaining significant insight into the Industrials, CD, Energy, Materials and Utilities sectors. Patrik has a Master of Science degree with a double major in Finance and Economics from the University of Stockholm (1996) and attended Law School at the University of Stockholm in 1992-1995. In the 2010 Extel Survey he was voted No 5 best Nordic Equities analyst and his team was voted No 1 in Extel’s European SMID Cap equity research.

7 topics
Patrik Sjöblom
Senior Global Equities
Bell Asset Management
Patrik Sjoblom is a Senior Global Equities Analyst and has 20 years experience in the securities and investment management industries, including 6 years at Bell Asset Management. Patrik gained his equities research skills while working in...
Expertise
Comments
Comments
Sign In or Join Free to comment