Residential Property Declines – The Lessons of History
The critical financial issue in the Australian economy at present is clearly the possible economic effect of the decline in home prices. We have been warning about high home prices and household debt since 2015, but have always known that the timing of any downturn would be difficult, if not impossible, to predict. However, it is now clear that home prices are falling nationally, and in Sydney in particular, and this raises the question of the likely economic consequences and their timing.
We have examined historical examples as a guide to what to expect. Our view is that investors shouldn’t take comfort from the only modest magnitude of the residential price decline, as the worst of the economic damage could be front loaded and be occurring before the official ‘rear view’ economic data is published.
We continue to carefully watch spending data, particularly from Sydney, which has in the past lead the property cycle, and we see the risks as most acute for the coming Christmas shopping period and the first half of 2019.
We have divided our analysis here into three sections:
- The starting point – A scorecard on the health of the Australian property market.
- Addressing misconceptions – A look at some of the issues that we believe are sometimes misunderstood by commentators
- The economic consequences of a housing downturn – Using history as a guide to what to expect in terms of economic impact and the timing of when it will hit.
1: The Starting Point
It is not possible to assess the future without knowing the starting point and in order to assess whether a residential property market is vulnerable to a destructive “crash” we assess three criteria:
- The level of debt;
- The level of prices, and
- The loan underwriting standards.
It is our view that all “crash” conditions are currently being met by the Australian residential property market, although it does not necessarily follow that one will occur.
1: The Level of Debt
Exhibit 1 shows household debt measured relative to GDP over the last 50 years and shows clearly how high Australia’s household debt is relative to that of many of its peer nations. It is worth observing furthermore how households in various nations geared up during property booms (Japan to 1990, Ireland, the US, the UK and Spain to 2007, for example) and then de-geared during the subsequent property bust.
Exhibit 1 – Australia’s Household Debt Versus Peers
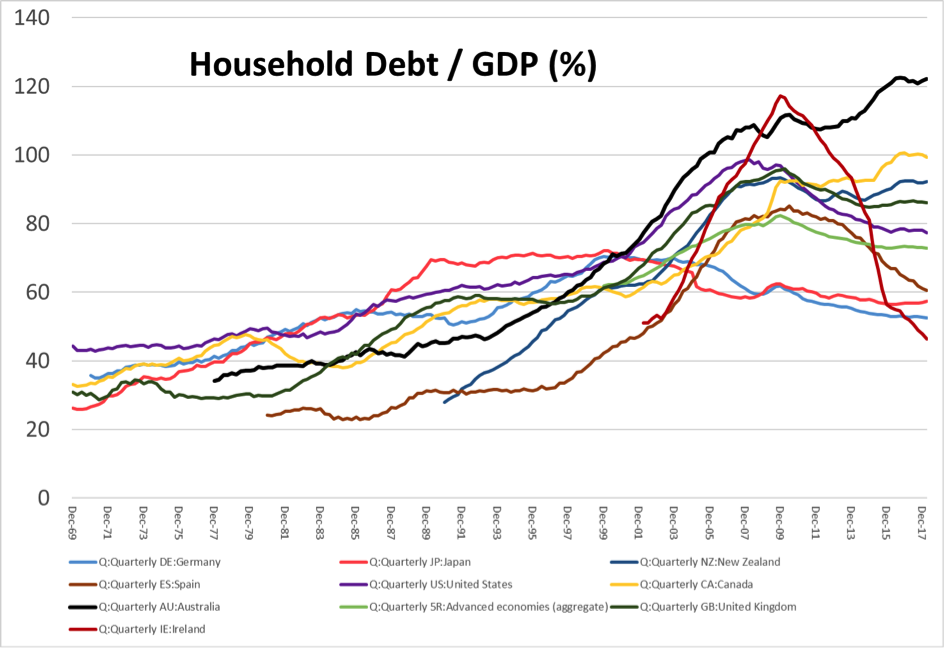
Source: BIS. Data to March, 2018.
2 The Level of Prices
Exhibit 2 provides a long-term view of home prices in Australia since Federation.
Exhibit 2 - Availability and Appetite for Debt has Driven House Prices
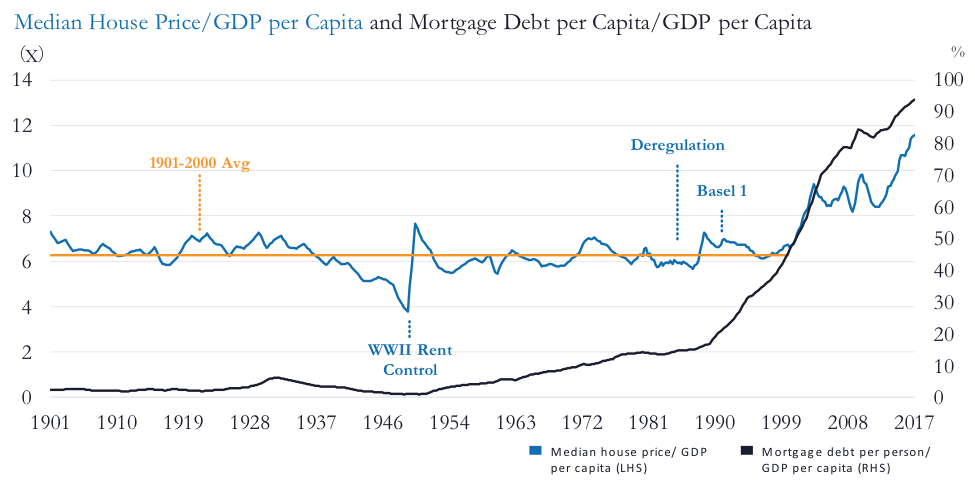
Source: Minack Advisors, Stapledon, UBS, RBA. Data as at 30 September 2017
This is a chart of the median Australian house price as a ratio of GDP per capita (in blue), that is, the price of the median home divided by the average income of its inhabitants. We would expect this to be a stable ratio, as people’s ability to pay rent grows with their income over time and the value of homes should reflect the rental stream of income (or cost that may be avoided through ownership). For the century from Federation to 2000, this was indeed a stable relationship through many upheavals and a seven-fold increase in the Australian population. Since 2000, however, the credit boom (black line) has driven home prices to a level relative to incomes about double that observed over the 20th century.
This important relationship between credit and asset prices is dramatically illustrated by Exhibit 3 showing the level of all credit in Australia and the value of all the land in Australia, both as a ratio of GDP. The 98% correlation between these series makes the point well.
Exhibit 3 – Debt Drives Asset Prices
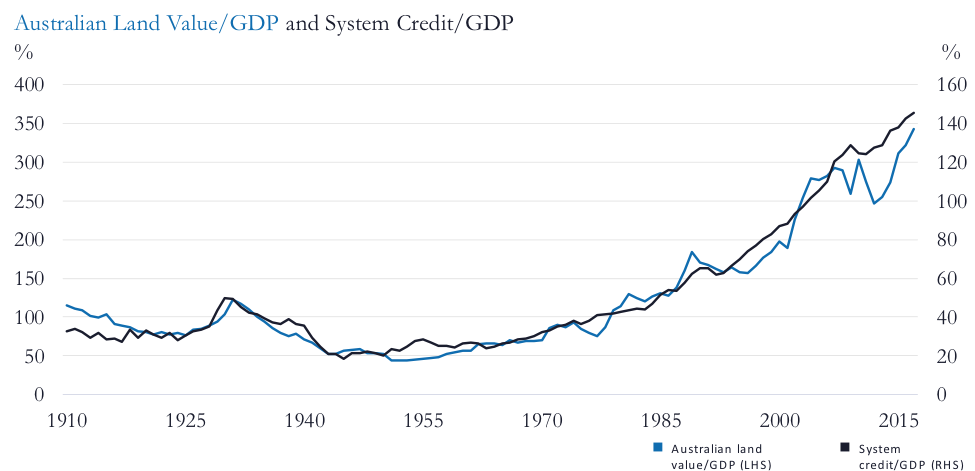
Source: Minack Advisors, Stapledon, Soos. Data as at 31 December
It is worth noting that this data makes it clear that it is not population growth or interest rates that drive residential prices - it is credit. Put more simply, for Australian house prices, what matters is “the number on the letter from the bank in the pocket of the person raising his hand at the auction.”
One immediate conclusion we may draw from this data on debt and home prices is that any analysis that examines only the last 30, or even 40, years of data may give very misleading assurances, given that it only refers to a period of increasing leverage.
Thus references to how house prices behaved in 1983, 1991 or 2001, for example, may not be that relevant to today’s starting point. This may be reminiscent of the US ratings agencies that had to downgrade lower tranches of RMBS paper from ‘AAA’ directly to ‘junk’ or even ‘default’. Their dataset based on the long mortgage boom had not prepared them for what unfolded in 2008.
3: Mortgage underwriting standards
Information released recently by the Royal Commission shows that Australian mortgages have been underwritten based on limited and low-quality data. Whether it is income, expenses or the existence of pre-existing debt, the Australian system has not in recent years, been “data rich”.
This should change with the introductions of Compulsory Credit Reporting and Open Banking over the next two to three years, but it is clear that the high levels of household debt were accumulated in an environment that did not encourage thorough consumer credit analysis.
It is worth emphasizing that Australia does not have the NINJA mortgages that were originated in the US pre-GFC, but it is also important to recall that both Japan and Ireland were NINJA-free mortgage systems with recourse lending. What really matters seems to be the level of debt.
2: Addressing Misconceptions
We also wish to address a few misconceptions about Australian residential property market dynamics.
1: Serviceability
Stretched serviceability (through increases in interest rates) can be a catalyst for a downturn, but are not required (see, for example, Spain and Ireland). If serviceability were the key, then residential markets in the US, Ireland, Spain, Japan and the UK should have rallied when rates were cut to zero, but the cost of credit becomes irrelevant in a downturn.
In the boom the market rose because people were buying (with credit) and people were buying because the market rose. In the downturn this dynamic reverses – irrespective of the cost of credit. The source of the economic downturn when property prices fall is not that households stop servicing their loans, but that they do and start saving and the resulting unemployment then makes it hard for some people to pay.
2: Mortgage losses
Despite poor underwriting, we do not expect large-scale US-style loss on mortgages. The damage to banks would arise from the non-mortgage part of their loan books. The banks may face the difficult combination of a credit cycle combined with falling net interest margins as the RBA cuts aggressively. However, given the reforms put in place since the GFC, there should be no liquidity crisis and capital levels are dramatically improved from the level of 2007. This is an important strength in any downturn and may in fact cushion the economic impact itself.
3: Statistics on Household Balance Sheets
Almost by definition, one can’t detect an asset price bubble when examining a balance sheet. The balance sheets of Japanese banks and corporates were pristine in 1990 (the assets were overvalued) and the dynamic LVR on US mortgages reached a low point in 2006 (houses were overvalued). Despite this, various commentators show debt:asset ratios for Australian households as evidence that all is well.
4: Beware Averages
The average person never loses his job (even in 1932) and the average firm never fails. Problems stem from the tails of the distribution. Thus one needs to treat statistics about the average pre-payments of borrowers and the like with skepticism. What matters is gross debt and the fact that household A has $1m in the bank does not help household B which has debts of $1m, nor does it help B’s bank.
5: Don’t use the rear-view mirror
Unemployment, in particular, is a lagging indicator and it usually does not give information about future activity. Usually, officials and economists argue that all seems to be OK, until the numbers show that it is not and one discovers retrospectively that the recession started several months ago. We don’t know if there will be a downturn, but we do know that recessions, by their nature, always come as a surprise and that trailing data never provides a warning.
3: The possible consequences
We examined five cases where home price falls led to recessions, Japan (peak in 1990), US (2006), Ireland (2007), Spain (2007) and the UK (2007). It is important to stress that this is a biased sample of instances where the wealth effect of home price falls did lead to significant downturns. Our aim is to examine the timing of these downturns, rather than primarily trying to predict whether Australia will experience a recession.
The table (Exhibit 4) below shows some summary statistics.
- The average house price fall was 34% at an about -8% pa rate (72bps per month), with the worst year of decline recording an average -16% drop (similar to a typical boom year gain). The declines reversed 4 years of price gains on average and prices took a little more than six years to reach bottom from the peak.
- The first bank failure or nationalization took place about two years after the peak in home prices, or only about 28% into the total residential property bear market period.
- The affected economy went into recession when prices were down only 7% on average and emerged back to growth with prices down 21%, with - on average - a 13% price decline still ahead. Thus the affected countries went into recession when only about 1/5th of the total price decline had occurred and the recession ended when 1/3rd of the price falls were yet to come.
Exhibit 4 – Historical Crashes
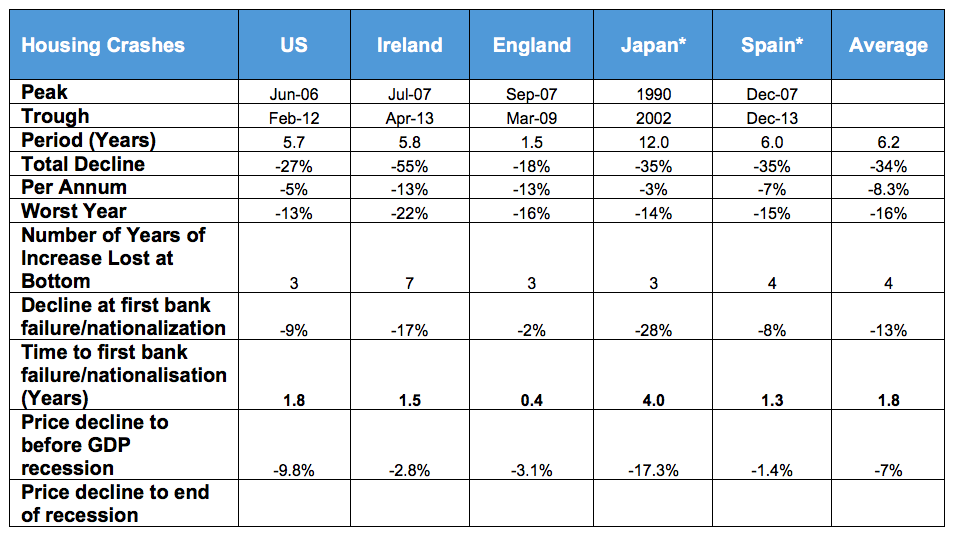
*Annual data for Greater Tokyo and quarterly data for Spain. Monthly data for US, Irish and English home prices. Source: FRED, Federal Reserve Bank of St. Louis, Haver, Irish Central Statistics Office, StatBank, HM Land Registry at Gov.UK, Instituto Nacional de Estatistica, The Nikkei Shimbun via Japan Property Central.
We draw the following lessons from these examples.
Lesson 1: Residential markets move in slow motion
I have heard commentators reassuringly noting that the downturn has been deliberately engineered by the prudential regulator and stating that price declines in Australia are “orderly”.
In this context, it is worth noting that the Japanese and US residential bubble were both deflated deliberately by central banks, who subsequently proved unable to manage the consequences.
Asset markets that rise on speculative momentum can fall when that positive feedback mechanism reverses – greed turns to fear, and just as fundamental valuations didn’t matter much during the boom, they don’t matter much during the fall.
In each of the five cases considered above, dramatic interest rate cuts (often to zero), bank bail-outs, debt forgiveness programs, government risk underwriting or even QE did not prevent the residential market from continuing to fall for a number of years. The “this is a deliberately engineered downturn” argument sounds reassuring, but can mean little in practice.
As RBA Deputy Governor Guy Debelle noted in a recent speech (Nov 15, 2018), the degree and speed of the slowdown is no longer completely within the control of regulators, since in a downturn the demand for credit falls independent of any changes to supply.
The data shown above also makes it clear that compared to stock markets, residential markets move in slow motion – the typical equity bear market unfolds as a fall of 30% to 40% over one year, while these five property crashes took six years to decline by a similar percentage. The national property decline of 0.7% for November 2018 was consistent with the sample of five crashes and, while one should not read too much into a monthly data point, Sydney’s 1.4% monthly decline in November was at “free fall” levels for a residential property market. Clearance rates in Sydney have reached lows previously seen in late 2008 after the Lehmann failure and in 1989 when mortgage rates reached 17%.
The extent of future residential property price declines is unknown, but the trigger for the fall and the current rate of decline are not reasons for expecting this to be a “soft landing”.
Lesson 2: The Damage is Front Loaded
While asset values in residential markets can move in ‘slow motion’ the economic impact of the downward moves often happens much faster. It is not the cumulative erosion of household net worth during a downturn that determines the economic consequences – instead, the economic impact arises from the change in expectations of households, from confidence in future growth of their wealth, to fears about declining wealth and indebtedness.
Households respond to this change of expectations by increasing savings and trying to de-gear. This focus on the household balance sheet and the critical role of debt is illustrated by the following data collected by the Bank of England for three European countries.
Exhibit 5 shows the change in household spending across the GFC period 2007 to 2009 sorted by the debt-to-income (DTI) ratio of the households in the UK, Denmark and Norway (the first of which had a “bad” GFC, while the two Scandinavian nations were less affected).
Exhibit 5 - How Households React To a Shock to Confidence
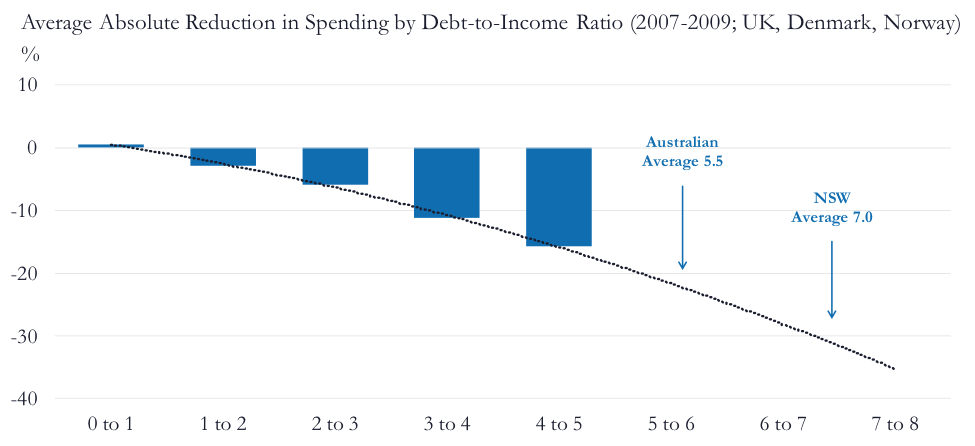
Source: Bank of England, Financial Stability Report November 2016 | Issue No. 40 ((VIEW LINK) drawing on various national sources. DTI ratio includes all debt, mortgage and personal.
Australian DTI Ratios from Digital Finance Analytics include only mortgage debt gross of off-set accounts.
The relationship between reductions in spending and household leverage is clear, and it is worth noting that if anything the more highly indebted households would likely have held safer jobs (which is why they could borrow more). It presumably was not job losses per se that led to this differentiated outcome, rather it was concern about job safety, their balance sheet and an associated desire to save.
The absence of balance sheet information means that we do not have debt to income (DTI) ratio data in Australia, so we show the survey estimate from Martin North’s Digital Finance Analytics. This data may not be as reliable, but given that household debt is ca 200% of household incomes and given that approximately 37% of households have a mortgage, a ratio of ~5.5x is at least credible.
The high level of Australian house prices also makes local households more sensitive to wealth effects due to house prices changes. At the peak of the US housing boom in 2006, homes accounted for 36% of the net worth of the average US household. This fell to 28% with significant associated wealth effects. In Australia our starting point in 2017 was a net worth exposure to property of over 70%.
The critical question may be an unanswerable one, however: “How bullish were Australian consumers before the downturn?”
It is the rapid cut in consumption when confident complacency turns to fear that can cause economic dislocation. On that score, Australia’s starting point was arguably stronger than in the five nations surveyed above. Conditions post-GFC never hit the boom-time euphoria of 2007 and there are signs that households were more cautious, with a distinctly slower accumulation of debt post-GFC.
The argument against this is that while the overall economic picture was more subdued, the residential property market was the one area of excess – the high investor participation, the widespread use of interest-only loans and the fact that 60% of property investors have negative cash flows. This suggest a considerable element of speculation and a strong belief that property prices, in Sydney and Melbourne at least, could never fall.
Beware Complacency
As mentioned, we see the risks as most acute for the coming Christmas shopping period and the first half of 2019. Sydney consumer spending will be a key lead indicator. Our view is that if Australia were to experience a housing-mediated recession, investors should expect the recovery to be weak and drawn out, as home prices keep falling and households continue to de-gear.
The international experience suggests that we should not be complacent about the currently still modest magnitude of the residential price decline, nor take much solace from the regulatory catalyst or the present “orderly” rate of home price falls. Furthermore, history suggests that we should expect an early response in household spending to the price declines.
The question as to whether there will be a material shock to confidence and spending that can set off a recessionary feedback cycle is more difficult to answer, but the probability of this “fat tail” outcome has clearly risen significantly. And if a recession in Australia does ensue, it may well be an extended one, with only a slow and weak recovery.
Want to hear more?
You can read further insights and analysis from Philipp and the team at Lazard here.
---
This content represents the views of the author(s), and its conclusions may vary from those held elsewhere within Lazard Asset Management. Lazard is committed to giving our investment professionals the autonomy to develop their own investment views, which are informed by a robust exchange of ideas throughout the firm.
Important Information
Published on 1 March 2018. Information and opinions presented have been obtained or derived from sources believed by Lazard to be reliable. Lazard makes no representation as to their accuracy or completeness. All opinions expressed herein are as at 31 December 2017 and are subject to change.
This letter and all research and materials enclosed are the property of Lazard Asset Management Pacific Co., ABN 13 064 523 619, AFS Licence 238432 (“Lazard”). © 2018 Lazard Asset Management Pacific Co.
The purpose of this letter is to provide information about the Lazard Australian Equity Strategies and Lazard Asset Management Pacific Co.
This material is for informational purposes only. This information is not intended as and should not be interpreted as the giving of financial product advice, fund management services, an offer of financial products or to enter into any contract or investment agreement in respect of any product offered by Lazard Asset Management and shall not be considered as an offer or solicitation with respect to any product, security, or service in any jurisdiction or in any circumstances in which such offer or solicitation is unlawful or unauthorized or otherwise restricted or prohibited. This information must not be distributed to retail clients.
All of the graphs, charts, and tables have been prepared by Lazard and are as at the relevant date as stated.
The securities referred to in this presentation are not necessarily held by Lazard for all client portfolios, and should not be considered a recommendation or solicitation to purchase or sell the security. It should not be assumed that any investment in the security was, or will be, profitable.
This letter has been prepared without taking account of any investor’s objectives, financial situation, or needs. Investors should get professional advice as to whether investment in the Strategies is appropriate having regard to their particular investment needs, objectives, and financial circumstances before investing. Investors should obtain a copy of the current PDS for the Lazard Australian Equity Fund, Lazard Select Australian Equity Fund, or Lazard Australian Diversified Income Fund at (VIEW LINK), or from an IDPS operator, and consider the PDS before making any decision about whether to acquire, or to continue to hold, units in the funds. Neither Lazard nor any member of the Lazard Group, including Lazard Asset Management LLC and its affiliates guarantees in any way the performance of the strategies, repayment of capital from the strategies, any particular return from, or any increase in the value of the strategies. Information contained in this presentation is confidential and should not be reproduced. Past performance may not be indicative of future results.
Never miss an update
Enjoy this wire? Hit the ‘like’ button to let us know.
Stay up to date with my current content by
following me below and you’ll be notified every time I post a wire
Philipp Hofflin is a Portfolio Manager/Analyst on the Australian Equity Team with Lazard Asset Management Pacific Co. He began working in the investment field in 1995. Prior to joining Lazard in 1999, Philipp was the Head of Financial Markets Research with Royal & Sun Alliance in Australia, (previously Tyndall Investment Management) and a tutor/lecturer for the School of Mathematics and Statistics at the University of Sydney. Philipp has a BSc (Hons) from The University of Melbourne, a Graduate Diploma in Economics and a PhD from the University of Sydney. Philipp specializes in interest rate sensitive companies and is fluent in German.
Featuring

Dr Philipp Hofflin,
Lazard Asset Management
Philipp Hofflin is a Portfolio Manager/Analyst on the Australian Equity Team with Lazard Asset Management Pacific Co. He began working in the investment field in 1995. Prior to joining Lazard in 1999, Philipp was the Head of Financial Markets Research with Royal & Sun Alliance in Australia, (previously Tyndall Investment Management) and a tutor/lecturer for the School of Mathematics and Statistics at the University of Sydney. Philipp has a BSc (Hons) from The University of Melbourne, a Graduate Diploma in Economics and a PhD from the University of Sydney. Philipp specializes in interest rate sensitive companies and is fluent in German.

2 topics

Philipp Hofflin is a Portfolio Manager/Analyst on the Australian Equity Team with Lazard Asset Management Pacific Co. He began working in the investment field in 1995. Prior to joining Lazard in 1999, Philipp was the Head of Financial Markets...
Expertise
Comments
Comments
Sign In or Join Free to comment