Stockmarket Euphoriameter rises to a new post-crisis high
The Euphoriameter rose again in July, with the combined sentiment reading for the S&P500 lifted by higher forward PE ratios, a falling VIX, and rising levels of bullish sentiment in the surveys. The chart will probably trigger memories or comparisons to the 1990's because aside from the surge coming out of the early 2000's bear market, the last time we saw such levels was the late 90's into the tech bubble.
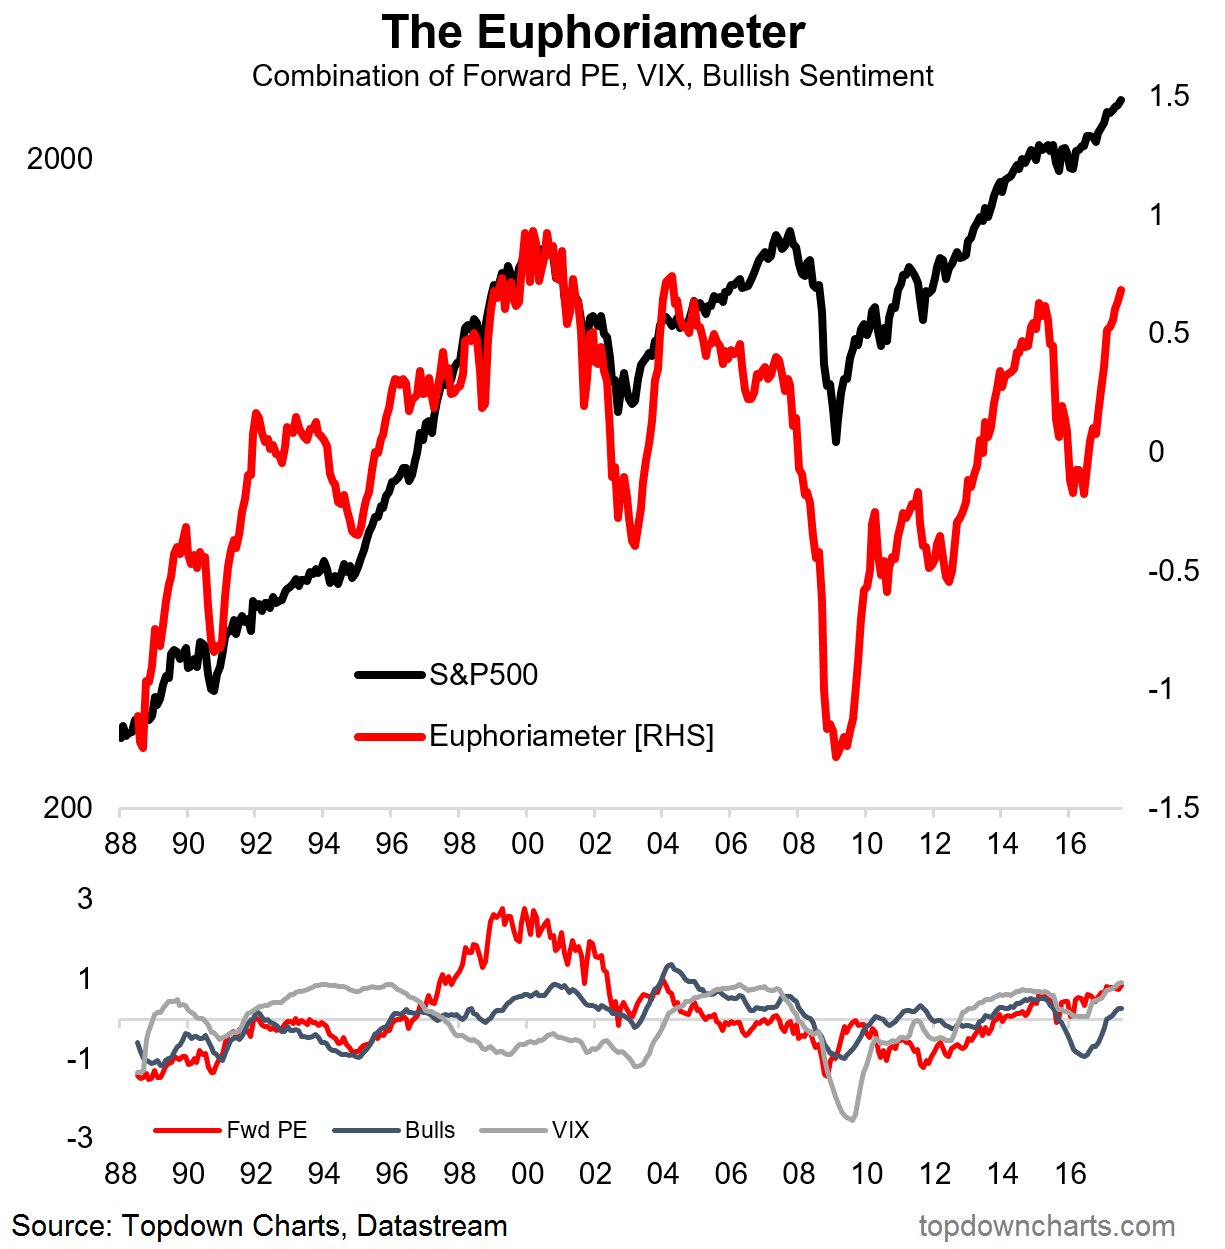
Indeed, usually you look at sentiment indicators as a source of contrarian signals, but bullish sentiment can feed on itself and produce a powerful dynamic which creates the momentum that ends up taking the market to even higher highs. However, as I've previously noted, as valuations move higher and bullish sentiment builds, implicit in this is increasingly higher expectations, and the more bullish the expectations the greater the risk of disappointment.
Never miss an update
Enjoy this wire? Hit the ‘like’ button to let us know.
Stay up to date with my current content by
following me below and you’ll be notified every time I post a wire
Callum is Head of Research at Topdown Charts.
Topdown Charts is a chart-driven macro research house covering global Asset Allocation and Economics.

4 topics

Callum is Head of Research at Topdown Charts. Topdown Charts is a chart-driven macro research house covering global Asset Allocation and Economics.
Expertise
Callum is Head of Research at Topdown Charts. Topdown Charts is a chart-driven macro research house covering global Asset Allocation and Economics.
Expertise
Comments
Comments
Sign In or Join Free to comment