The ABC of Tax

Clime Investment Management
Clime Investment Management
A few weeks back, “our ABC” poured oil onto the heated debate in Canberra regarding the Commonwealth Government’s proposed tax rate cut legislation. The ABC produced data which represented that a significant proportion of major Australian companies hadn’t been paying tax in recent times, and from this observation its commentators suggested that the benefits of a corporation tax cut were (arguably) illusory.
The Australian corporate sector fought back with a tirade of criticism and the mainstream published media joined in to attack the ABC analysis. It was noted that companies don’t pay tax if they make losses or have carried forward tax losses. Further, it was suggested that the ABC did not understand the taxation concessions (e.g. depreciation allowances) that support capital investment by companies.
One AFR columnist belted the ABC with this commentary – “… available data produced by the Australian Taxation Office showed that 32 of Australia’s largest 50 companies paid 19.33 billion in company tax in the 2015-16 year, further noting that 18 paid nothing because they lost money or were carrying over previous losses”.
However, the vitriol of the counter claims seem to have tripped over the facts. Indeed, the counter arguments disclosed some alarming facts that provide Australian investors with an insight into why the Australian share market index returns have been so poor for the last decade.
Consider these questions which we believe need to be properly analysed in the tax debate:
On what basis is it justifiable that 36% (or over 1 in 3) of Australia’s largest companies did not pay tax in FY 16? Is it due to poor profitability, or is it indicative of an investment surge that is strangely not yet observable in ABS statistics?
Given that the average Australian’s superannuation funds are heavily invested in major domestic companies, why is sub-optimal performance, evident over the last ten years, not challenged by the mainstream press or questioned by the Parliament? and
Is the low payment of corporate tax by many Australian listed companies a true indication why the local share market has seriously underperformed international markets over the last ten years? Are Australian companies poor earners compared to international peers? What are the large Australian capital managers doing about underperformance by Australian companies?
Looking more deeply into the major Australian public companies that pay tax, the following list is incisive. It shows that our largest ten listed tax payers paid $19.5 billion in tax in FY15.
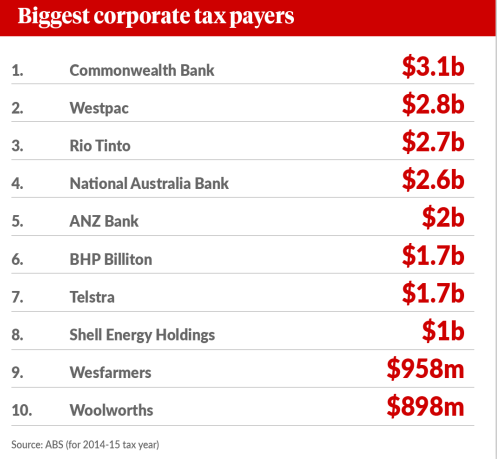
Figure 1. Companies paying the highest corporate tax
Source. ABS
As we noted in a recent video, the current Royal Commission into banks is focused on a highly profitable and consistent sector of the Australian economy. While the Commission is focused (justifiably) on poor corporate behaviour of banks, it should acknowledge that bank profitability is crucial to the funding of the Commonwealth budget. The burden on banks is great because of the poor returns of many other sectors.
In our view these other sectors, which are perennial underperformers, continually and unfairly escape public scrutiny. A Royal Commission into the poor performance and equity returns of the Australian corporate sector (as a whole) would seem equally justifiable. Australia needs a highly profitable corporate sector – not only to contribute to taxation collections but to support the retirement needs of the community.
While the above table refers to FY15, we believe the tax payments were probably largely similar in FY16. From this we can draw the following conclusions regarding Australia’s top fifty companies and their recent tax payment history:
- the top ten taxpayers (20% of the sample) pay virtually all the tax;
- about 33% of the top fifty paid no tax; and
- therefore about 47% of the top fifty paid very little tax.
Since the GFC, the Australian corporate sector has been meandering along with tax contributions to the funding of the Commonwealth budget (see chart below) broadly stable. Meanwhile, it is Australian workers (individual taxpayers) that have been increasingly burdened with higher and higher tax contributions.
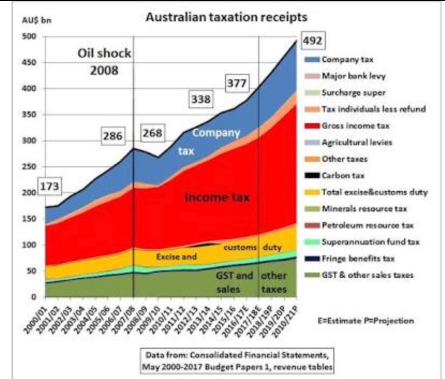
Figure 2. Australian taxation receipts
Source. Consolidated Financial Statements, May 2000-2017 Budget Papers 1, revenue tables
The chart above shows that actual personal income tax collections have risen by over 50% since 2008 while corporate tax collection has lifted by only 15%.
The following tax collections are forecast by Treasury for FY18. The portion of tax paid by individuals will be a record percentage and it will continue to set records for the foreseeable future.
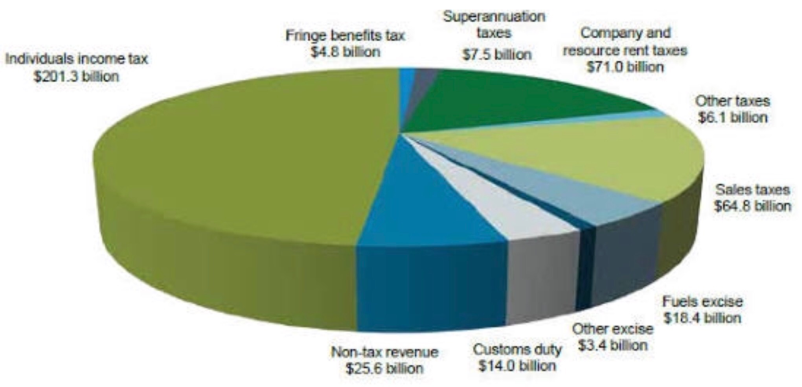
Figure 3. Distribution of tax revenue sources
The charts above show the increasing burden on workers through the PAYG system, and when GST is added it can be gleaned that the focus of tax reform needs to properly consider the increasingly heavy burden on the average worker (rather than the largest corporations).
The debate around Corporation Taxation has deviated from the need for a total tax reform package focused on Australia’s long-term strategic growth plans and needs. The tinkering with tax rates has been a feature of Australia’s tax system for decades with the only real taxation reforms adopted over 30 years being –
The introduction of dividend franking as an important part of Australia’s long-term superannuation structure and attempt to alleviate double taxation of dividends;
The creation of tax-free pension funds that were designed to reduce the burden on governments to provide public pensions for an ageing population;
The introduction of GST to target taxation collection on consumption and away from income.
While the above are all noble initiatives, each has failed in some respects to solve deep seated problems and alleviate the growing taxation claims on average income earners.
The franking initiative – which should have encouraged corporate taxation to be paid from increasing profits and create franking for shareholders, has faltered in this respect over the last decade. Increasingly the benefits of franking are for a minority of investors, placing a greater taxation burden on the many. The creation of tax-free pension funds has not (after 30 years) dramatically reduced the percentage of people that need a public pension. The GST was set too low and was left to the collective whims of State governments to adjust the rate in any future recalibration of Australia’s taxation system.
Another claim of the recent debate regarding Australia’s company tax rate has been the argument (based on the US experience) that lower tax rates will see higher wages and employment. While recent moves by some US corporates suggest this may occur, there is no broad evidence (yet) that this is the case. Some US multinationals have bartered for massive tax reductions on foreign sourced income and so their offer of rewards to US employees may well be a short term public relations gesture. It may have more to do with foreign sourced tax than domestic tax, and that is not part of the debate in Australia.
In any case, the arguments regarding Australian corporation tax and its relationship with wages or employment has ignored the more obvious need for a direct attack on taxes that penalise employment growth and investment. It is strange that major corporations have not focused their attack on state-based payroll taxes. It is these taxes (and not corporations tax) that lowers profits, increases the cost of business and taxes employment.
If major corporations sensibly broadened the tax debate, the need and desirability of a full and broad adjustment to Australia’s taxation system could result. The re-setting of GST, the lowering of average PAYG rates and the alignment of business with a national plan for economic growth through taxation incentives and government support could be developed.
That is a long way from the current knee-jerk discussion regarding a lowering of company tax. Our view is that Australia needs a strategic tax policy designed to promote growth and fairly distribute the tax burden over the long term; it should not be based merely on short term adjustments overseas.
ATO charts and commentary
The Australian Taxation Office regularly produces “transparency” reports on the taxation payments by major Australian companies and the operations of foreign subsidiaries. The following is a broad summary of the ATO observations.
In their FY16 transparency report, the ATO noted there were 732 large companies that paid no tax in Australia in that financial year. Collectively, their income was more than $500 billion.
Comparing FY16 to FY15, the ATO noted the following movements in tax paid by large corporations:
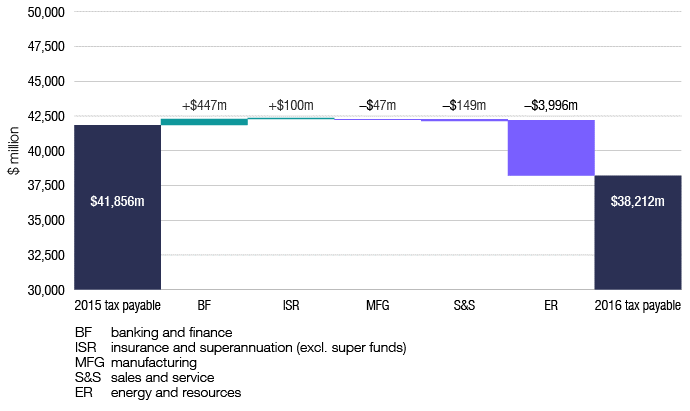
Figure 4. Change in tax payable, by industry segment, 2015–16
Compared to the previous year, there were reductions in tax payable for both Australian public entities (−$2.4 billion) and foreign-owned entities (−$1.3 billion). Australian private entities recorded a slight increase of $41 million in tax payable.
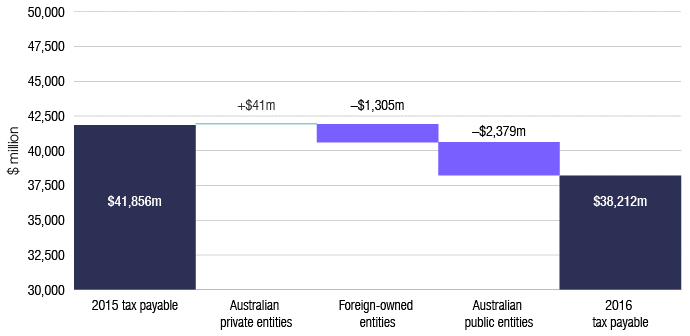
Figure 5. Change in tax payable, by ownership segment, 2015–16
The ATO noted that it is common that around 20–30% of ASX 500 companies report a current-year net loss to their shareholders in any given year. This figure appears to have stabilised at closer to 20% in more recent years.
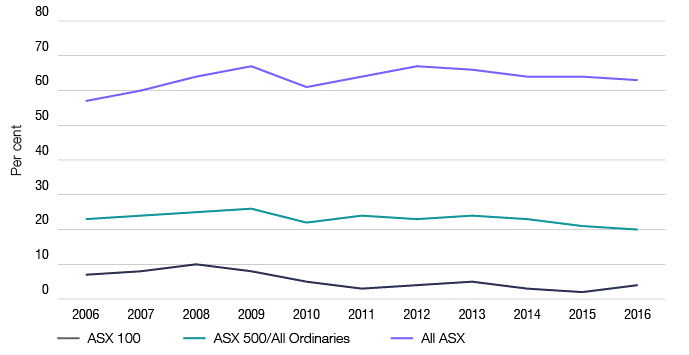
Figure 6. Proportion of companies with reported loss, by ASX population, 2005-2016
Of the 2,043 entities in scope for the 2015–16 transparency report, 64% paid tax; however, due to features of the tax system, the remainder did not.
At an entity level, the ATO saw the following features of tax payments -
219 entities reported a taxable income, but prior-year losses were available to deduct against that profit, so no tax was payable;
59 entities reported a taxable income but were also entitled to offsets (such as the research and development incentive) at least equal to the tax otherwise payable;
127 entities reported an accounting profit but reconciliation items (for example, tax deductions allowed at higher rates than accounting permits) resulted in a tax loss; and
327 entities reported an accounting loss.
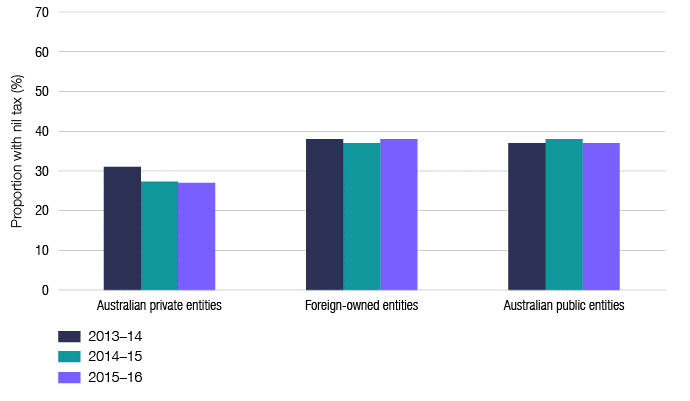
Figure 7. Proportion of corporate transparency report entities with nil tax payable, by ownership segment, 2013–14 to 2015–16
Nil tax payable by industry segment
The proportion of entities with nil tax payable differs across industry segments, with the energy and resources segment and manufacturing segment experiencing the highest rates in FY16. The remaining segments all experienced similar rates of entities with nil tax payable. There was a downward shift in the share of nil tax payable entities in the financial sector over the reported timeframe, and a marked increase for energy and resources.
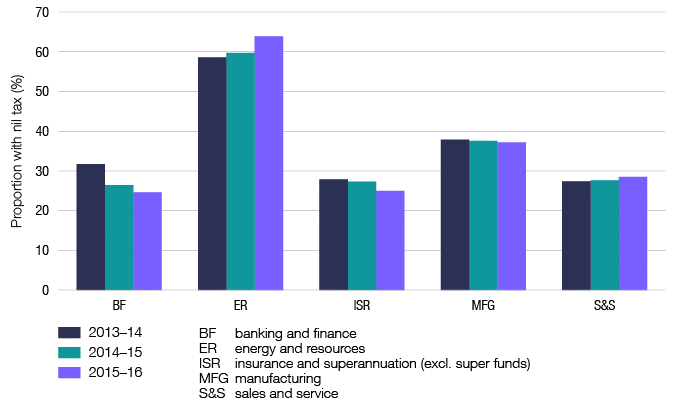
Figure 8. Proportion of corporate transparency report entities with nil tax payable, by industry segment, 2013–14 to 2015–16
Never miss an update
Enjoy this wire? Hit the ‘like’ button to let us know.
Stay up to date with my current content by
following me below and you’ll be notified every time I post a wire
The Clime Group is a respected and independent Australian Financial Services Company, which seeks to deliver excellent service and strong risk-adjusted total returns, closely aligned with the objectives of our clients.

1 topic
9 stocks mentioned
Clime Investment Management
Funds Management & Stock Research
Clime Investment Management
The Clime Group is a respected and independent Australian Financial Services Company, which seeks to deliver excellent service and strong risk-adjusted total returns, closely aligned with the objectives of our clients.
Expertise
Clime Investment Management
Funds Management & Stock Research
Clime Investment Management
The Clime Group is a respected and independent Australian Financial Services Company, which seeks to deliver excellent service and strong risk-adjusted total returns, closely aligned with the objectives of our clients.
Expertise
Comments
Comments
Sign In or Join Free to comment