The highs and lows of unemployment and wages

Chris Rands
Yarra Capital Management
The September employment report showed that the Australian unemployment rate has fallen to 5%, its lowest level since 2011. While this is undoubtedly a strong result, two labour market indicators raise questions over whether this will translate into higher wages.
1. The participation rate
The first is the decline in the unemployment rate during September was mostly driven by a decline in the participation rate, which is the percentage of the population currently employed or seeking employment. Currently the participation rate sits just below its all-time high and in many eyes this makes the pullback somewhat justified.
Chart 1: Australian participation rate
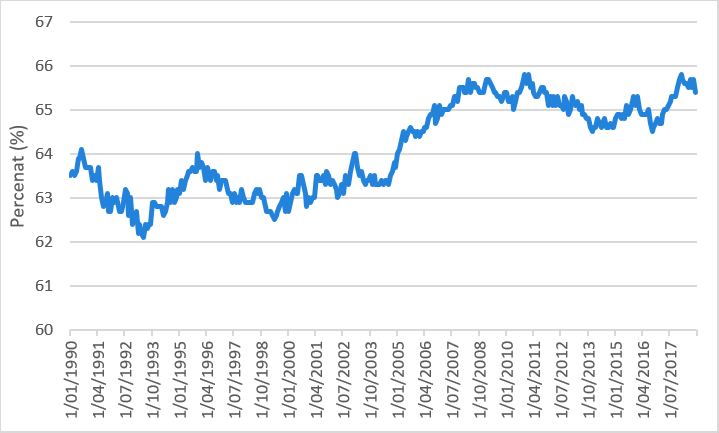
Source: Bloomberg
But the more significant question is what caused this change? A closer inspection of the participation rate over the past eight years shows that it seems to be reacting to the level of available employment opportunities. When the rolling 12-month sum of employment increases, so too does labour market participation. Hence this could be showing that the slower growth in employment opportunities is causing people to be less active in the labour market, counterintuitively pushing the unemployment rate lower.
Chart 2: Employment and participation
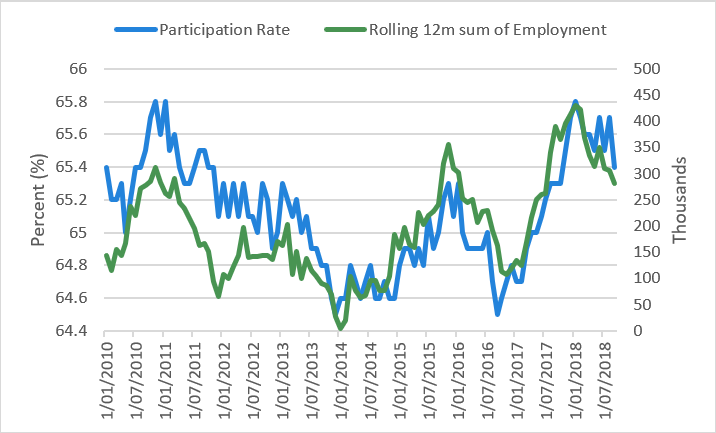
Source: Bloomberg
Furthermore one of the key drivers for this strength in the participation rate is that female participation has increased to over 60% in 2018, its highest level ever and an increase of almost 2% over the maximum level from 2008 to 2016. This occurred during a period of consistent declines in male participation, mostly due to baby boomer retirement.
Chart 3: Australian participation rate
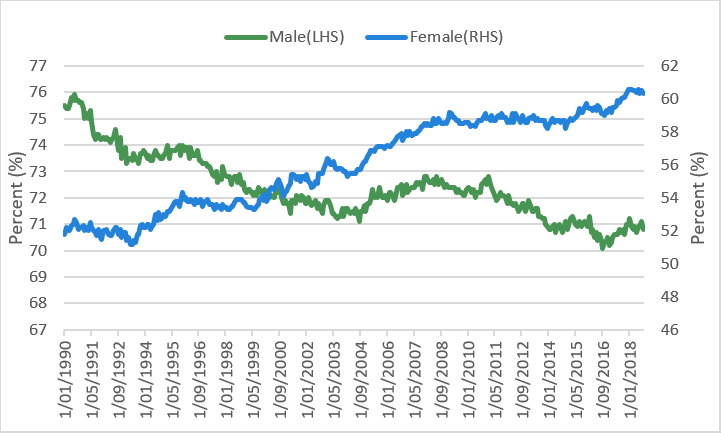
Source: Bloomberg
Over the past two years there has been very strong jobs growth in Health Care, Social Assistance, Education and Training — sectors traditionally associated with female employment. The two periods of strong job creation in these sectors (2015 and 2017) also delivered relatively large increases in female participation.
If these sectors continue to move sideways, as zero jobs have been created so far in 2018, female participation should also move lower. This means the unemployment rate can fall without creating new jobs, which is not necessarily a positive development for wages.
Chart 4: Female participation rate and job creation
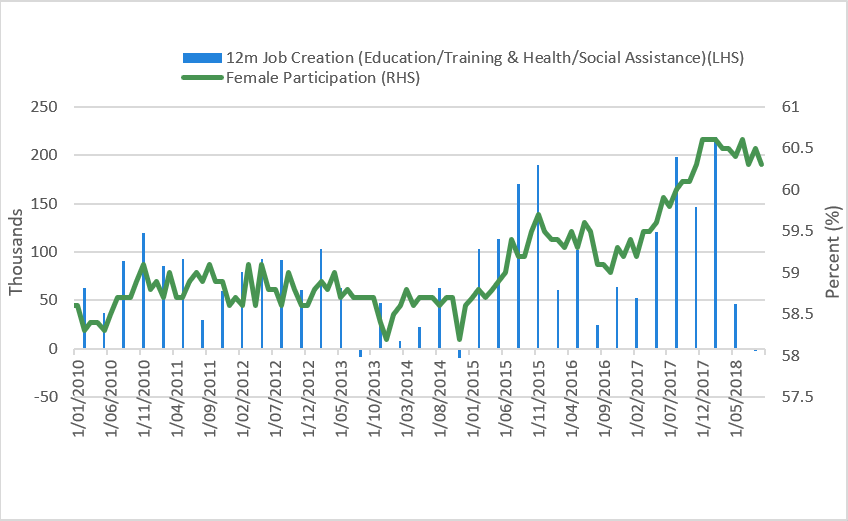
Source: Bloomberg
2. Underemployment in the economy
The second issue underneath the employment numbers is the high level of underemployment in the economy. Underemployment is defined as part-time workers who would prefer to work more hours, and full-time workers who did not work full-time hours for economic reasons. The underemployment rate in Australia currently sits at around 8.5%, an improvement on the 9% level reached in 2015/2016, but still over 1% higher than 2011.
From a wages perspective this creates a diverging outlook compared to the usual unemployment/wage growth connection. Traditionally a low headline unemployment rate is thought to reflect labour becoming scarce, causing employers to bid up wages to attract employees.
Chart 5: Underemployment rate and wages growth
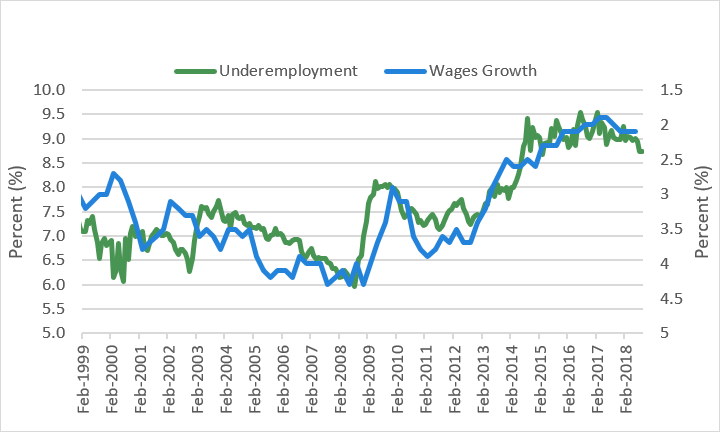
Source: Australian Bureau of Statistics, Bloomberg
The complication here that a high underemployment ratio is telling us that workers would work more hours if given the chance. As the above chart shows, the timing of weak wages in Australia coincides with high levels of underemployment.
The result of this is that while the unemployment rate has improved to its lowest level in seven years — a strong sign for the Australian economy — the RBA will likely need to wait for continued strength in the labour market before any wage pressures arise in the economy. This is because the falling participation rate may be reflecting slower jobs growth rather than a general scarcity of labour, and there is still a large number of people willing to work additional hours if given the opportunity.
Traditionally when the unemployment rate is falling the RBA is getting ready to hike rates, and the last time the unemployment rate fell this low the cash rate rose to well over 4%.
Chart 6: Underemployment rate and cash rate changes
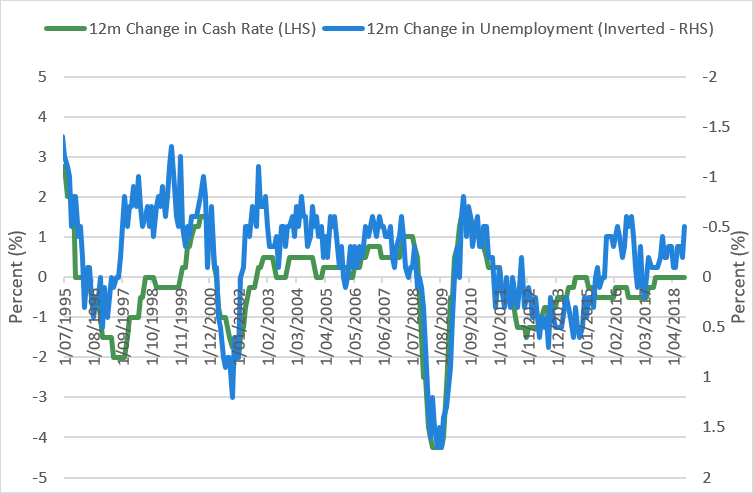
Source: Bloomberg
Conclusion
For the next 12 months the RBA will most likely continue to bide their time to ensure that the recovery in the labour market is occurring at more than just the headline rate. While the headline unemployment rate is pointing to labour scarcity, which should drive wages higher, a broader perspective of employment indicators shows that this still could take some time to materialise. Without wages growth there are few reasons to expect underlying inflation to accelerate, which will keep the RBA on hold despite the record 25 months of no movements at historically low levels.
Further insights
For additional analysis and insights from the team at NIkko Asset Management, please visit our website
Never miss an update
Enjoy this wire? Hit the ‘like’ button to let us know.
Stay up to date with my current content by
following me below and you’ll be notified every time I post a wire
Chris is responsible for portfolio management, including portfolio construction and trading for various Australian fixed income portfolios including the Nikko AM Australian Bond Fund at Yarra Capital Management (Nikko AM was acquired by Yarra Capital Management in April 2021). Chris has over 9 years of experience in the fixed income market. He is also co-host of the popular Australian podcast series The Rate Debate.

Chris Rands
Co-Portfolio Manager, Fixed Income
Yarra Capital Management
Chris is responsible for portfolio management, including portfolio construction and trading for various Australian fixed income portfolios including the Nikko AM Australian Bond Fund at Yarra Capital Management (Nikko AM was acquired by Yarra...
Expertise
Comments
Comments
Sign In or Join Free to comment