The Housing Correction We Have to Have
Over recent weeks, we have highlighted that there are two main international macro events that will need to be closely monitored over the coming months. Each could impact the performance of investment markets in 2019.
The first is the tariff battle between the US and China. As this is likely to unfold through the US midterm elections (held on 6 November), it now has the appearance of being primarily driven by the political imperatives of the US President. A concurrent driver (more openly promoted by the President) is the economic imperative to bring China into line (IP protection) and to slow its growth to the benefit of US manufacturing.
However, the second driver struggles to pass economic scrutiny, because the transfer of manufacturing back to the US, by utilising trade walls, would take many years to transpire (if ever). In the meantime, there is the heightened risk that a surge in inflation driven by tariffs could derail the monetary policy settings of the US Federal Reserve (the Fed).
The other event that is now moving the price of US bonds is the burgeoning US fiscal deficit and growing US government debt pile. The projected US 2019 fiscal deficit (October balance) is now over US$1 trillion or 5% of US GDP. With this projected blow-out comes the forecast that US government debt will lift above US$22 trillion over the next 12 months. The US ten-year bond yield has now pushed above 3% again (3.09% today) and there is a heightened risk that the US bond market could suffer a severe correction – sooner rather than later!
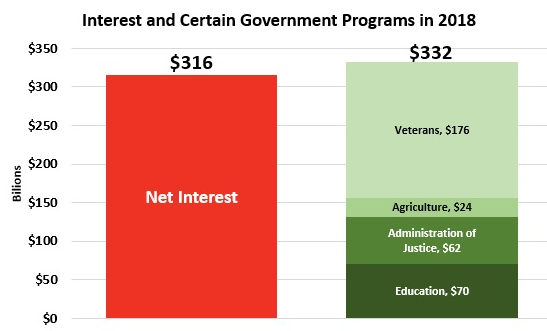
Looking at the US budget forecasts, we estimate that the weighted average interest rate paid on US government debt (bonds) is about 1.5%. This estimate is based on the $316 billion of projected interest (on circa US$20 trillion of debt) that is to be expensed through the US government budget of 2018. This interest bill will represent a significant 40% of this year’s massive US deficit of US$750 billion.
Given that inflation is one of the key determinants of the yield on a government bond, Trump’s tariff and tax policies could undermine the Fed’s monetary policy by significantly increasing the US fiscal deficit. At this point in the cycle, the Trump fiscal stimulus is unnecessary given the growth in the US economy. His tax cuts will create a major headache for the Fed which is intent on methodically adjusting cash rates into a stable growth outlook. The next rate increase by the Fed is expected in Washington later today (Wednesday), to be followed by another increase in December. They are now confronted by a heightened risk of inflation.
The broad effects of a full-blown trade disagreement leading to increasing tariffs can be summarised as follows. If the US ultimately imposes 25% tariffs on all of China’s US$0.5 trillion in exports to the US, then about US$125 billion of tariffs could be imposed assuming volumes don’t decline. The bulk of this cost will be borne by US consumers and feed directly into inflation. While $125 billion of tariffs could improve the projected fiscal deficit by about 12%, the effect would be to push inflation up by around 0.75% per annum (i.e. US$125 billion on US$15 trillion of consumption).
With higher inflation, the cost of US debt would rise (higher bond yields) and the benefits of higher tariff collections would ultimately be consumed by higher interest costs flowing through the US budget. Ten years of ultra-accommodative monetary policy management by the Fed would be debased and the interaction between monetary and fiscal policy would need to be reset.
Since the GFC, the desired outcome of US monetary policy has been to stimulate growth whilst holding inflation and the cost of debt in check. This was important as the US government had been left with a massive debt load following the bailout of the US banking system and the 2008/09 recession. Trump is, therefore, upsetting this grand plan and his fiscal policy is at odds with monetary policy. Further, the hope that US manufacturers will react quickly and replace Chinese imports is a faint one and ill-conceived.
Importantly for Australia, the Trump policies will likely result in a sharp rise in US interest rates and the cost of funds to Australian banks. That is not good news given that the RBA is working through our own debt problems.
Our home-grown issue – mortgage stress
Australia is not good at setting outcome-based objectives across a range of important national policies. Therefore, it is not surprising that in 2018 we, as a nation, are confronted by problems that emanate from excessively priced residential property – because we never had a national housing policy.
Thus, while the two macro issues (noted above) are significant for world investment markets, Australia has its own problems relating to excessive household debt and excessive residential property prices. The international macro issues above, if they lead to heightened inflation and interest rates, will hurt Australian households that have too much debt, and will stress Australian banks should the value of residential property fall quicker and further than expected.
We reiterate that this heightened risk has developed because Australia does not have a policy that can be measured against a desired social outcome. A good aspiration for housing would be a policy framework that is focused upon “delivering housing that is affordable to both today’s and future generations”.
Thus, without that focus on a desirable outcome, there has been no requirement for the government or its regulators to act to check the growth in housing prices; the creation of a highly unaffordable property market is the result.
We have written before that the success of a country’s economic policy is not measured by the rising price of its housing stock. But here in Australia, rising house prices have been applauded as a measure of “economic success” when really they were the result of “economic excess”.
More disturbing has been the scant regard for the sustainability of the economic system. Of all the consumable things that drive up the cost of living for average people, it is the price of housing, whether through purchase or rent, that is the most significant. Thus, if housing becomes expensive, then wages will have to rise in response. High house prices mean that high living costs become embedded in the economic system and this stresses all average households – whether they be young families or older people seeking to secure their retirement. Australia has become a very expensive place to live and no one seems to question why this should be so.
In the following charts, we will put some context into the “heated” discussion concerning residential property prices. Our conclusion is that house prices in SE Australia will drift lower for a while; it is important to maintain confidence in this market to ensure prices don’t correct too sharply.
The first chart shows the explosive growth in household mortgage debt that has occurred since the last Australian recession (in 1992). Even the GFC of 2008/09 could not stop the growth in mortgage debt measured against GDP.
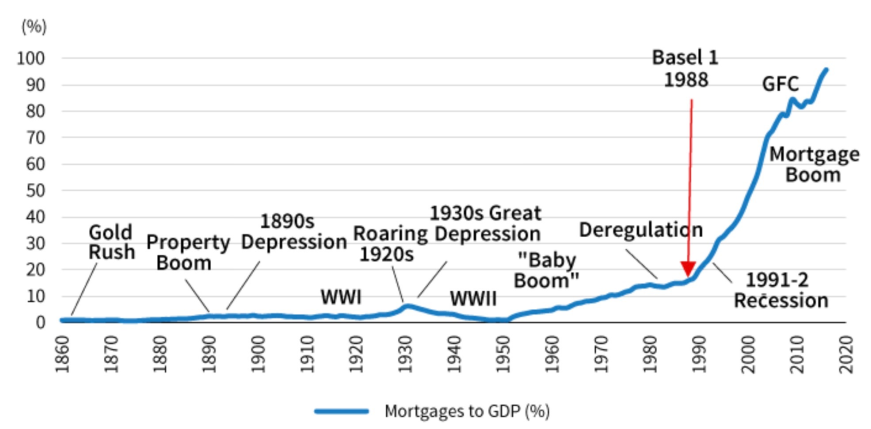
Figure 2. Australian Mortgage Debt to GDP
Source. RBA, UBS estimates
To be fair, we acknowledge that Australia’s population growth has been strong and supported the demand for housing stock. As the following chart shows, Australia’s population growth greatly exceeds that of our peer group inside the G12, and a significant portion of this has been generated by immigration. However, our immigration policy (like our housing policy) has not been outcome based. There is no measure of success other than we have more people.
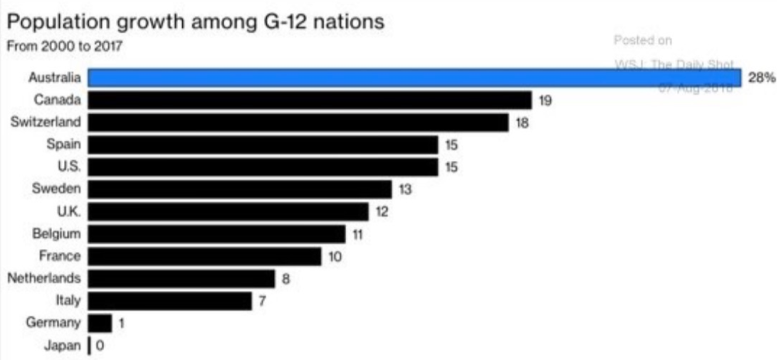
Figure 3. G12 Population Growth
Source. World Bank, Bloomberg
The next chart shows that we have the highest house so-called “ownership ratio” overall (note it does not adjust for debt), and we also have the highest debt ratio for countries which do not allow the tax deductibility of interest on residential mortgages. Leverage is very high across a range of Scandinavian countries where households get the benefit of tax deductibility of interest.
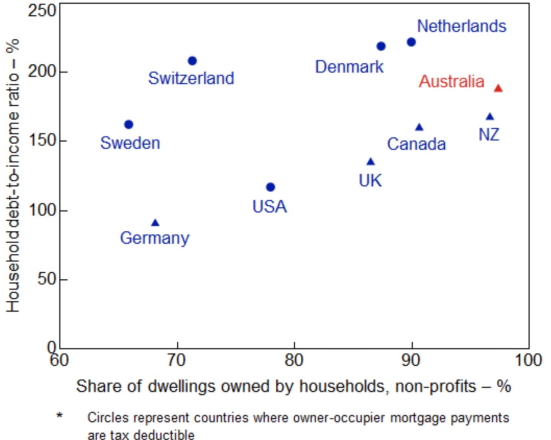
Figure 4. Household debt and ownership - available advanced economies
Source. national agencies; RBA
The deductibility of mortgage interest is not available in Australia, however, interest deductions on negatively geared investment property do exist. Is there any logic to this?
Australia has maintained tax-free capital gains on residences, and thus ensured that the family home is a significant savings asset for most Australians. Indeed, most Australians will retire with much more equity in their homes than they will have in their superannuation. Our housing policy needs to be combined with our national pension policy – but there is no sign that this will occur anytime soon.
The proliferation of household debt has been intermediated or created by the Australian financial system. Australian banks are champions in creating household debt and have created a massive exposure for themselves to mortgages – more so than any other banking system across the world.
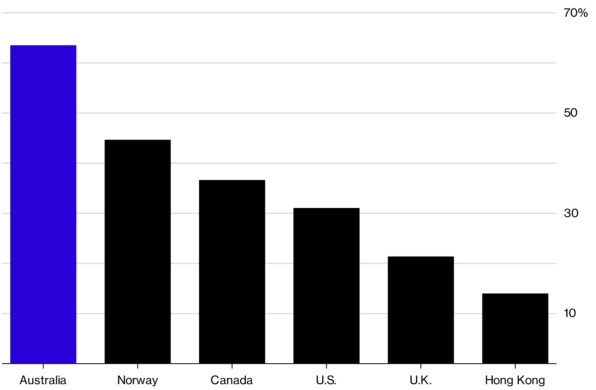
Figure 5. Residential property lending as a proportion of total loan book - as at 4Q 2016 (3Q latest available for UK)
Source. IMF, Bloomberg
The excessive size of our housing market is captured in the next chart that shows the debt and price boom that has continued since the GFC. Both Australia and New Zealand have witnessed growth in housing stock – volume and price – far more than that seen anywhere else.
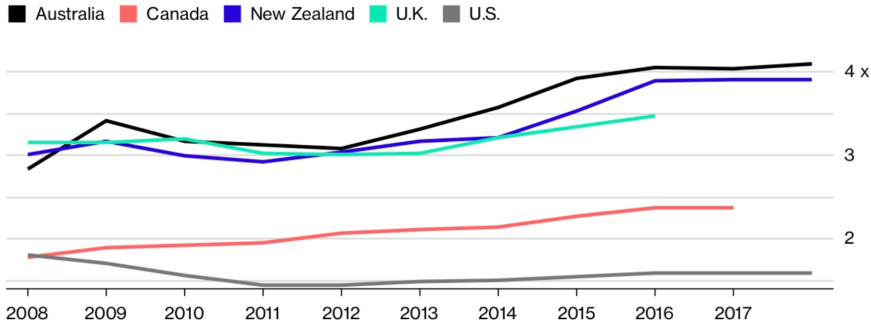
Figure 6. Value of residential housing stock/GDP (using last available data for housing stock)
Source. Bloomberg
Growth in the value of housing stock of $2.5 trillion (or 60%) since 2012 has been four times greater than the growth in the Australian economy. Unfortunately, it has been driven by access to cheap credit, and we now know (from APRA and the Royal Commission) that the banks’ credit processes have been corrupted by commission-based sales incentives.
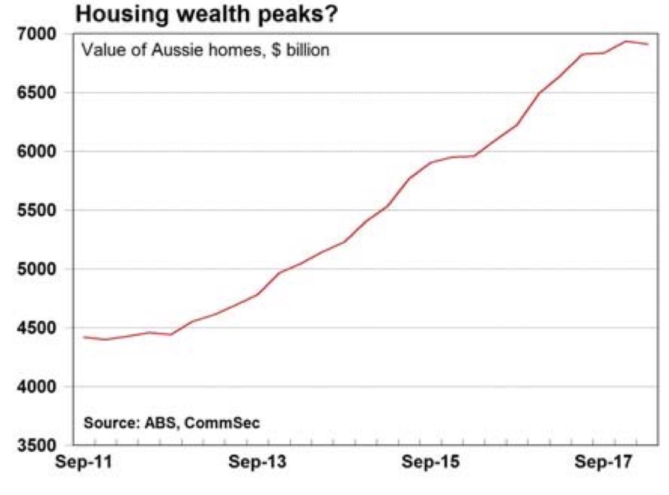
Figure 7. Value of Australian homes, $ billion
Source. ABS, Commsec
The extent of household leverage and the resultant surge in residential property prices are connected.
With the cost of debt-driven lower around the world in response to the financial fallout of the GFC, Australian borrowers directly benefited. Australian banks were happy to oblige and utilise low wholesale funding. Further, they were particularly keen to lend against residential property – more so than any other asset class. Meanwhile, the regulators were asleep as the debt build-up grew at an alarming rate and interest-only loans grew as housing prices rocketed.
The lack of a national housing policy meant there was no check on the growth in housing prices and the regulators were forced to move under the pressure of cries by the community – housing has become too expensive!
More recently, the tightening of credit availability by the banks to the residential market was due to APRA’s direction. In a recent letter to all authorised deposit lending institutions, APRA indicated that lenders need to limit lending at the very high debt to income levels – i.e. where debt is greater than 6 times a borrower’s income.
The next chart highlights the effect that this directive will have on the ability of households (based on income levels) to access mortgage debt. It is quite dramatic for low-income families.
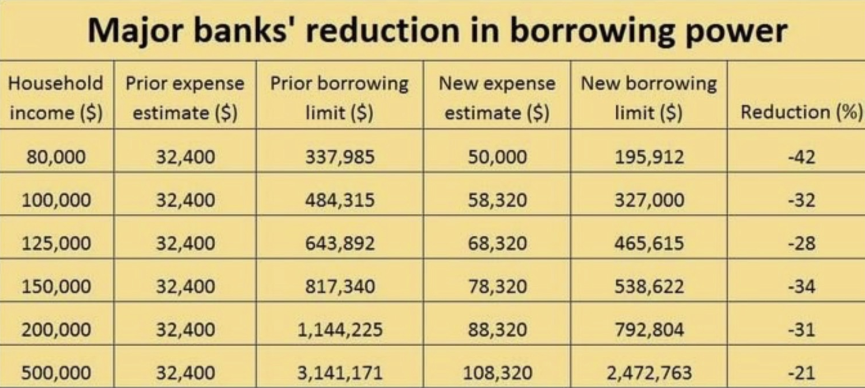
Figure 8. Implications of tightening lending standards
This directive from APRA follows three years of stronger oversight of bank capital ratios. The increased requirement for capital, by requiring higher capital ratios, had already affected mortgage debt growth – but not by enough.
The next chart shows that debt has continued to grow in this period of low interest rates. Scheduled and unscheduled repayments of principal declined for a period because the banks moved more aggressively into interest-only loans. This was slowed by APRA’s edict in 2017.
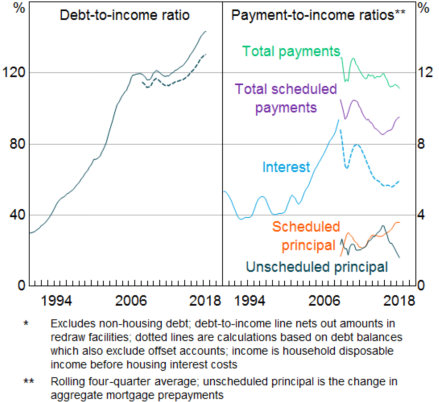
Figure 9. Household Mortgage Debt Indicators
Source. ABS; APRA; RBA
The creation of interest-only loans was excessive in 2014/15, but this continued through to 2017. Of course, with no national housing policy, no one questioned why “interest only loans” were needed in Australia. But then again, no one questions why households need 50 months interest-free to buy a TV set!
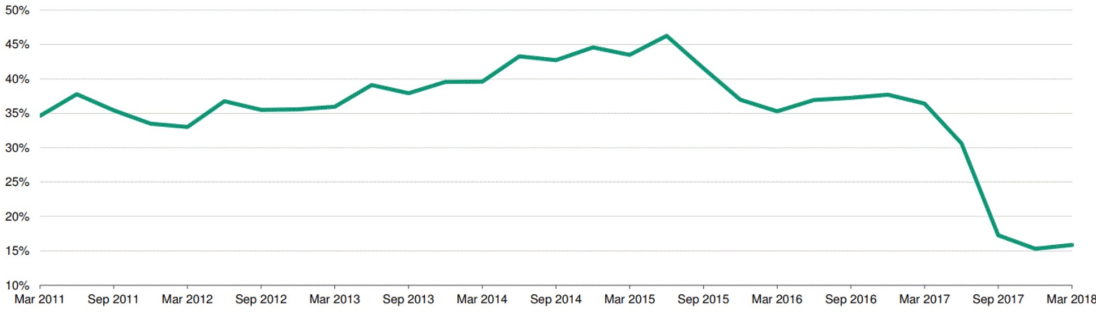 Figure 10. Interest-only loans originated by banks as % of total mortgage originations
Source. APRA
The interest-only loans written earlier this decade will progressively convert to “principal and interest” loans. This will lead to an increase in the “past 90 days due” or delinquency rate for housing loans.
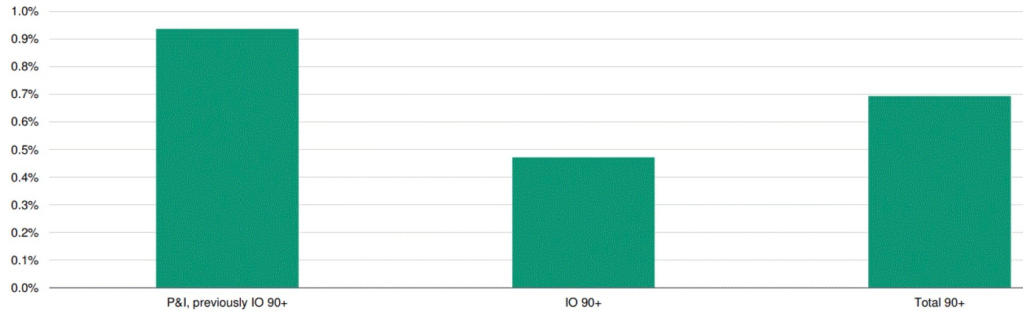 Figure 11. Delinquency rate for mortgages that converted to principle + interest vs interest-only
Source. Moody's Investors Service
Mortgage delinquencies will increase over the next 2 years as a record number of interest-only mortgages (2014 and 2015 vintage) convert to P and I loans. Further, simply refinancing interest only loans will become increasingly difficult as banks force highly geared borrowers (measured by income to debt ratios) out of their loan books.
In terms of residential-backed securities, it is good and bad news. Historic RMBS created from 2014 and 2015 loan books will see some stress. However, loan books written from mid-2017 will see a dramatic improvement in loan quality. Better regulation, even if belated, will see the quality of loan books increase.
Another issue developing in the mortgage market is revealed by the next chart. Here we see that older householders are taking on more debt. This seems to be the result of a range of factors that include the drawing of equity from houses by older citizens, the rise in property prices catching older households wrongfooted and the temptation (because of tax) to invest in negatively geared property as a retirement strategy.
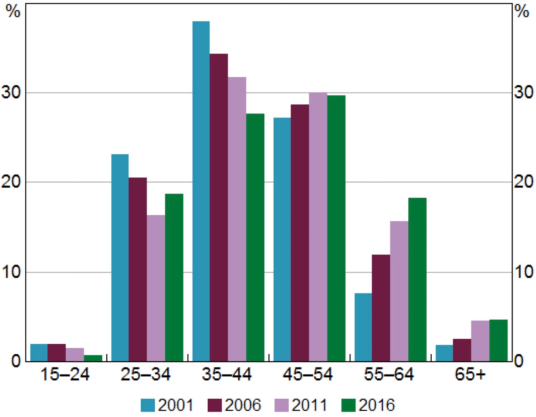
Figure 12. Age distribution of indebted owner occupiers
Source. HILDA Survey Release 16.0; RBA
However, the investment strategy to utilise negatively (or positively) geared residential property as a retirement asset class is now been tested by the long overdue correction. While it is not yet a “slump” it is the correction we had to have, and the size and duration of the price downturn will be determined more by international macro events than many commentators suspect.
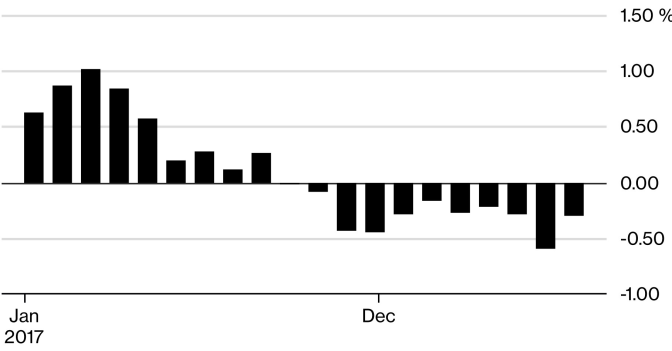
Figure 13. Australian housing price downturn
Source. CoreLogic Hedonic Home Value Index
Never miss an update
Enjoy this wire? Hit the ‘like’ button to let us know.
Stay up to date with my current content by
following me below and you’ll be notified every time I post a wire
John has 35 years experience in funds management and corporate advisory services. Prior to establishing Clime, John’s roles included ten years at NRMA Investments as the head of equities.
Clime is a management and advisory business for mainly SMSFs.

7 topics

John has 35 years experience in funds management and corporate advisory services. Prior to establishing Clime, John’s roles included ten years at NRMA Investments as the head of equities. Clime is a management and advisory business for mainly SMSFs.
John has 35 years experience in funds management and corporate advisory services. Prior to establishing Clime, John’s roles included ten years at NRMA Investments as the head of equities. Clime is a management and advisory business for mainly SMSFs.
Comments
Comments
Sign In or Join Free to comment
most popular
Investment Theme
If 24 LICs ran the Melbourne Cup, which ones would we back?
Affluence Funds Management