LWE - 17th Apr, 2021
A new era in financial markets
After one of the longest periods of underperformance in history, governments and central banks' response to the COVID-19 crisis may well have ushered in a new era for value investors, says Dr Philipp Hofflin from Lazard Asset Management. Drawing on nearly 200 years of data, Hofflin has looked at past periods of value outperformance to see what common factors they share. And many of them look strikingly similar to today.
"Today, around the world, one in every five dollars was created since March 2020. By the middle of this year, we'll get to one in four. And that has consequences."
In this in-depth video, Hofflin explains the reflation trade and the drivers behind it, shares some relevant lessons from history and how they apply to today, and tells us how he's positioned his portfolio to benefit from this idea.
Edited transcript
What is reflation and why does it matter?
Over the last sort of 10-20 years, we've had new data become available. We've all been aware that we used to have data sets from Kenneth French since 1926 for the US stock market. But various researchers, led by Professor Gottesman at Yale, have pushed that back to 1826, a long way. They've gone through the NYSE records, prices and dividends. Because we have dividends, we can construct style returns. So we can see during which episodes in the past did high dividend yield value stocks do better or worse than low dividend yield growth stocks.
What comes out of it is that the outperformance of value, that we knew was there since 1926, has been going on for almost 200 years. It's almost a straight line, if you look at it on a log chart, 56,000%, I think it is now, but more informatively, about 3% per annum, over that time.
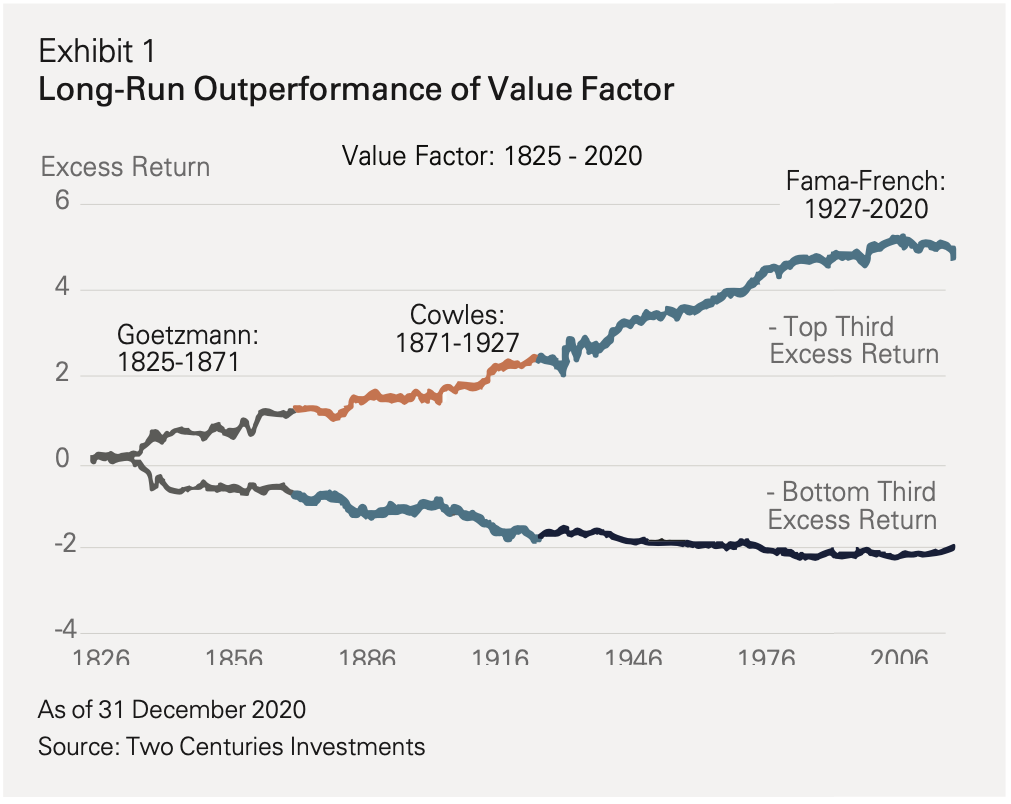

What it has also shown, though, is that big drawdowns are actually much more common than we might have thought, given the history that we had up to now. So in some ways, that post-Second World War period of economic stability and prosperity was probably a little bit unusual, when you see it in the longer term context. The returns are not as consistent in that sense as you might have expected. 90% of the time, value was in some sort of drawdown, despite the fact that it ended up 560 times higher by the end of the period.

A third feature that we've noted is that value drawdowns tend to follow a financial crisis. That happened with the 1841 drawdown, which followed the 1837 crisis, and the 1862 drawdown, which followed the 1857 crisis. The long drawdown that peaked in 1904 was of that category as well. And of course, we all remember, that the last big drawdowns for value were in the 1930s, which followed the Wall Street crash and the Great Depression. Of course, now we have the current episode, which followed the GFC. That's an interesting new observation, although even now, the data isn't enough to be really categorical about it, obviously.
Lastly, I thought I'd like to talk about the longest drawdown, and the deepest of them all. Because, as you know, until late 2020, value stocks had underperformed for something like 12-13 years in the US, and it'd been really quite severe. Well, this has happened before, and it happened from 1890 to 1904, a 14-year period. I just want to describe what happened then, and you can, in your own mind, tick off the analogies with today.
It happened because there was a financial upset, before that there was a debt overhang. There was widespread deflation in the US, because the US was on the gold standard, and they couldn't increase the gold supply, despite the fact the economy was growing quite strongly. There was deflation, which put a lot of pressure on people with debt. The small farmers and the workers did badly, there was rising inequality, and rising social tension. And there were two actors that were on the scene, who were the main protagonists, politically.
One was William Jennings Bryan, who represented the little man and the small farmer. He became the Presidential nominee in 1896. He gave the famous "Cross of Gold" speech at the Democratic Convention, which you'll still see referred to sometimes by people who study monetary theory. He was up against McKinley, who was a very aloof character. He represented the monied interests of the East Coast banks, who wanted to stay with gold, while Bryan said, "We should allow silver." This is called the bimetallic question. If you're a fan of the Wizard of Oz, the story has various references to this debate in the story, if you know where to find them.
In the 1896 election, Bryan lost, McKinley won. They re-contested that in 1900, and again, with the same outcome, and McKinley won. So the process was allowed to run. There was deflation, there was pressure on people, there was rising in equality. There's also the rise of various industrial monopolies that McKinley didn't do anything about, Northern Trust Railway, Carnegie's US Steel, Rockefeller's Standard Oil.
But McKinley was assassinated in his second term. And his vice was Teddy Roosevelt. Teddy Roosevelt then won his own election in 1904, and that was the third Republican win. But while the Democrats kept on losing the election, they won the debate. And when Teddy Roosevelt came to office on his own terms, he took anti-trust action. He had much more progressive policies.
And it's around about the same time, the South African (gold) mines that had been discovered in the late 19th century around Witwatersrand, were really ramping up production. Interest rates, which had fallen to 100-year lows, started to recover. There was reflation, to use that term again. The underperformance for value, which had reached which 60% over 14 years, so it was very painful, ended then.
Over the next four years, value rallied 140%, and the old era was swept away, and replaced by the new.
The various analogies are fairly obvious to what we have today, in terms of rising inequality, some monopolies that dominate the stock market. Now we've had the election of president Biden. Clearly, the prospect for more redistribution, for more progressive policies, for perhaps, antitrust actions, seems much higher.
Why is now the point of inflection?
The first thing I'd say is, we can't be sure we're at the point of infection, but I think the probability that we are is much higher, and the markets are telling us that. The reason for that, is that up to now, the central banks instituted Quantitative Easing (QE). That is in the increase of base money, which ended up as excess reserves by the commercial banks, with the central bank. It never flowed out into the wider economy, which is why broad money didn't increase very much at all. In Japan, for example, they did a lot of QE, increased money base a lot, but it never went into broad money.
This is not QE, this is Modern Monetary Theory (MMT) happening today.
It is fiscal and monetary working together. It's monetization of deficits. This time, it is cheques with households. The money is now in the community. So in that sense, this is not QE, which was really for Wall Street and the banks. This is for Main Street.
The differences are quite stark, and the quantum is very large. The US ran a deficit of 15% of GDP in 2020, and it seems like it may even be larger in 2021. So it's not changing. There is not much move to austerity, as it's now called, in the US. The deficit is very large, and by the end of 2020, broad money in the US was up about 25%. If you look at the chart from the long run, it's like a hockey stick. We haven't seen that, pretty much ever. By the middle of this year, I think we will have got to over 30% from the start of COVID.

What that means is that today already, around the world, one in every $5 in circulation was created since March 2020. By the middle of this year, we'll get to one in four. And that has consequences. That is a lot of new money. So, in that sense, this is different to the old QE, and this is why it may be a turning point, and perhaps also why things like the break-evens in the bond market are telling us that they are pricing a different future inflation rate than they were six months ago.
How sustainable is this rally?
If you look at past cycles, and how long they run… To put that into context in the US, the drawdown has run for 12 years, and it was quite extreme. In that sense, history suggests that this is a multi-year event, if it does unfold. We are now two quarters into it, so perhaps it's too early to count our chickens.
But if there is reflation, if the environment has changed, it will take a fair while, because there is some extraordinary pricing on the other side. There's a lot of air to be let out of a bubble on the other side. So, I would expect it to go for much longer.
In a worst-case scenario, if there was inflation, it would probably happen in an almighty hurry, in the context of very rapid falls in the market overall.
I don't think it would make any difference to the long run outcome, whether it's fast or slow. But that is one thing that could accelerate it, if there’s an actual rise in inflation.
How are you positioned to benefit from this rotation?
In the past, we've been known as being very wary of banks. They peaked with very high valuations in 2015, and then they underperformed almost continually, five and a half years running. They got to really quite good valuations in the second half of 2020.
We achieved the remarkable feat of being 26% underweight banks in 2015. Astonishing that you could even do it, but that was completely wiped out by the end of the end of 2020. We bought into the four non-CommBank major banks. The reason was mainly the valuation, from very optimistic expectations that become very pessimistic. They were trading at book value. In that sense, the decision was fairly simple, based on valuation.
Now the environment is clearly turning out to be yet better than we think, almost month by month. And clearly, there is still some good news in the banks. The multiple revision has really mostly happened. I think that train has left. But there's a bit of upside if interest rates do eventually rise. There will be some restoration for the net interest margin. And if we do get reflation, then you can also sustain higher long run credit growth rates, because nominal GDP's faster, both of which will clearly help.
To get back to the earlier discussion about secular stagnation, reflation, inflation, those three scenarios have very different outcomes for the banks. I spoke about the fact that reflation's much better than secular stagnation. Inflation is much worse. If there was a serious outbreak of inflation, the central banks would have to raise rates, and more or less deliberately crash the economy, in order to overcome those inflationary forces. So it's very important to watch that carefully.
At the moment, I think the banks have very clear air ahead of them. House prices are fine, rates are low. We already know about the margin pressures. They can write some of the provisions they took in 2020 back through the credit line. So at the moment, the outlook is good, but we'll be watching it very carefully, and if they continue to rally, I expect we'll be selling them over 2021.
How do the Big 4 banks stack up against each other?
It's reasonably simple. Westpac and ANZ are the most attractive. There's not that much science, beyond the multiples being clearly lower. NAB in the middle. CommBank looks quite expensive.
CommBank is on 20 times forward earnings, which, for banks, is an astonishing number. It's one of the most expensive banks in the developed world based on multiples. We believe that Commonwealth Bank should trade on a small PE premium to the peers, and quite a significant price to book premium implied by that, to the peers. But the current premium seems extraordinary.
What’s your view on property today?
We were very concerned in 2017, when there was a very strong boom. We remained concerned in '18, as prices started to fall. We were rescued by the outcome of the unexpected election in '19.
The biggest risks come when a market goes from a boom mentality to a bust mentality really quickly. If it happens very slowly, and people have time to adjust, and the loans season, that takes a lot of the risk out.
But the start of this year, you could look back and prices in Australia hadn't gone up for three years. They'd gone sideways a bit, down and up a bit, but they hadn't gone up dramatically. It was very clear that anybody who was overly geared, and perhaps really extended, would have taken corrective action in 2018-2019. So a fair bit of the risk probably came out.
On the bank side, the lending standards have improved, after the spotlight that was on them. So a lot of the issues that were current, and could have turned acute in 2017, 2018 and 2019, were much older.
Now, of course, we have a lot of household support, very low interest rates. I think, for the next year, the question is only about how much do prices rise, and will macroprudential tools again, be necessary to stop the rise? This doesn't mean that the debt problem has gone away. And if the world went from reflation to inflation, it clearly would be an enormous problem.
Do you expect those macroprudential tools to be used in the next year?
In New Zealand, they already have. Auckland prices was shooting up, so the RBNZ has already done that. The RBA gets asked the question a lot at their meetings, and in speeches to the public. And so far, they have said that they're monitoring, but they're quite happy.
I suspect that those people who say that prices will be very strong are probably right, because not only are interest rates very low, but there's a lot of cash from the stimulus, both here and in the US, that is still sitting with households. That will start to get deployed over 2021. But it's also reason for expecting that the inflation pressures may not disappear very quickly.
I think house prices may turn out to be very strong in 2021. And I would expect the central bank to take action on that, because the last thing we want is yet higher prices, and yet more debt, because if rates ever have to go up, it is obviously a problem.
I think it's a very sensible way of doing it. They may target things like higher LVR lending, high debt to income lending, and so forth. It's a much finer tool to use to stop developments in a particular market, rather than raising rates, which is a very blunt tool.
Learn more
You can stay up to date with all of Philipp's latest insights by following him here.
Never miss an update
Enjoy this wire? Hit the ‘like’ button to let us know.
Stay up to date with my current content by
following me below and you’ll be notified every time I post a wire
Livewire Exclusive brings you exclusive content from a wide range of leading fund managers and investment professionals.
........
Livewire gives readers access to information and educational content provided by financial services professionals and companies ("Livewire Contributors"). Livewire does not operate under an Australian financial services licence and relies on the exemption available under section 911A(2)(eb) of the Corporations Act 2001 (Cth) in respect of any advice given. Any advice on this site is general in nature and does not take into consideration your objectives, financial situation or needs. Before making a decision please consider these and any relevant Product Disclosure Statement. Livewire has commercial relationships with some Livewire Contributors.
3 topics
4 stocks mentioned
2 contributors mentioned
Livewire Markets
Livewire Exclusive brings you exclusive content from a wide range of leading fund managers and investment professionals.
Expertise
Livewire Markets
Livewire Exclusive brings you exclusive content from a wide range of leading fund managers and investment professionals.
Expertise
Comments
Comments
Sign In or Join Free to comment