Australia: A canary in the coal mine
Structurally, Australia’s growth model has been deteriorating for most of the past two decades and is now arguably one of the poorer examples in the developed world. In the years of the last commodity bull cycle, instead of saving in its ‘times of plenty’, Australia funded a large consumption and housing boom on the back of a growing current account deficit and a sharp rise in household debt.
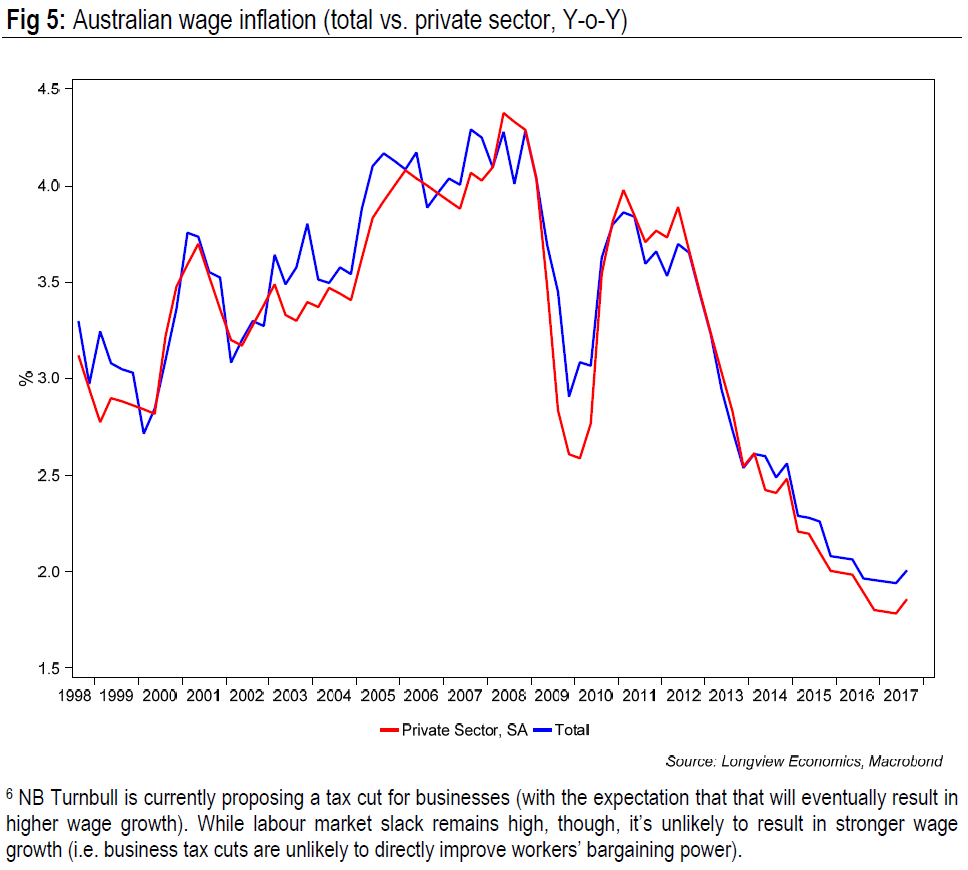
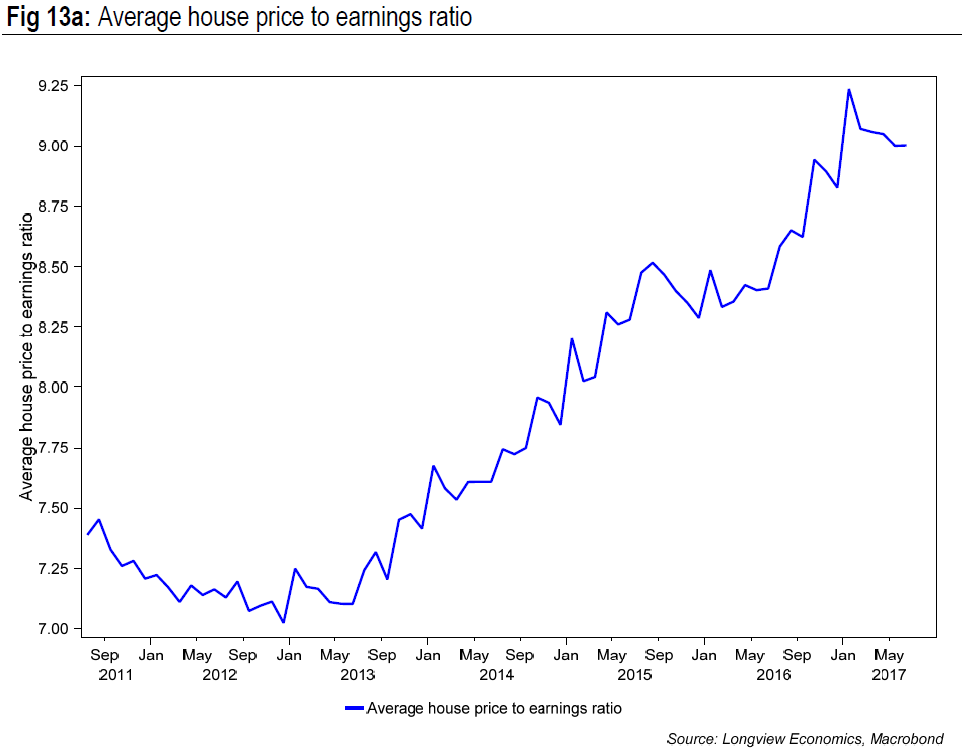
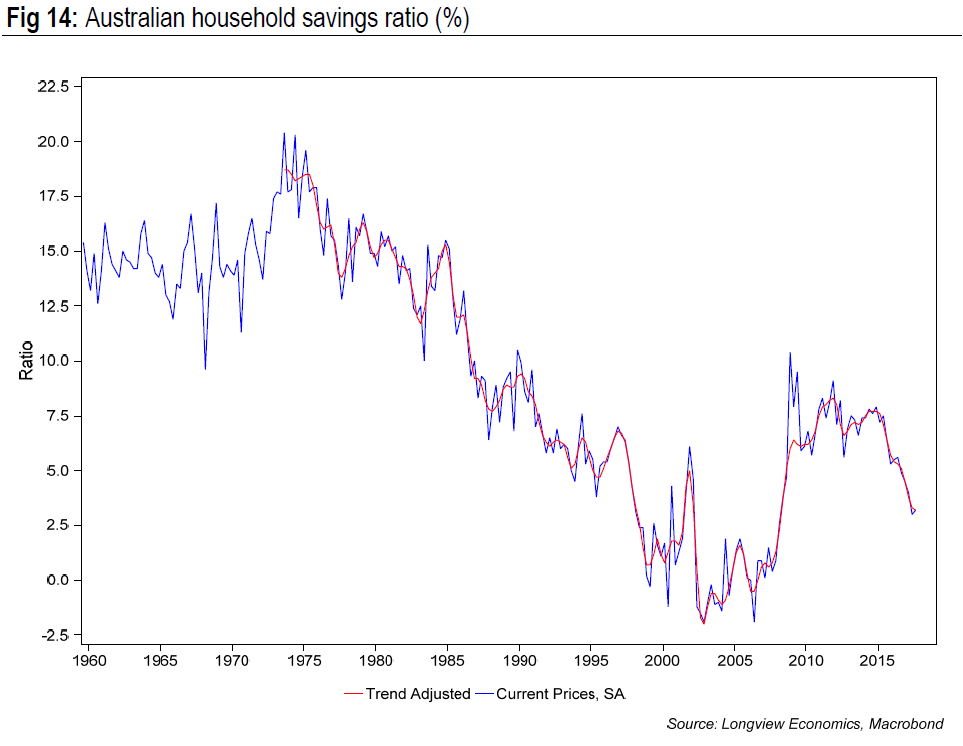
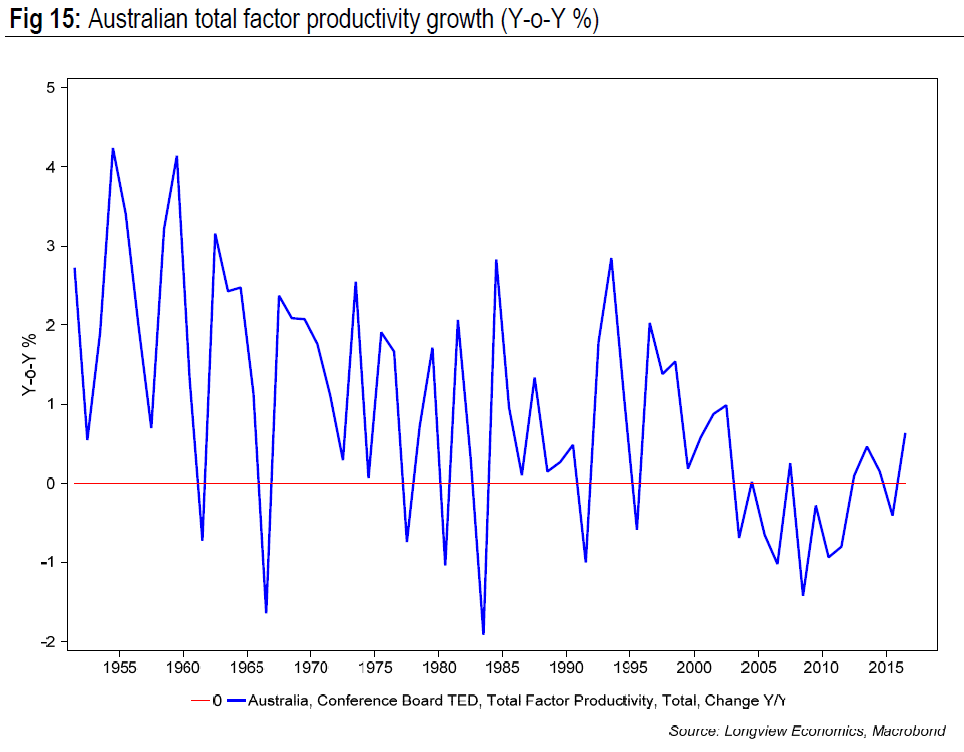
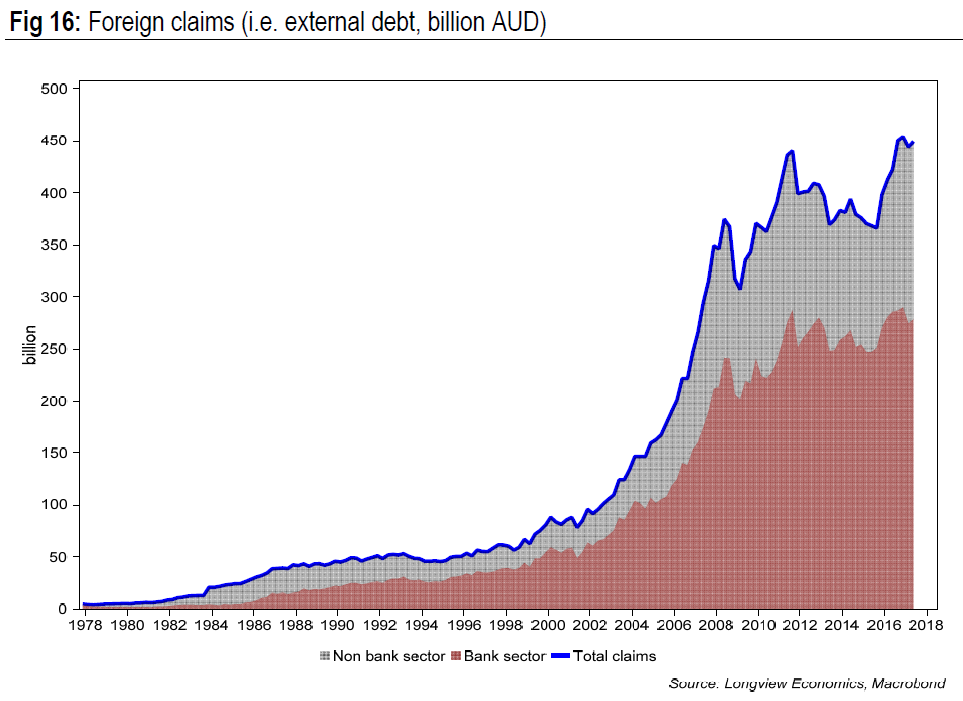
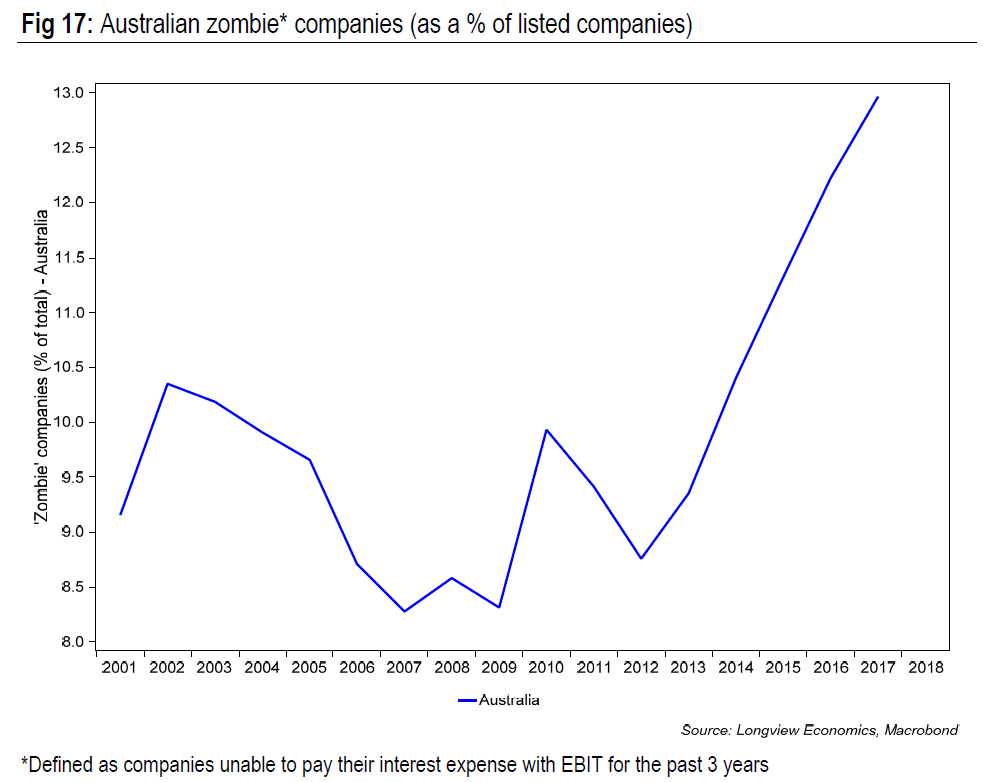
In the years since, and with commodity prices trending lower, Australia has turned towards domestic consumption as its key growth driver. That’s not been underpinned, though, by strong productivity and wage growth, but by cheap money, rising asset prices, wealth effects and another phase of high/rising indebtedness. Indeed, wage and productivity growth have stagnated/shrunk (figs 5 & 15) while household debt has risen to >120% of GDP; the household savings rate has fallen (fig 14); housing valuations have become extreme (fig 13a) and, in aggregate, Australia still runs a current account deficit (with large/rising levels of external debt). This is further and ongoing evidence of ‘overconsumption’ in Australia (fig 16). Of note, the structural state of corporate sector has also deteriorated, evidenced by the growing share of ‘zombie’ companies to high/extreme levels (fig 17).
As the Fed and other central banks continue to tighten monetary policy, Australia should be amongst the most vulnerable to that tightening (along with certain other Anglo-Saxon economies, e.g. the UK). In that sense, weakness in Australian asset prices and the economy will probably serve as a ‘canary in the coalmine’, i.e. an early indication that central banks are reaching (or close to) a point of overtightening.
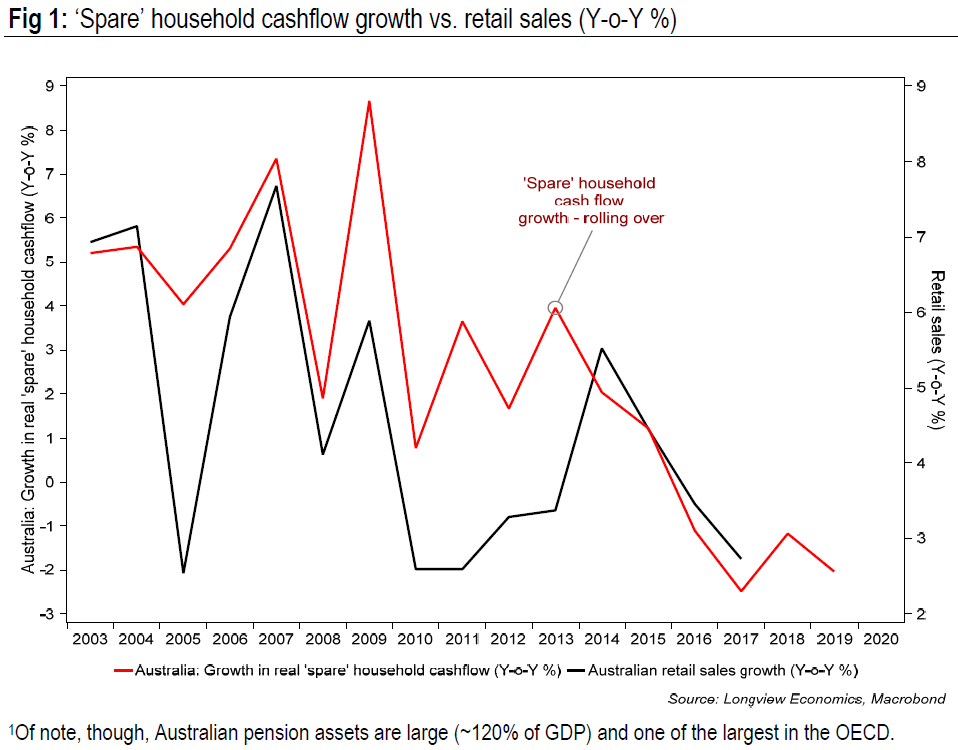
In particular for Australia, though, the growth outlook primarily hinges on household consumption, which accounts for ~60% of GDP. In that respect (and in some ways linked to global monetary tightening), real ‘spare’ household cashflow growth is likely to deteriorate further in 2018 & 2019 (fig 1). While there are multiple moving parts to our cashflow model, the overarching drivers of that ongoing deterioration are:
- A tightening of credit conditions;
- A weak house price outlook;
- Associated negative wealth effects;
- Weak/falling wage growth; and
- Poor quality employment growth, largely driven by part time workers.
Points 1 – 3 are, ultimately, linked to a tightening of policy (in this case regulatory) and should deteriorate further as/when the RBA move interest rates higher. Points 4 & 5 relate to labour market slack (which is likely to result in an ongoing low/falling wage growth outcome). All of that suggests that household cash flow growth is likely to remain weak this year and next (i.e. probably at/below ZERO growth, see fig 1 & table).
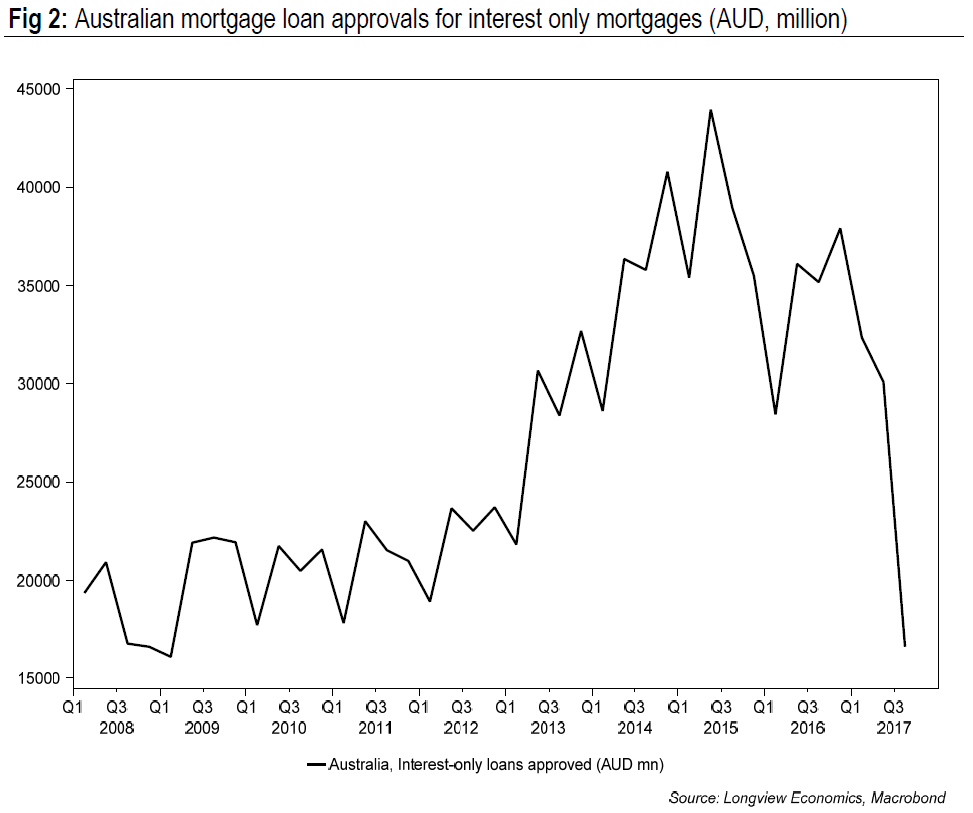
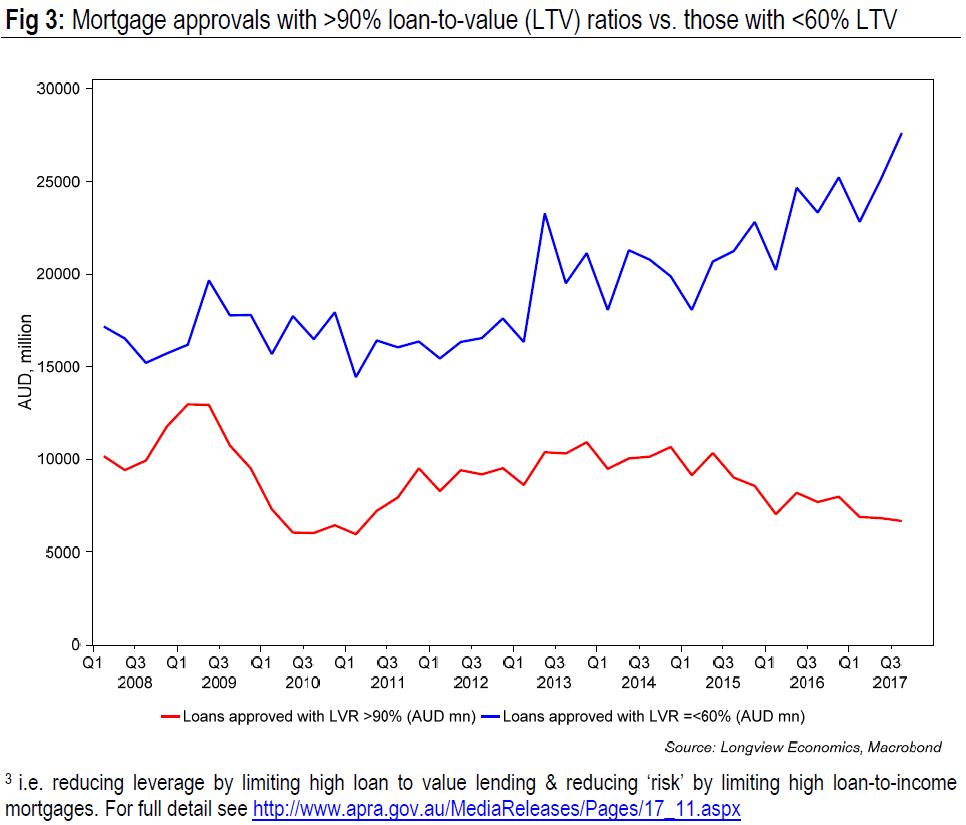
1) Credit conditions have tightened significantly. Most notably, stricter mortgage lending rules, introduced by APRA ~12 months ago, have delivered a marked regulatory tightening in Australia’s housing market. The new measures are designed to reduce leverage, speculative activity and ‘higher risk’ lending. From a house price and wealth effect perspective, there are therefore clearly negative implications (see point 2 below). From a household cash flow perspective, though, the mix of lending is likely to shift away from ‘interest only’ and towards ‘capital repayment’ mortgages. This will force households onto mortgage products with larger monthly payments. Of note, around 40% of outstanding mortgage debt in Australia is interest-only and loan approvals for interest only mortgages have fallen sharply; they have more than halved in the past 3 quarters (fig 2). As such, we expect mortgage ‘re-payment costs’ to grow rapidly this year and next and squeeze household cash flow growth at the margin (see table 1 for detail).
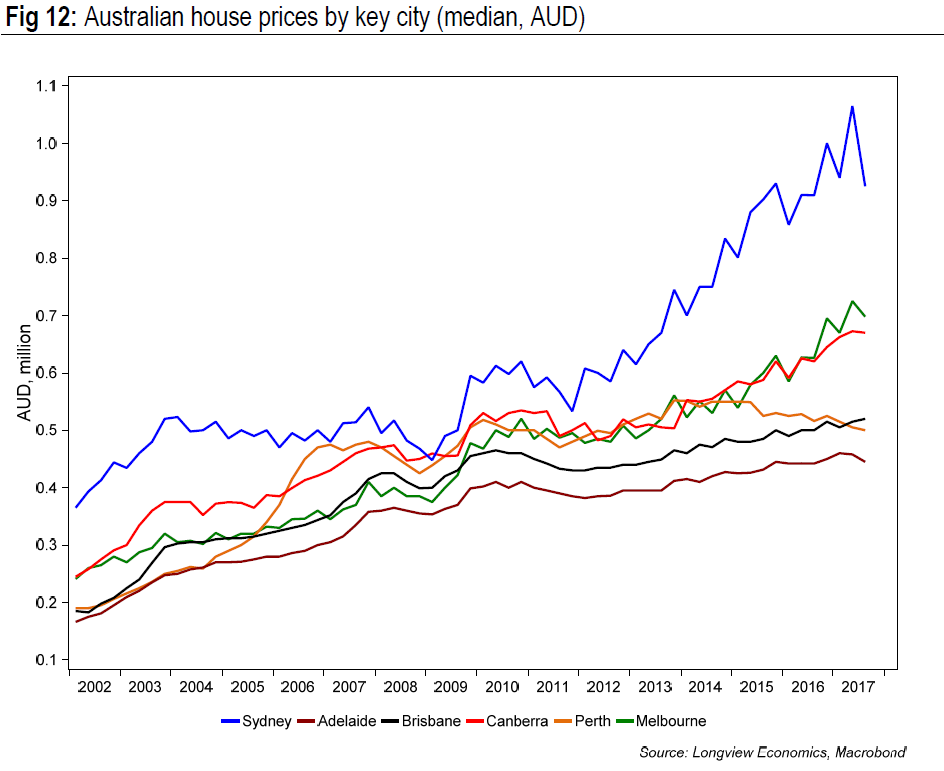
2) House price growth should slow due to tighter mortgage credit conditions, and with that, generate a negative wealth effect & weaker credit impulse (see point 3 below). Australia’s housing boom has been built on speculative activity and increasingly large levels of leverage. Buy-to-let investors account for ~1/3rd of outstanding mortgage loans. Those investors are negatively geared, with average rental yields (of ~3.1%) below mortgage rates (of ~4.0%+).
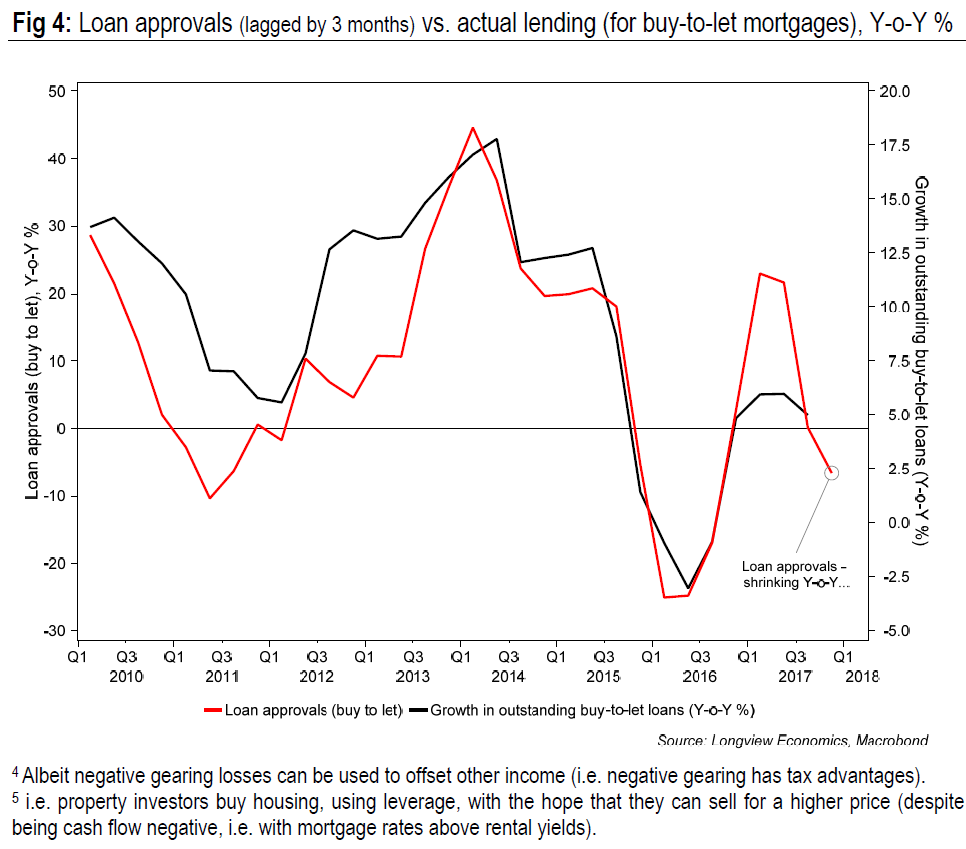
Given high valuations (fig 13a), Australian housing is therefore the definition of a speculative bubble. In that respect it’s vulnerable to tightening; either monetary and/or macro prudential. At some point, monetary tightening is likely as global central banks raise rates. At this stage, though, and as noted in point 1 above, regulatory tightening is significant and likely to result in weaker house price growth. In particular, loan approvals to buy-to-let investors are currently shrinking Y-o-Y. These typically lead actual buy-to-let lending by ~3 months (fig 4).
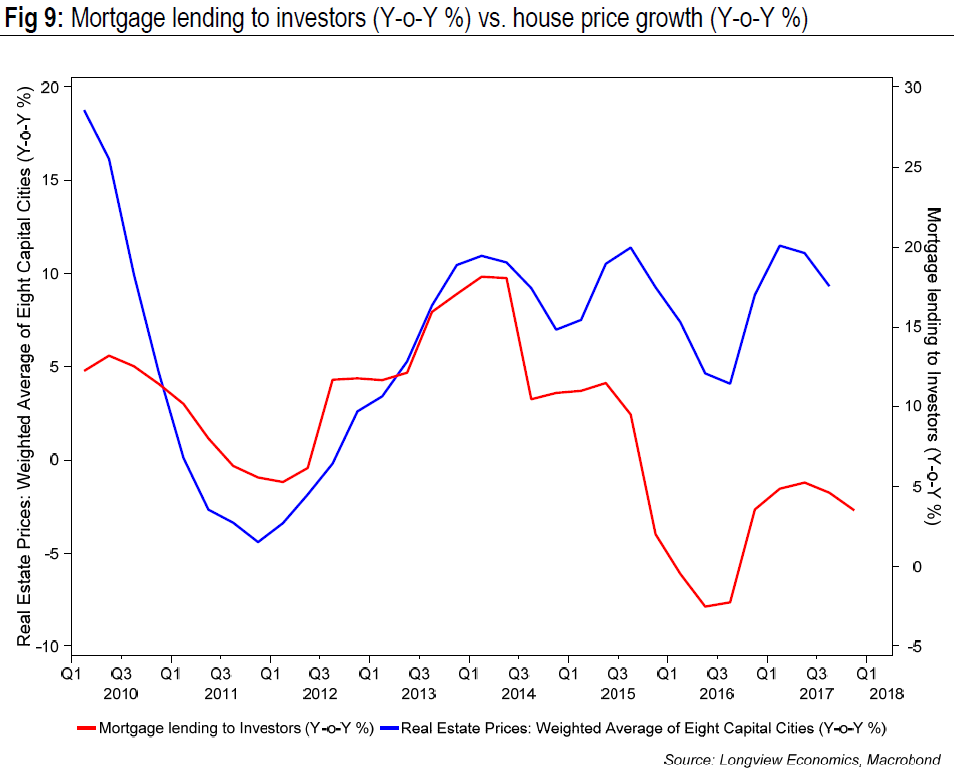
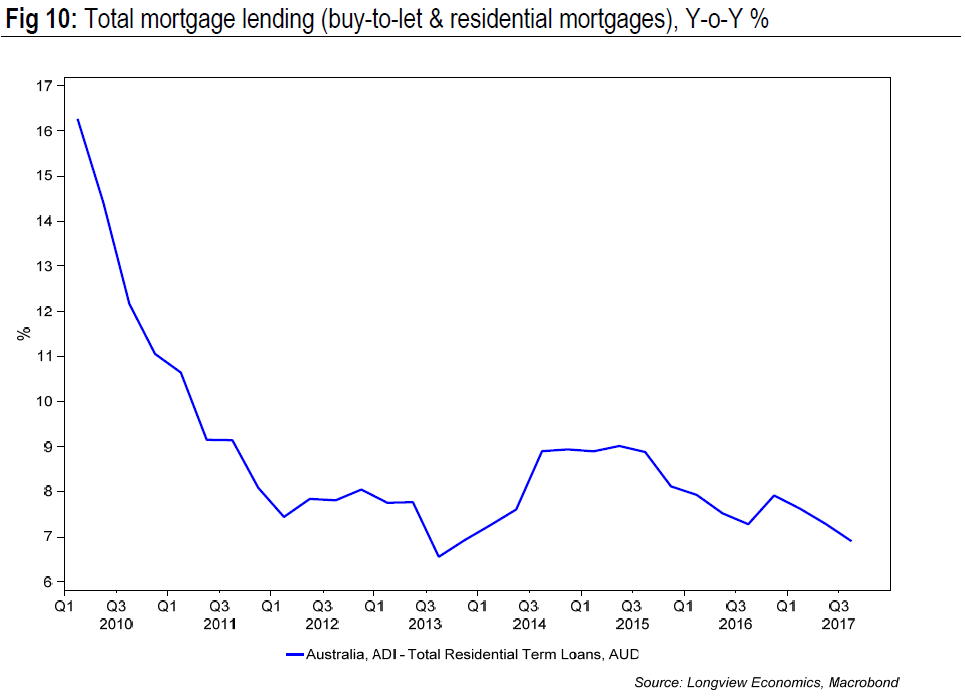
Unsurprisingly, investor lending growth is highly correlated with house price growth, which is therefore likely to soften (fig 9). It’s also notable that total mortgage lending, for both investor & owner occupier combined, has rolled over and is currently growing at one of its slowest growth rates in the past decade (fig 10).
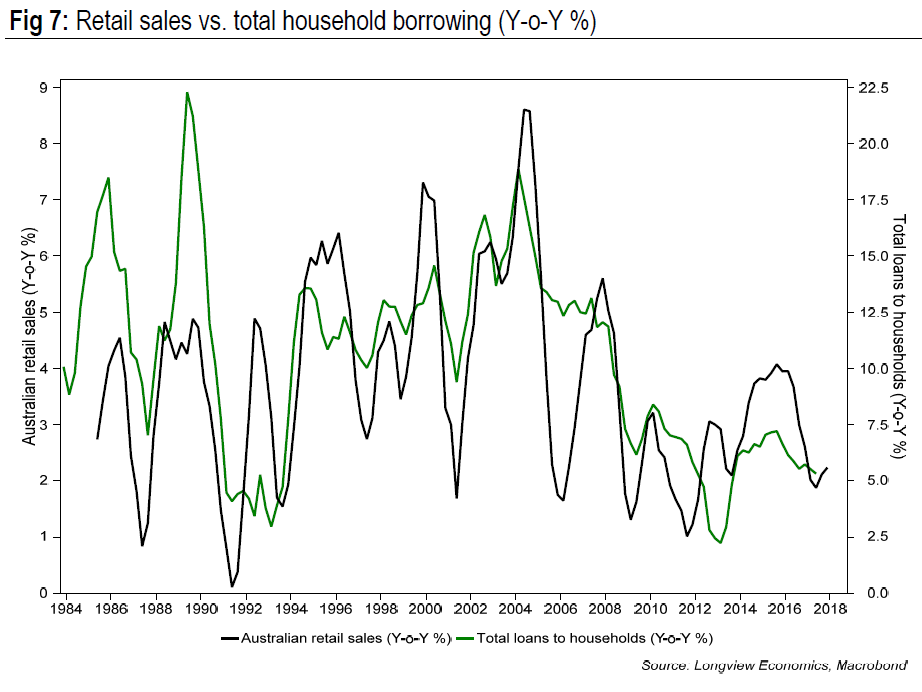
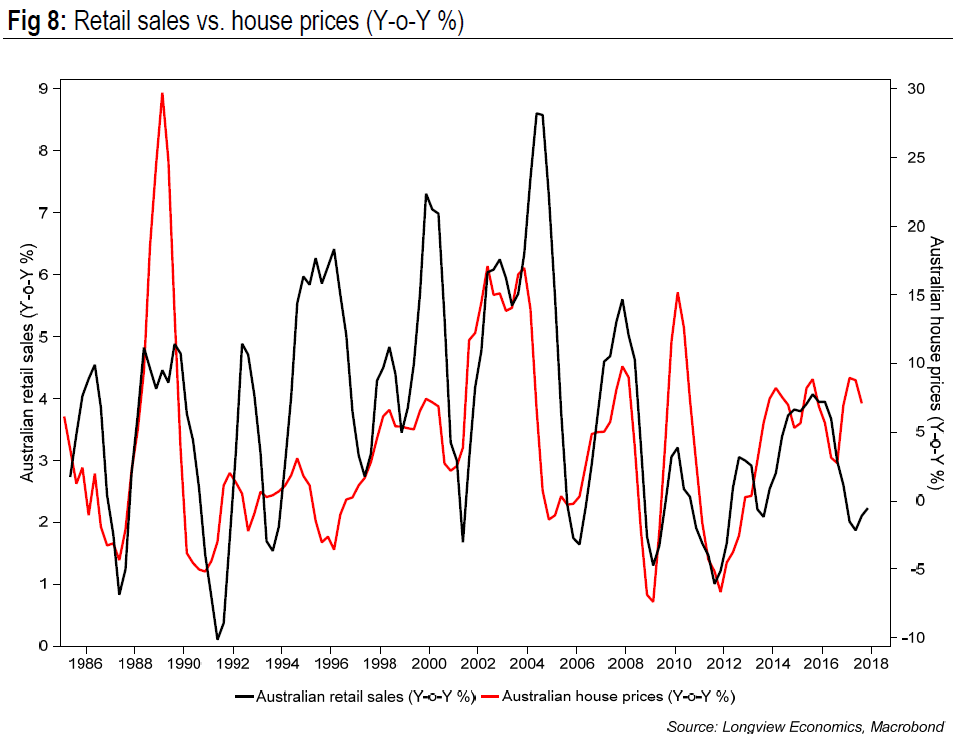
 3) Softer house price growth should result in a weaker credit impulse. In Australia, house prices, credit growth and consumption are all linked and reasonably highly correlated. Slowing house price growth and a further slowdown in mortgage lending should dampen appetite for consumer credit and home equity withdrawal. Typically, as we show in figs 7 & 8, that results in a slowdown in consumption, reflecting the weaker household cash flow growth outcome.
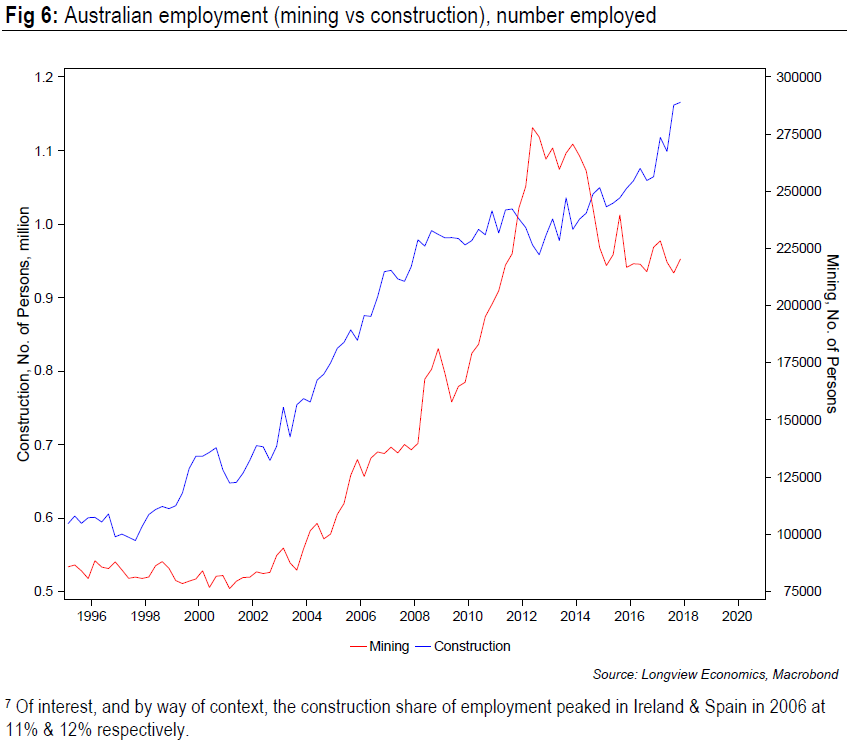
4) Wage growth is trending down, reflecting large levels of slack in the labour market. Key sources of slack, not surprisingly, include the mining sector (driven by falling metals prices) as well as strong immigration flows. As such, both unemployment and under-employment rates are high (in fig 18 we combine those two rates, which gives the ‘under-utilisation’ rate).
Even though workers are moving back into the labour market (see the rise in participation), the number of people outside the labour market is still high, having trended higher since 2008. While there’s still ample slack, and in the absence of a renewed uptrend in metal (and other commodity) prices, Australian wage inflation is unlikely to pick up.
 5) Employment growth, while rapid at a headline level, is being driven by part time workers. Headline employment growth (currently 3.3%) is therefore somewhat misleading, and not translating into strong household cash flow growth.
Of total Australian employment, 32% of jobs are part time. Those part-timers have accounted for 56% of the growth in employment in the past two years.
It’s not surprising therefore that total household income only grew by 2.2% last year, compared to combined growth in headline employment and wages of ~4.0%. In our model (table 1) we assume that dynamic continues this year and next. We would also note that construction employment, while it only accounts for ~9% of the total, has also been a key source of job creation, accounting for 18% of total employment growth in the past 5 years. Given the tightening of housing/credit conditions, and the case for softer house prices/housing activity, there are therefore question marks over how much more this sector can drive total employment.
With construction, total employment is currently up 3.3% Y-o-Y. Without construction, though, it would be up by 2.8% (i.e. 0.6pp less).
Zombies, canaries, and cheap money
Hear more of my views on the global and Australian economies in my recent interview with Livewire.
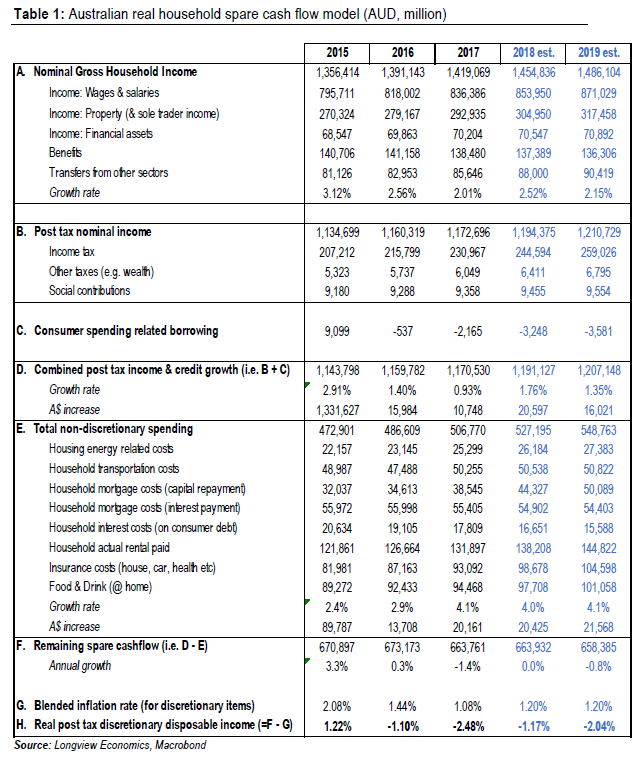
Australian household cash flow model – key assumptions: Income from wages & salaries (most of total income) should grow slowly this year & next, i.e. by around 2% (see points iv & v above). As house price growth softens we’d also expect consumer related borrowing (which is consumer credit & some mortgage equity withdrawal) to remain weak/deteriorate. Spending on non-discretionary items continues to grow at around 4% (with much of that increase driven by ongoing/rapid growth in mortgage capital repayments). We assume that the blended inflation rate for discretionary items stays low relative to historical standards.
Never miss an update
Enjoy this wire? Hit the ‘like’ button to let us know.
Stay up to date with my current content by
following me below and you’ll be notified every time I post a wire
Longview Economics, founded in 2003 by Chris Watling, is an independent research house based in London, providing three distinct yet interrelated groups of research products: Short and medium term market timing; Long term global asset allocation advice; and Global thematic, macro and commodities research.

5 topics

Longview Economics, founded in 2003 by Chris Watling, is an independent research house based in London, providing three distinct yet interrelated groups of research products: Short and medium term market timing; Long term global asset allocation...
Expertise
Longview Economics, founded in 2003 by Chris Watling, is an independent research house based in London, providing three distinct yet interrelated groups of research products: Short and medium term market timing; Long term global asset allocation...
Expertise
Comments
Comments
Sign In or Join Free to comment
most popular
Investment Theme
If 24 LICs ran the Melbourne Cup, which ones would we back?
Affluence Funds Management